Top 3 Price Prediction Bitcoin, Ethereum, XRP: Crypto market seems ready to rally
- Bitcoin price relatively unchanged since January 7, continues to hover between $40,000 and $43,000.
- Ethereum price structure, like Bitcoin's, appears to be developing a higher low pivot.
- XRP price maintains a critical support zone, showing strength while Bitcoin and Ethereum adjust lower.

Bitcoin price continues to sit on top of the neckline of a head-and-shoulders pattern, generating anxiety amongst bulls and bears alike. Ethereum price is testing the daily Tenkan-Sen as a support zone that could turn into a higher low. While BTC and ETH have suffered some selling pressure through the day, surprisingly, XRP has held relatively tough at the $0.75.
Bitcoin price developing a likely higher low before beginning a new push higher
Bitcoin price is sitting in a precarious position on its daily Ichimoku chart. The daily Tenkan-Sen and neckline of a head-and-shoulders pattern share a value area between $41,000 and $43,000. Bitcoin has spent the last twelve trading days within that range.
The Relative Strength Index (RSI) remains in bear market conditions, with the RSI line currently at 35 – just above the first oversold level of 30. Finally, the Composite Index oscillator shows the most immediate warning to some downside pressure, with its line showing signs of crossing below its fast-moving average from neutral conditions – a very bearish warning signal.
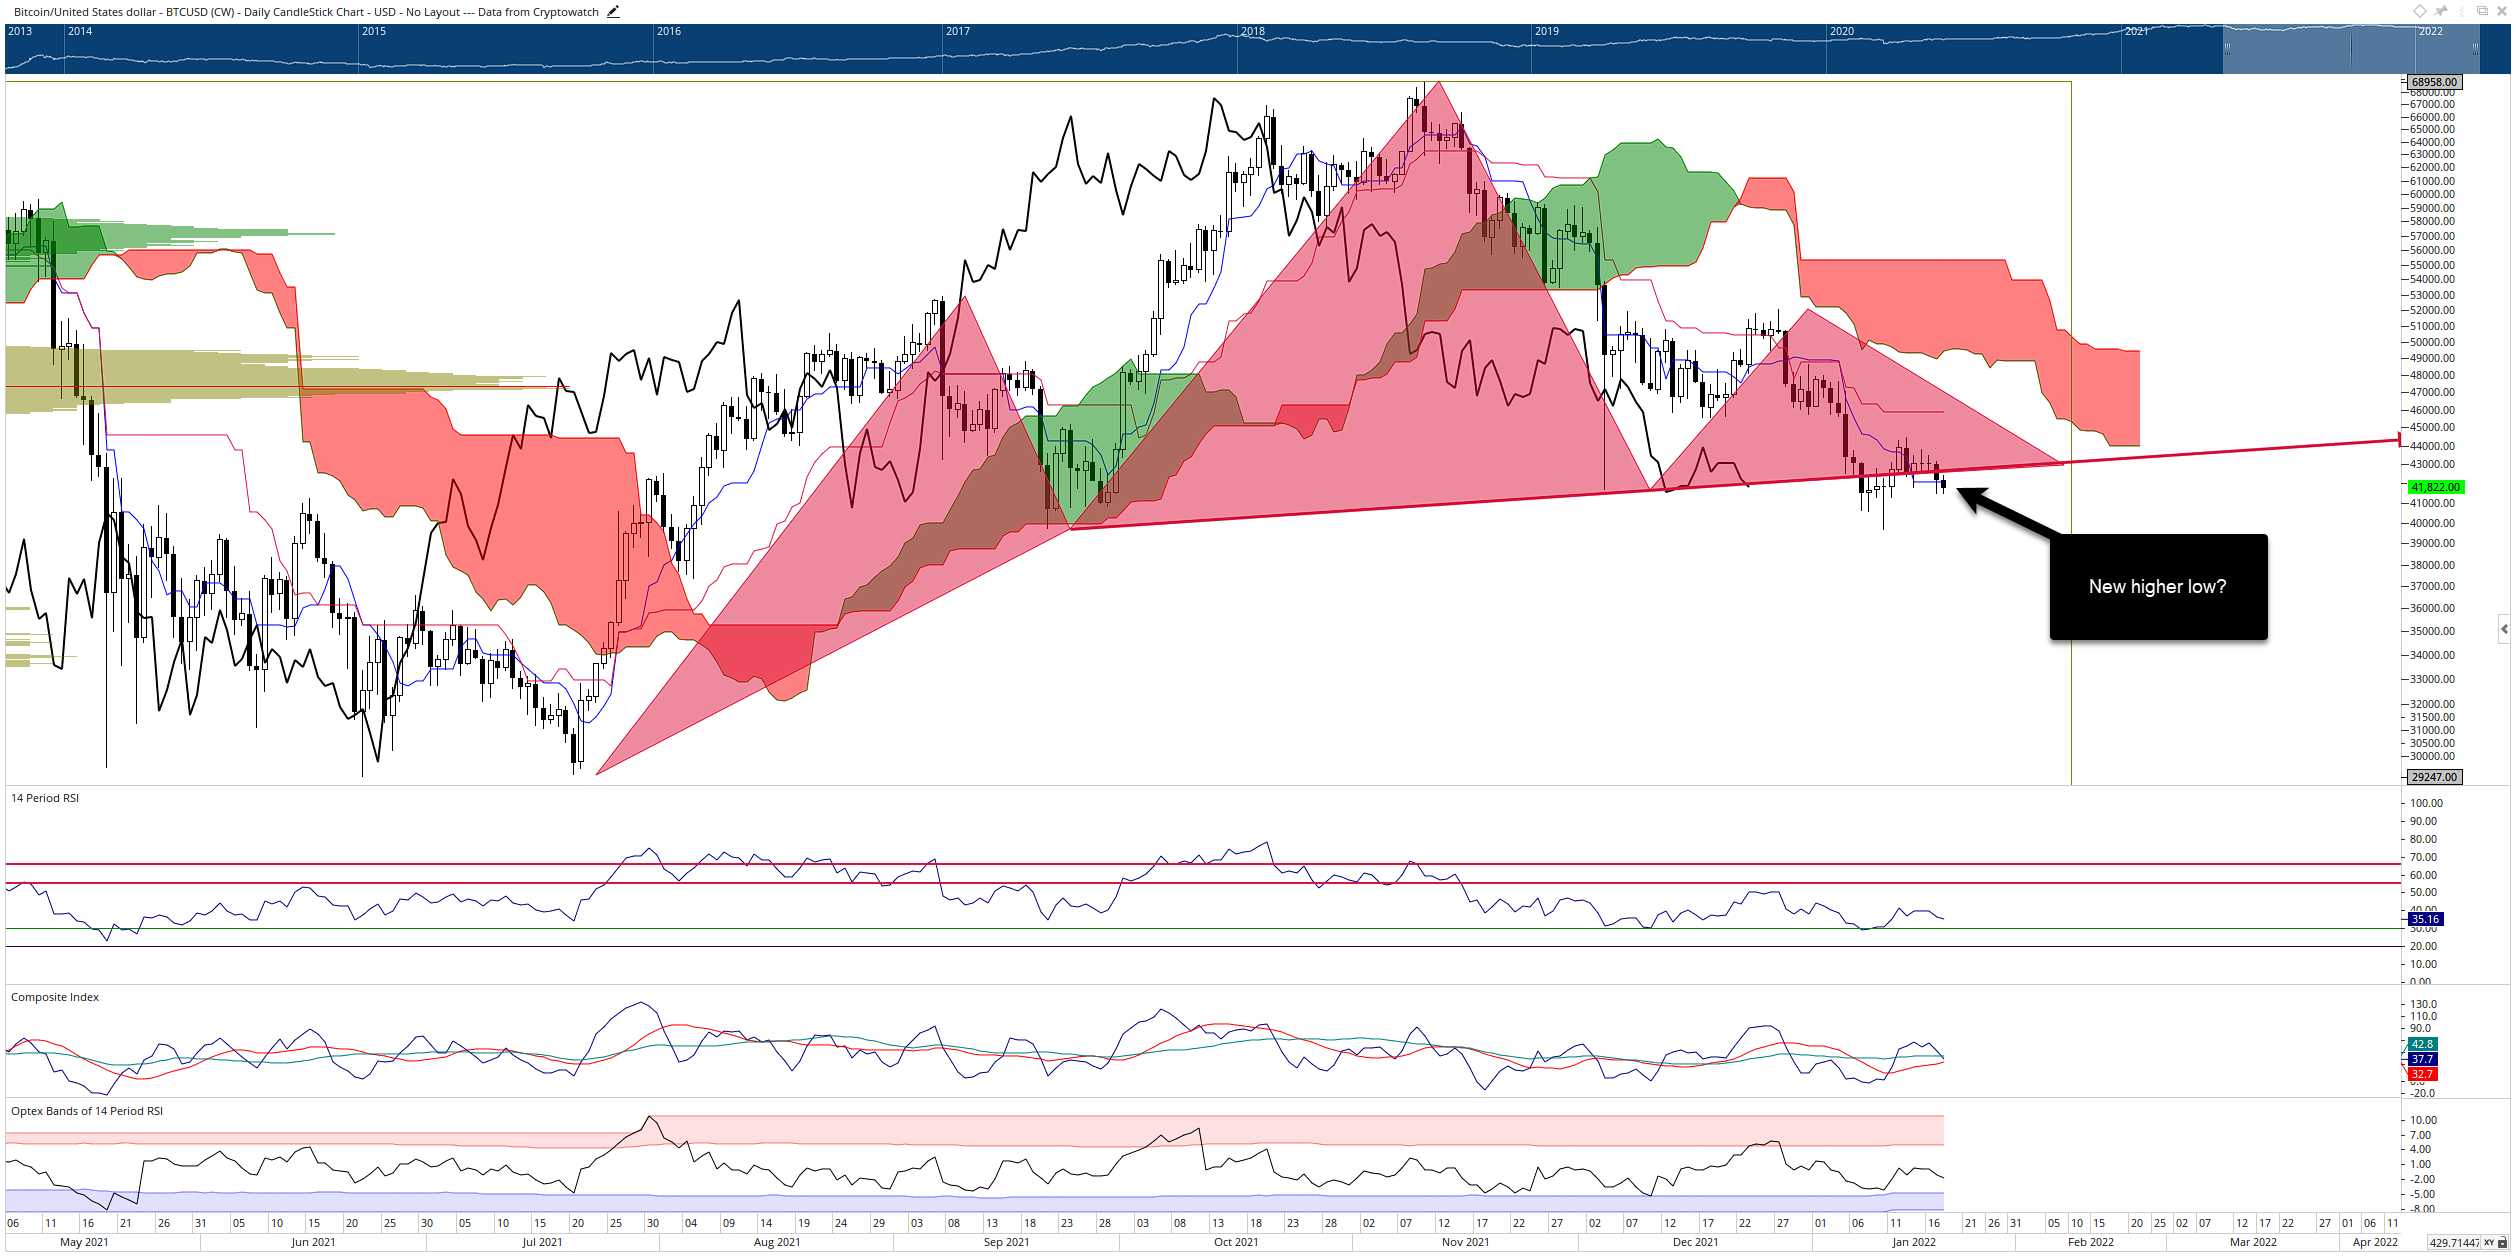
BTC/USD Daily Ichimoku Kinko Hyo Chart
However, Bitcoin has been overwhelmingly bearish since the beginning of 2022, but bears have been unable or unwilling to generate a substantial sell-off below the $40,000 price level. Therefore, if Bitcoin can maintain support near the daily Tenkan-Sen at $42,000, it will achieve a higher low and create the pivot necessary to begin a new leg higher.
Ethereum price developing bullish higher low pivot that could propel ETH to $4,000
Ethereum price action is very similar to Bitcoin's current price actions, especially the past twelve trading days. Ethereum tagged a low below the $3,000 value area last Monday but promptly moved higher and out of that zone to consolidate at the present $3,100 value area. Last week's weekly close was strong and provided the support necessary to give traders a bullish near-term outlook. But bulls need to follow through and support price.
If Ethereum price were to close below its weekly chart today, it would be the lowest close since the week of September 24, 2021, or an eighteen-week low. Indeed, some continued weakness is expected, especially if risk-on markets like stocks continue to face selling pressure. However, today's weakness has developed an ideal bullish reversal entry opportunity on the $0.50/3-box reversal Point and Figure chart.
A bear trap setup is currently present on the Ethereum price Point and Figure chart. The hypothetical long entry is a buy stop order at $3,450, a stop loss at $3,250, and a profit target at $4,300. This trade represents a 4.25:1 reward/risk setup with an implied profit target of 25% post entry. A two-box trailing stop would help protect any profit generated post entry.
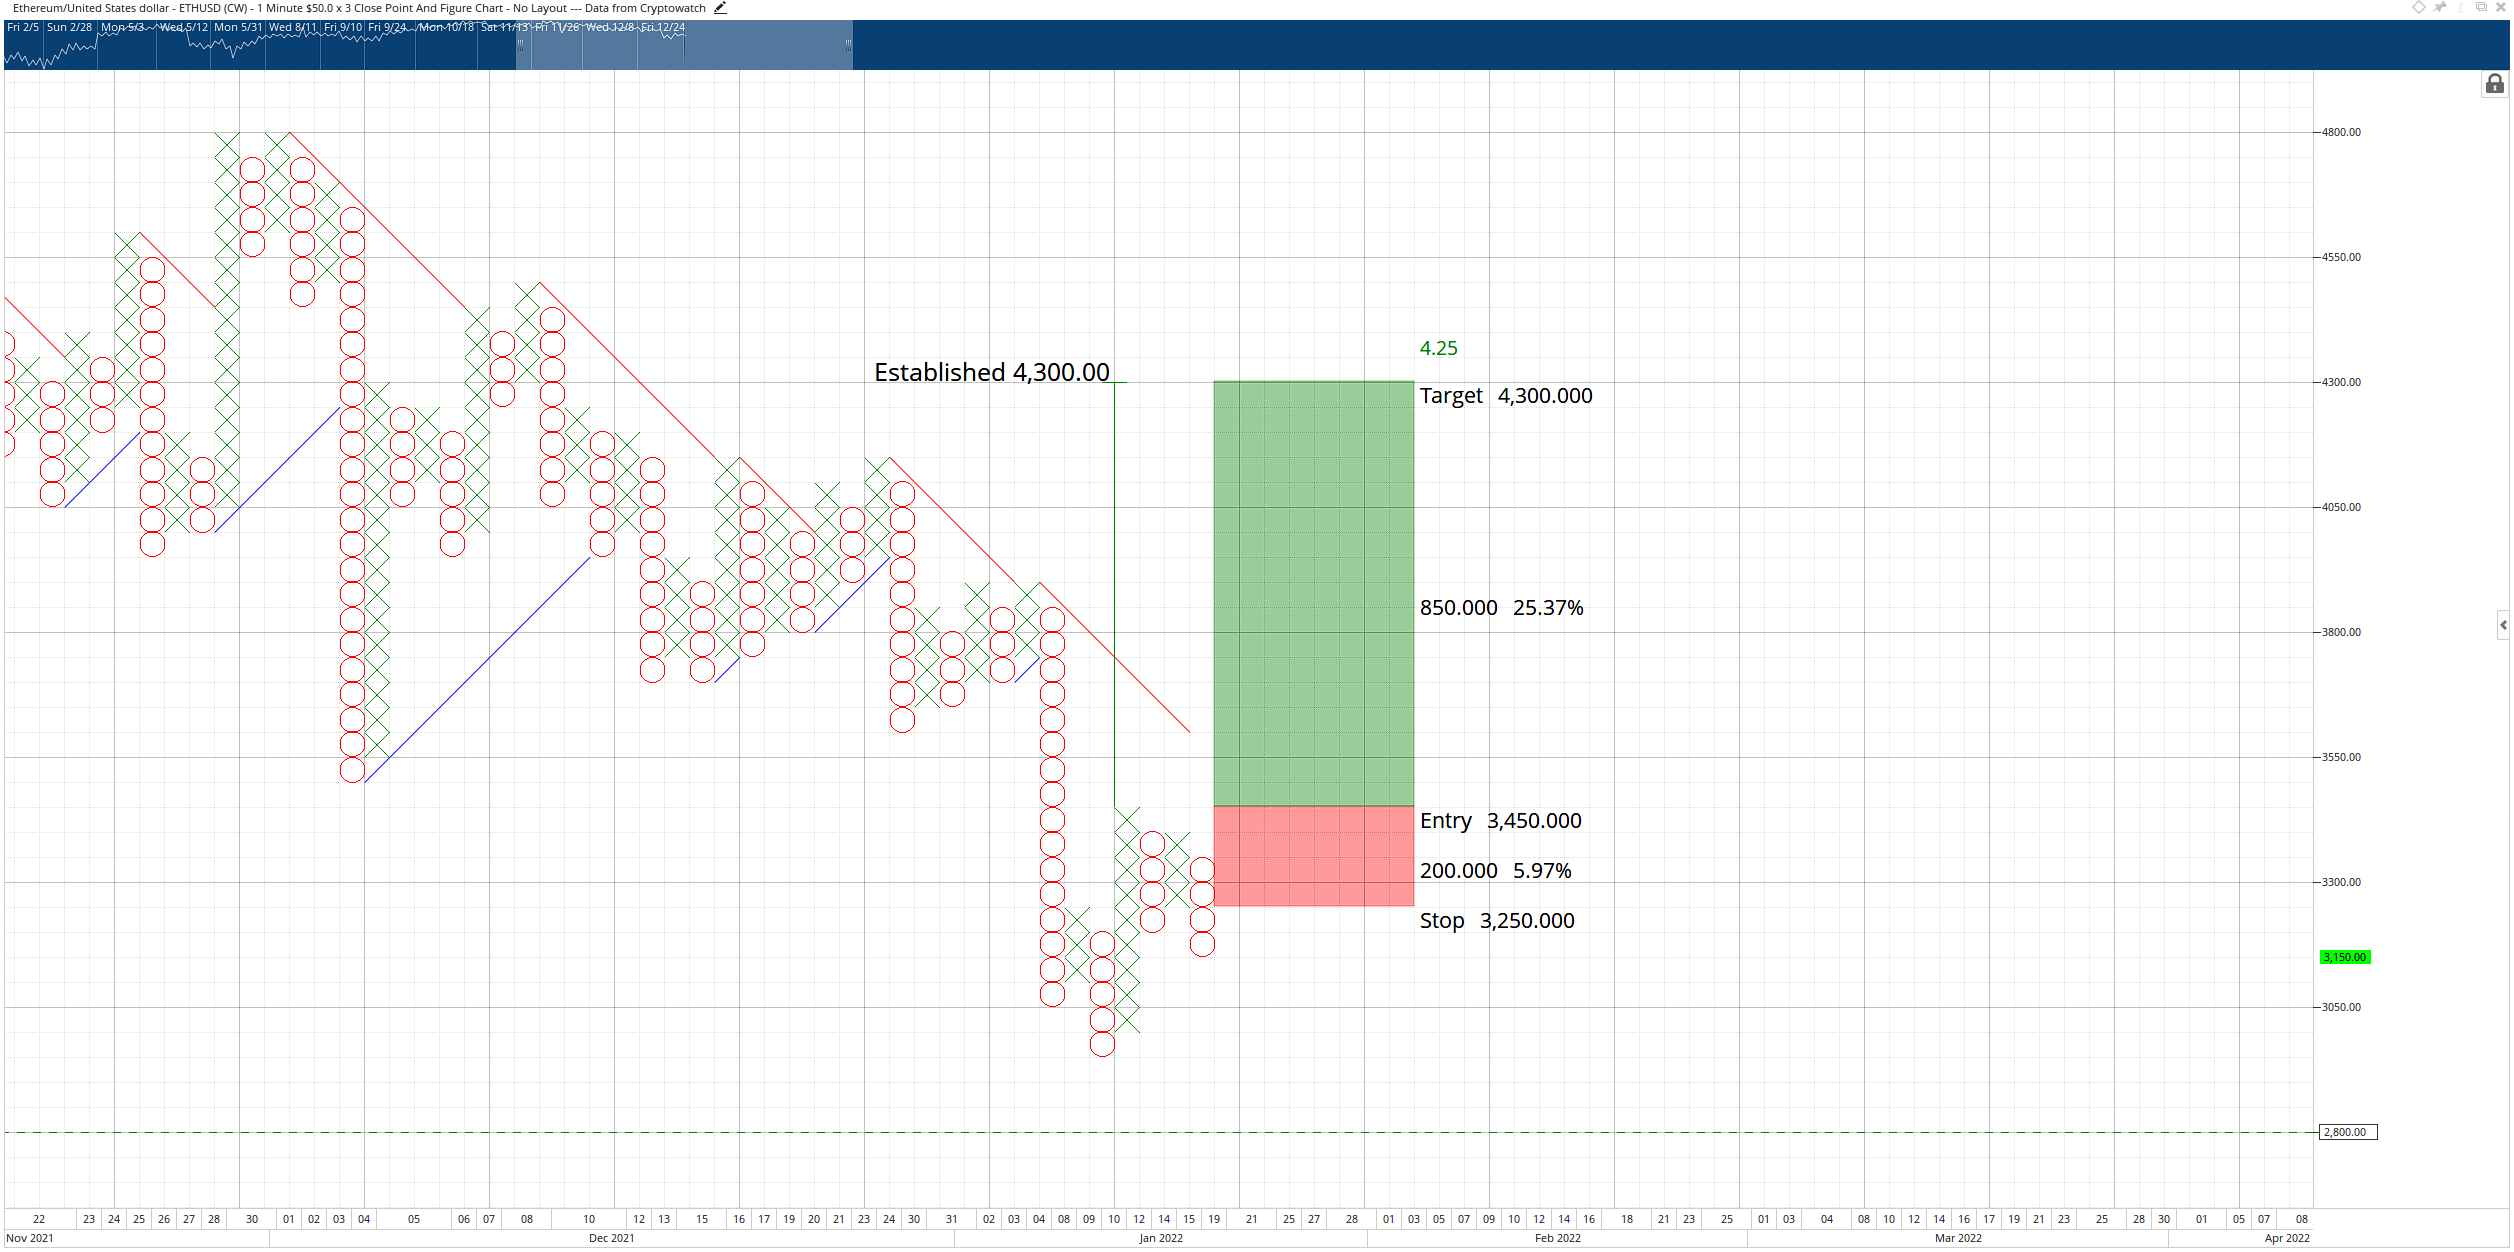
ETH/USD $50/3-box Reversal Point and Figure Chart
The hypothetical long setup is invalidated if Ethereum price moves to $3,000.
XRP price develops base before pushing higher
XRP price has been a bit of a surprise this week, trading lower but not as bad as many altcoins and even outperforming Ethereum. XRP is down only 3.5% so far for the week compared to Ethereum's more significant 6%. A strong base and range near the critical $0.75 value area continues to develop.
In the short-term, XRP bulls need to return above the Tenkan-Sen; a daily close at or above $0.76 is necessary. Failure to do so could entice further selling pressure and push XRP price to a capitulation move that targets the $0.50 level.
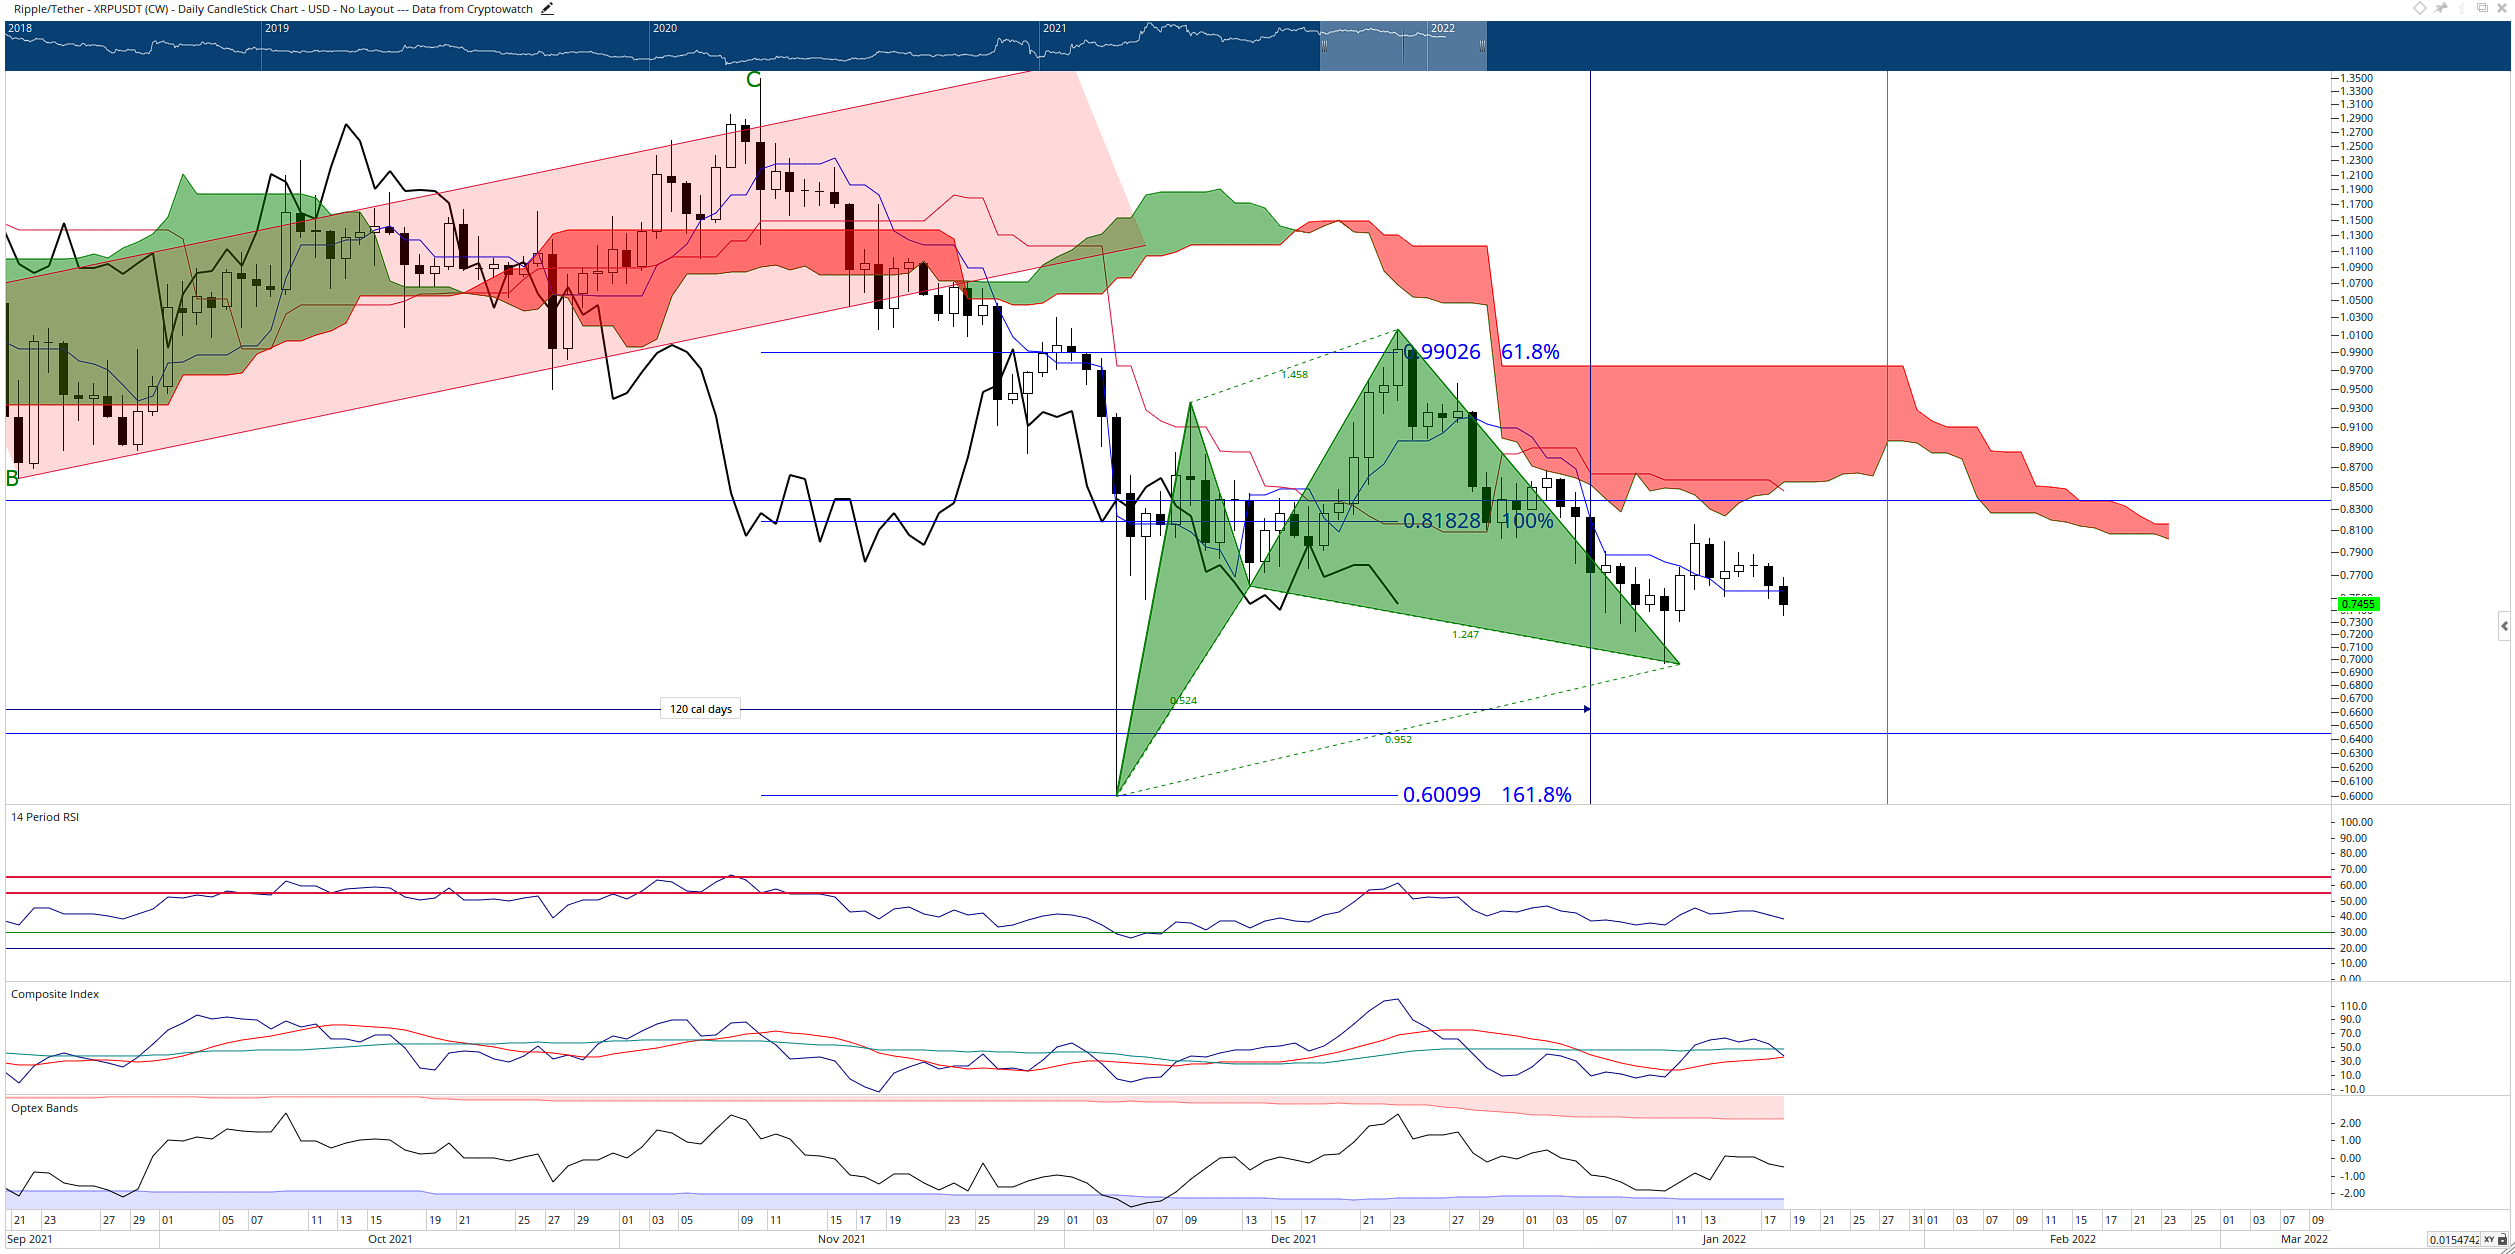
XRP/USDT Daily Ichimoku Kinko Hyo Chart
The majority of price hurdles that XRP price must break are at the $0.86 zone. The bottom of the daily Cloud (Senkou Span A), 38.2% Fibonacci retracement, 100% Fibonacci extension, and Kijun-Sen share the $0.86 resistance zone. If XRP bulls can move above that zone, the road to $1 is much easier.
Author

Jonathan Morgan
Independent Analyst
Jonathan has been working as an Independent future, forex, and cryptocurrency trader and analyst for 8 years. He also has been writing for the past 5 years.



