Top 3 Price Prediction Bitcoin, Ethereum, Ripple: Why is the market falling today?
- War for dominance impacts the market and heralds several days of turbulence.
- Fight between Bitcoin and Ethereum hurts the Altcoin segment, which is largely overbought after weeks of euphoria.
- Ripple is the most affected of the Top 3 and steps back into a high-risk environment.

The trading week is coming to an end, and the crypto market leaders seem to be inviting people to go on holiday and come back in a few weeks to see if anything has happened by chance.
The current low volatility is never comfortable for the active trader, aware that today's extreme calm is the prelude to an explosion of instability in the future.
The strategy is simple, boring to the limit, permanent doubt and mental exhaustion.
The result is unsubstantiated decisions because there is not enough information to make any decision.
In the inter-relational structure of the market, the low volatility versus the "old economy" of fiduciary currencies does not have as much impact, and there is information to extract and analyze.
After the daily analysis of the dominance charts and the ETH/BTC pair, today I am presenting the scenario that, in my opinion, has the best chance of materializing.
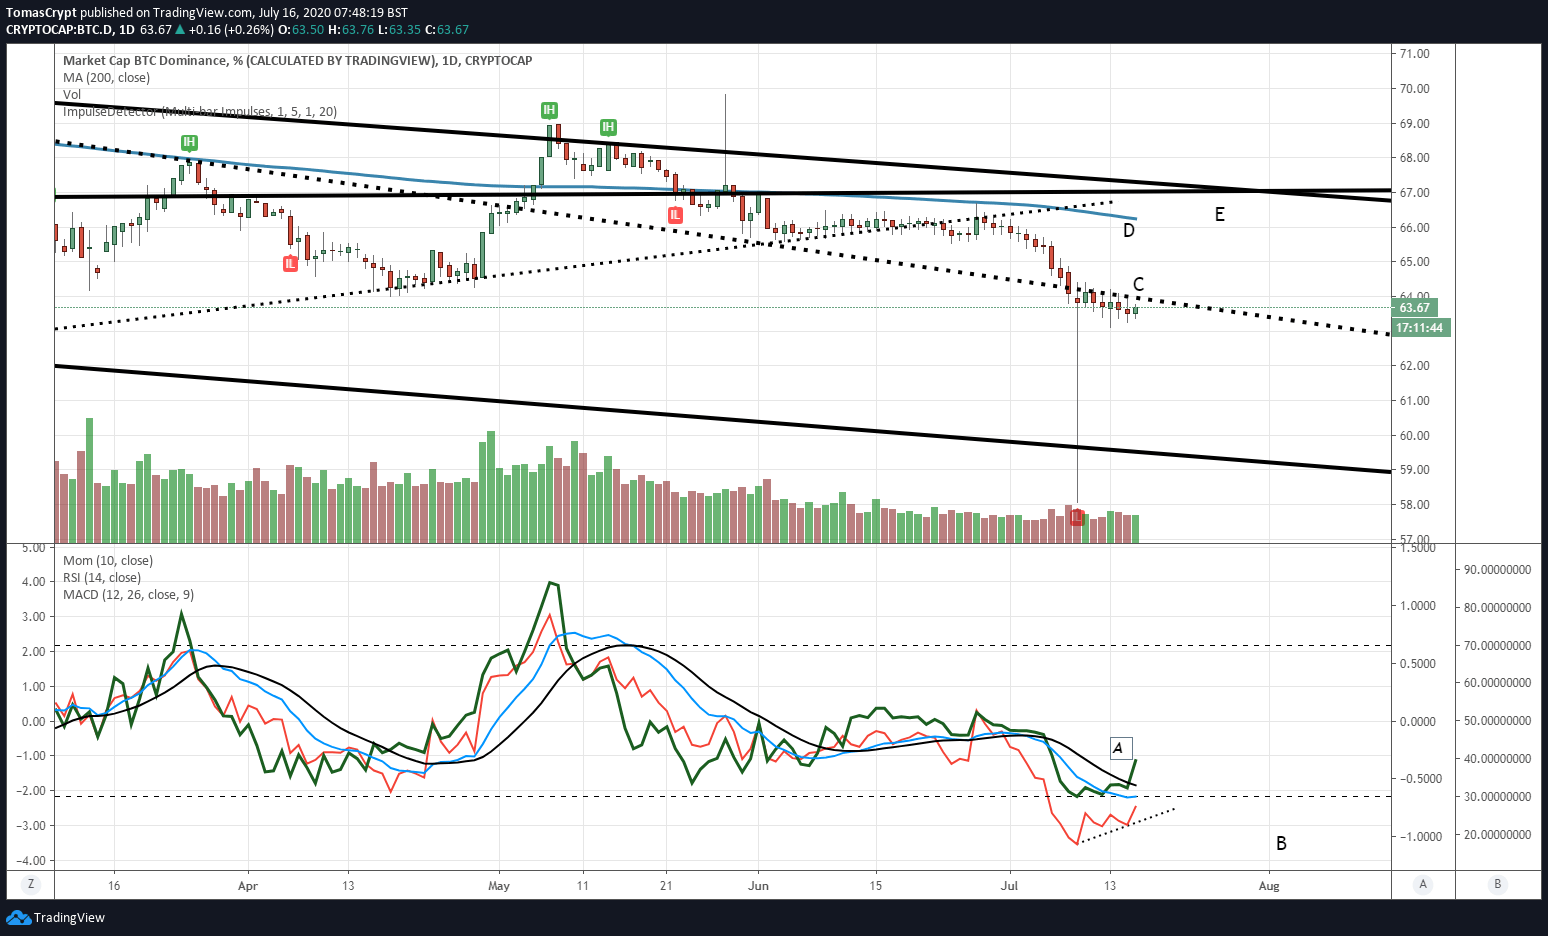
In the Bitcoin dominance chart, there was a short-term buyers’ interest, with a rising momentum (A) and a divergent-structured RSI (B). The resistance to being beaten (signal) is at the 64th Dominance level (C), and the targets could be at the 200-day simple moving average (D) at the 66.25 level first, then the bearish channel ceiling at 67.14 (E).
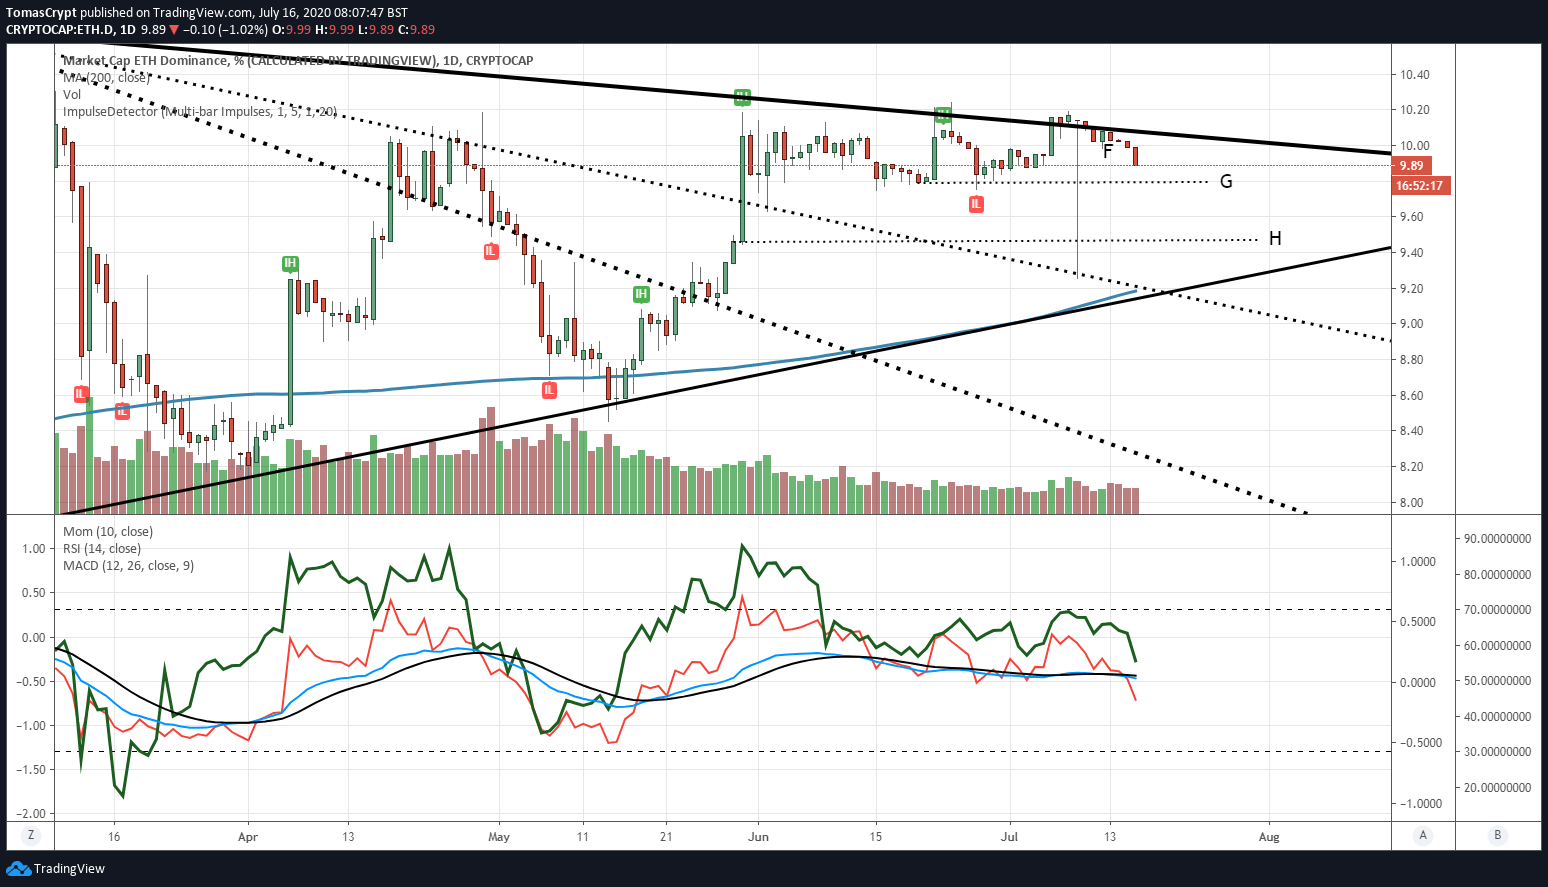
In the case of Ethereum the chart shows how it got back into the bearish scenario (F), and today it is losing the 10% dominance level. Moreover, it heads first towards the 9.79% (G) level, then at 7.49 (H), where it could find second support. The technical indicators show a very aggressive bearish profile, which indicates that the movement may be intense and of some duration.
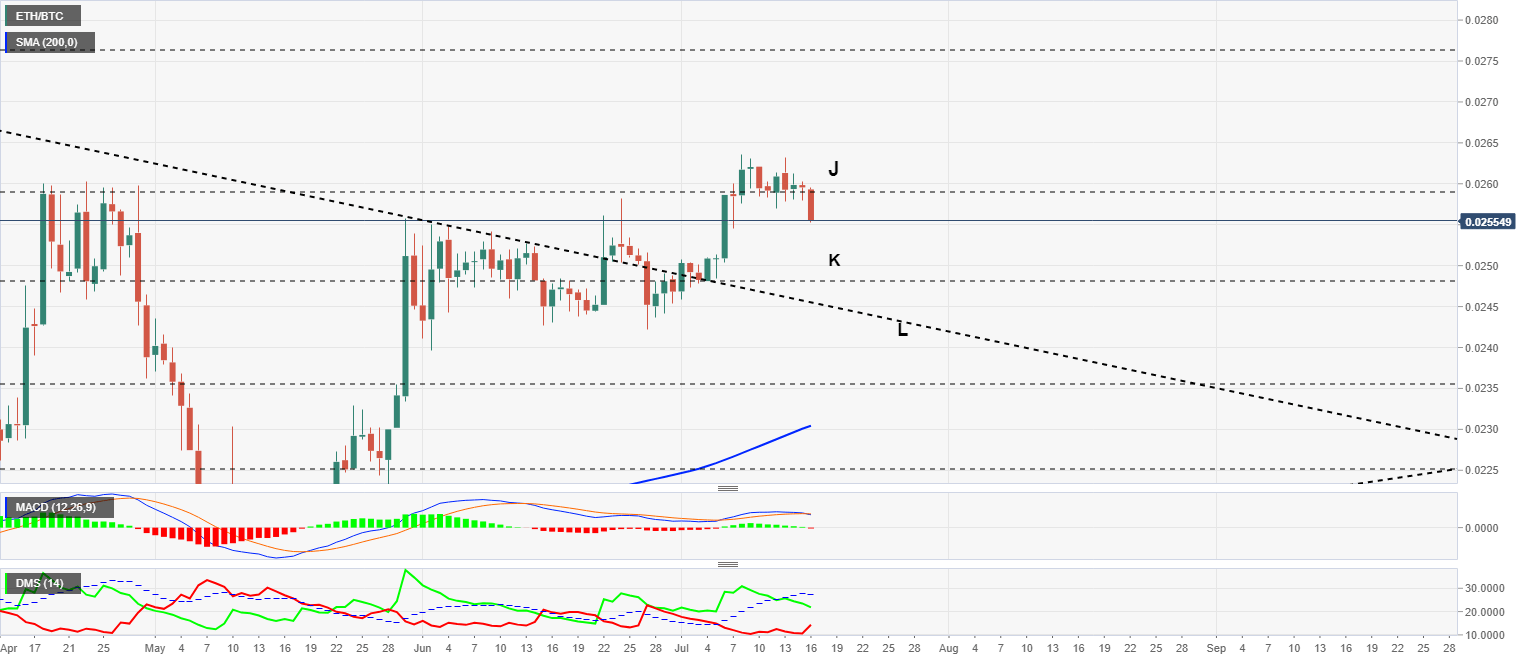
The ETH/BTC chart holds the key to this scenario. The crypto cross is losing its support level at 0.0258 (J) and moves quickly to the first support level at 0.0248 (K). From this support level, the movement could extend to the trend line that marks the upper limit of the triangle figure in the previous scenario (L).
The result of the joint observation of the three graphs indicates and is happening right now, increases in Bitcoin versus Ethereum and the Altcoin segment in the short term. When the Bitcoin dominance chart reaches its targets, the ETH/BTC chart will have found support, and there will be a new turn/ In this scenario, Ethereum will again take the lead in the dominance war.
.
ETH/BTC Daily Chart
ETH/BTC is currently trading at 0.02549 and, as discussed in the scenario analysis, is moving fast in search of support.
Above the current price, the first resistance level is at 0.0248, then the second at 0.0275 and the third one at 0.0298.
Below the current price, the first support level is at 0.0248, then the second at 0.0276 and the third one at 0.0235.
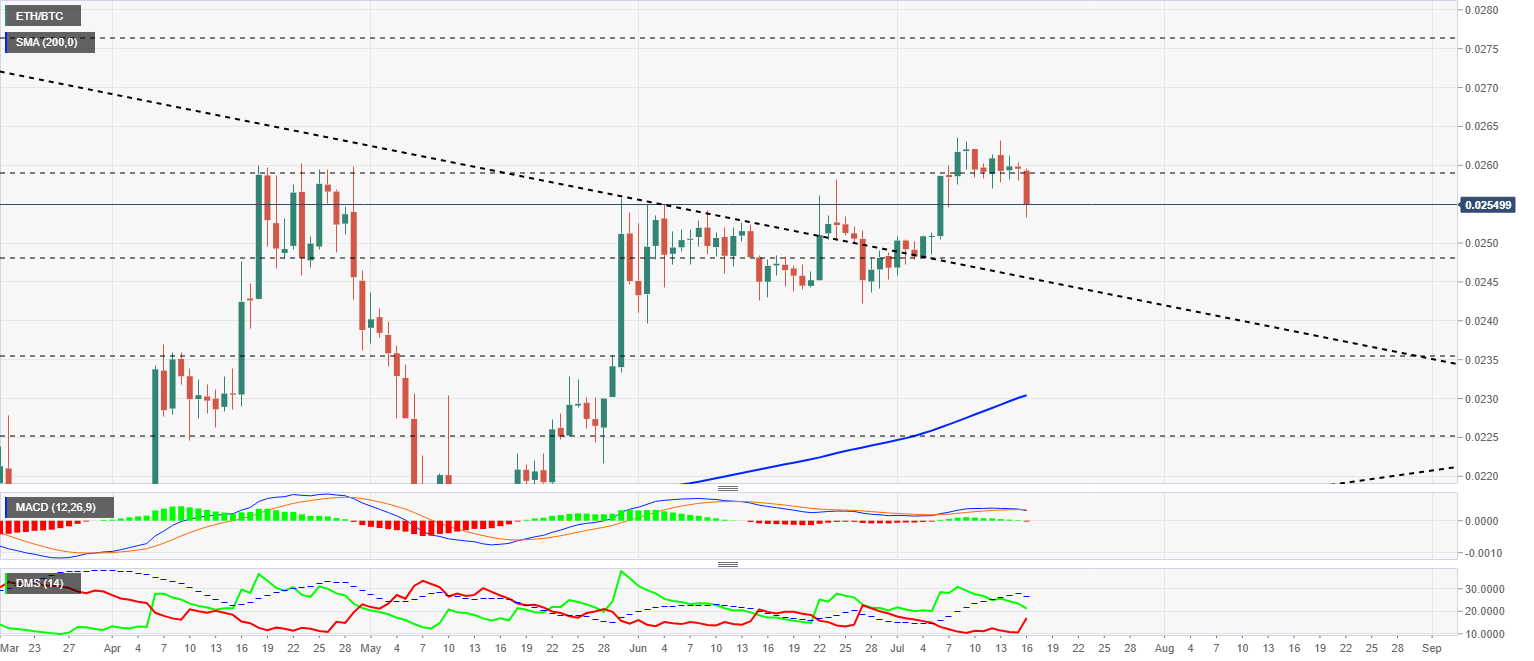
The MACD on the daily chart is crossing downward and faithfully marks the movement that has begun a few minutes ago. The cross has room to move at least until it reaches the zero level of the indicator.
The DMI on the daily chart shows the bears reacting quickly to the upward movement and are very close to the sellers' positions. The bulls, which were not supported by the ADX line, confirm the weakness of the Ethereum and continue to lose strength. The pair is heading for a change in leadership.
BTC/USD Daily Chart
BTC/USD is currently trading at $9,120 and barely reflects the internal turbulence of the crypto board. The market makes a move for security and pivots towards the Bitcoin.
Above the current price, the first resistance level is at $9,200, then the second at $9,650 and the third one at $10,400.
Below the current price, the first support level is at $8,840, then the second at $8,535 and the third one at $8,200.
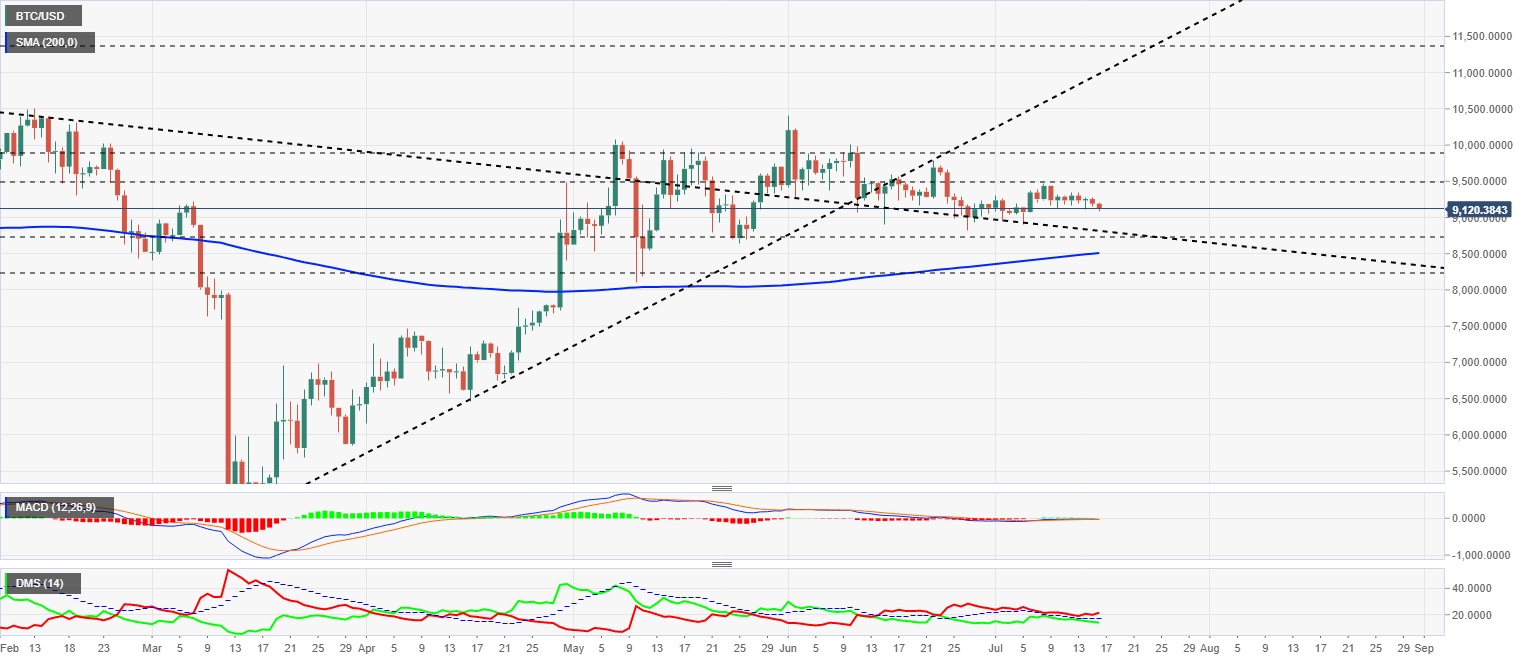
The MACD on the daily chart shows no change, although it could fall below the zero levels at the end of today's trading.
The DMI on the daily chart shows the bears gaining strength and moving away from the ADX line. The bulls continue to lose power and show no interest in discussing the pair's leadership.
ETH/USD Daily Chart
ETH/USD is currently trading at around $232, confirming that it will have a worse drop than that of Bitcoin in this bearish section. The King of cryptos has been in a downward phase for days now, while Ethereum is just beginning to develop its movement.
Above the current price, the first resistance level is at $234, then the second at $245 and the third one at $260.
Below the current price, the first support level is at $220, then the second at $200 and the third one at $186.

The MACD on the daily chart does not show a significant change in profile, but the impact at the end of today's session may have changed significantly.
The DMI on the daily chart shows the bears on the verge of snatching the lead from the bulls. Both sides of the market are on the ADX line, a position that will favor the winner of the fight.
XRP/USD Daily Chart
XRP/USD is currently trading at $0.1918 and will eventually fall victim to all of this technical fuss. Ripple is moving away from the bullish scenario and moving towards the few supports that separate it from hell.
Above the current price, the first resistance level is at $0.20, then the second at $0.202 and the third one at $0.21.
Below the current price, the first support level is at $0.184, then the second at $0.164 and the third one at $0.14.
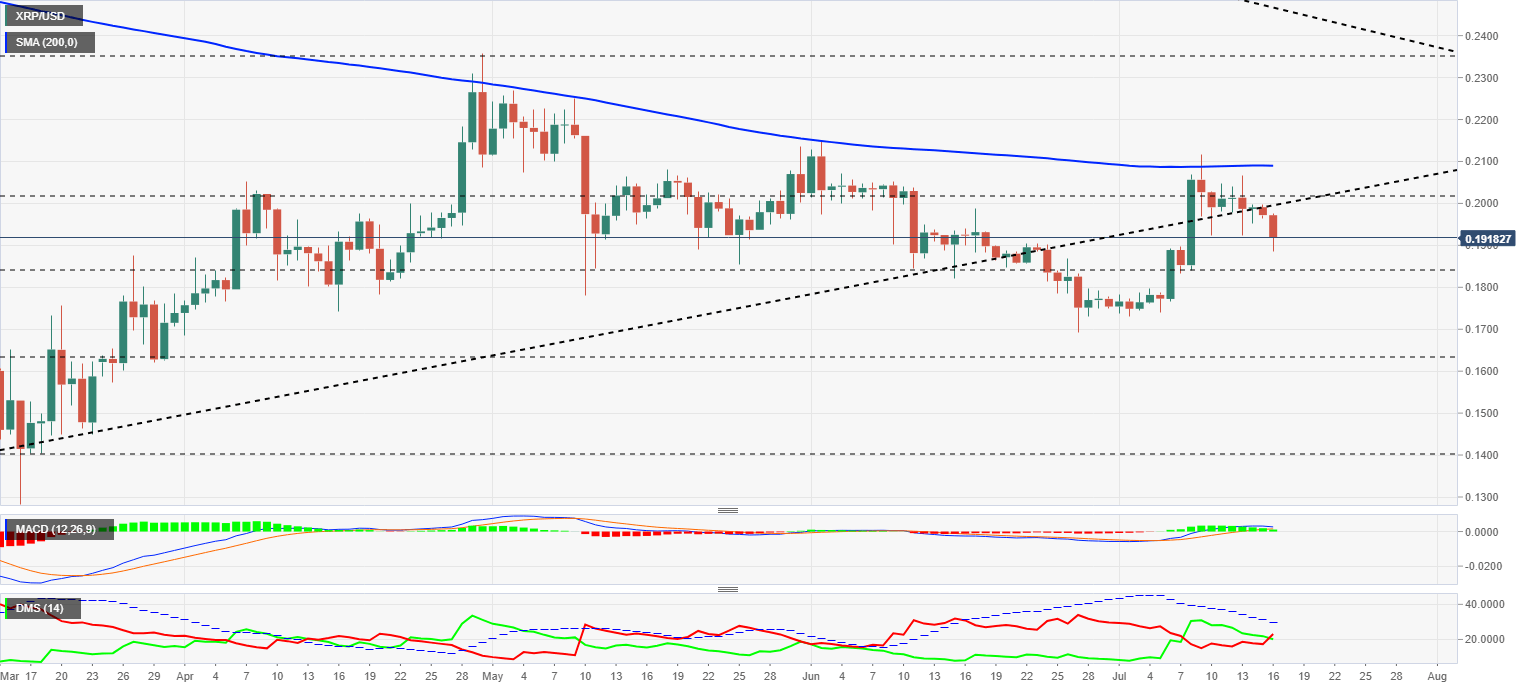
The MACD on the daily chart loses its bullish profile and goes down to look for support at the zero levels of the indicator. If the Ripple finds that support, it may have a chance to avoid the disaster.
The DMI on the daily chart shows the bears taking control of the pair although still below the ADX line. The bulls are still in positive territory despite the loss of the lead and could quickly regain control if new money appears.
Author

Tomas Salles
FXStreet
Tomàs Sallés was born in Barcelona in 1972, he is a certified technical analyst after having completing specialized courses in Spain and Switzerland. He expanded his technical training following the guidance of great experts on the financial markets.


