Top 3 Price Prediction, Bitcoin, Ethereum, Ripple: Who will catch the falling knife? pt.2
- Bitcoin price coils in triangular fashion as the bears have rejected auctions at the $20,000 price level.
- Ethereum price witnesses historically low gas fees prompting an underlying bullish sentiment yet to be seen in the technicals.
- Ripple price is denied mid-$0.35 entrance and prepares for a sharp move.

The cryptocurrency market is at a make-or-break point. Key price levels have been defined below to keep track of future directional bias.
Bitcoin price has investors' fingers crossed
Bitcoin price at the time of writing trades at $19,440 as the bears are suppressing the peer-to-peer digital currency on the 4-hour chart. The persistent back-and-forth price action witnessed to start the month of July has developed a coiling-like pattern that could steer long-term investors away from jumping in until a definitive breach occurs.
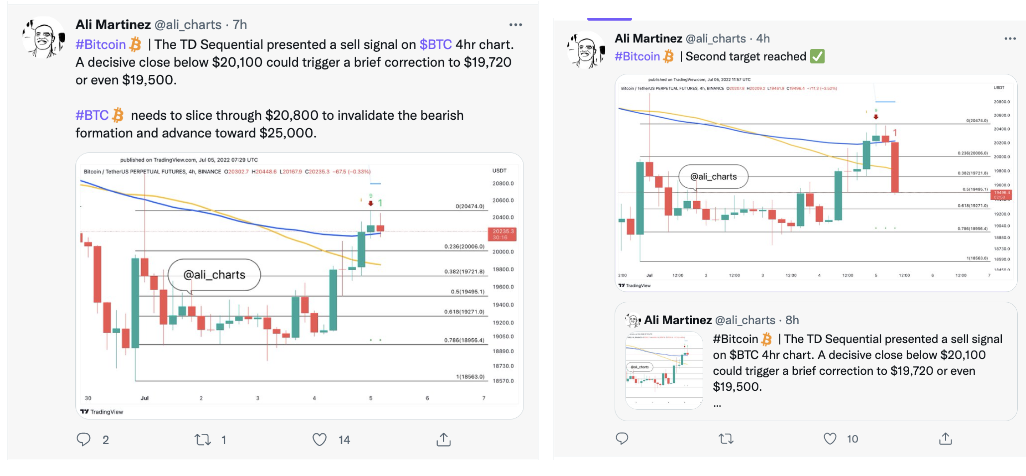
Still, the market leaves opportunities for those willing to engage. Crypto Analyst @Ali_Charts forecasted a potential sell signal during the Asian trading session, noting that the Bitcoin price would “trigger a brief correction to $19,720 or even $19,500” if the BTC price failed to hurdle the 20,800 barrier. On July 5, 2022, Ali’s 1-1 trade setup was fully validated as the bears flexed a large bearish engulfing candle on the 12-hour chart.
Bitcoin price is still within bounds of the coiling-like pattern and should be observed closely to participate in the next directional move. A breach below $18,635 could be the straw that breaks the camel’s back, as bears will likely hold onto shorts until targets at $15,500 and potentially $14,700 are reached.
On the contrary, a decisive close above $20,800 could resolve the consolidative pattern with a bullish rally targeting $23,000 and potentially $24,700, resulting in a 20% increase from the current Bitcoin price.
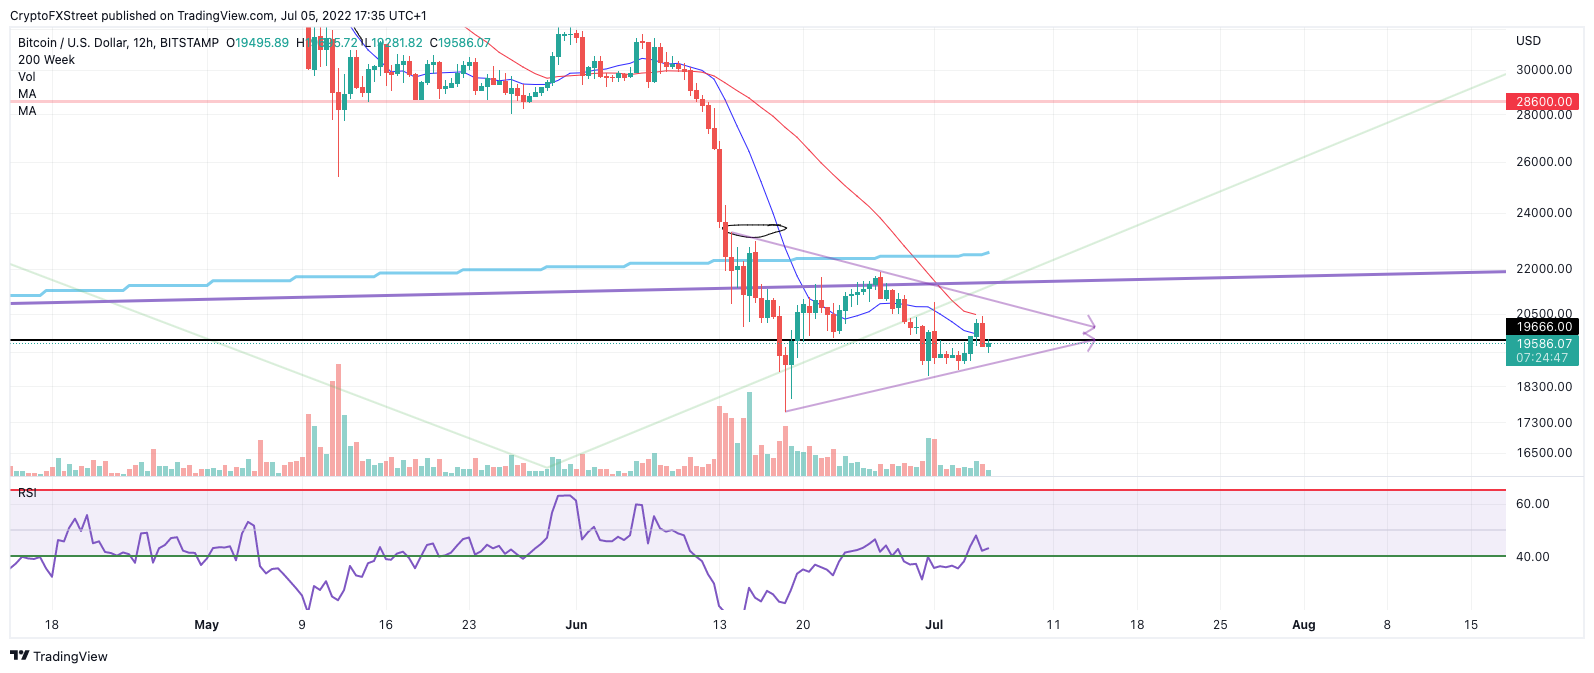
BTC/USDT 12-Hour Chart
Ethereum price nears cutting the board
Ethereum price falls short of the anticipated 200-week moving average target at $1,200. On July 5, the Ethereum price hovers at $1,085 as the bears take full advantage of the front-run target, attempting to breach liquidity below the $1,000 level. The sell-off comes at an interesting time as the decentralized smart contract token has witnessed its lowest gas fees in the past two years. If the contrarian market conditions persist, the $980 price level will be a likely target to expect bullish combat.
Trading a tight consolidative range is never an easy task. Breakout traders may be sidelined until a breach above $1,200 occurs to jump into the market. If this event occurs, the bulls could aim for $1,500 and potentially $1,650 in the short term.
For those willing to catch a knife, an opportunity could present itself at the $935-950 level in the coming days. Keep in mind that invalidation of the early bullish outlook is a breach below $810. The $810 invalidation level provides wiggle room under the June 18 swing low at $879.80 in case of a smart money liquidity grab. If the bulls can breach $810, expect further sell-offs into $775 and $730, resulting in up to a 30% decrease from the current Ethereum price.
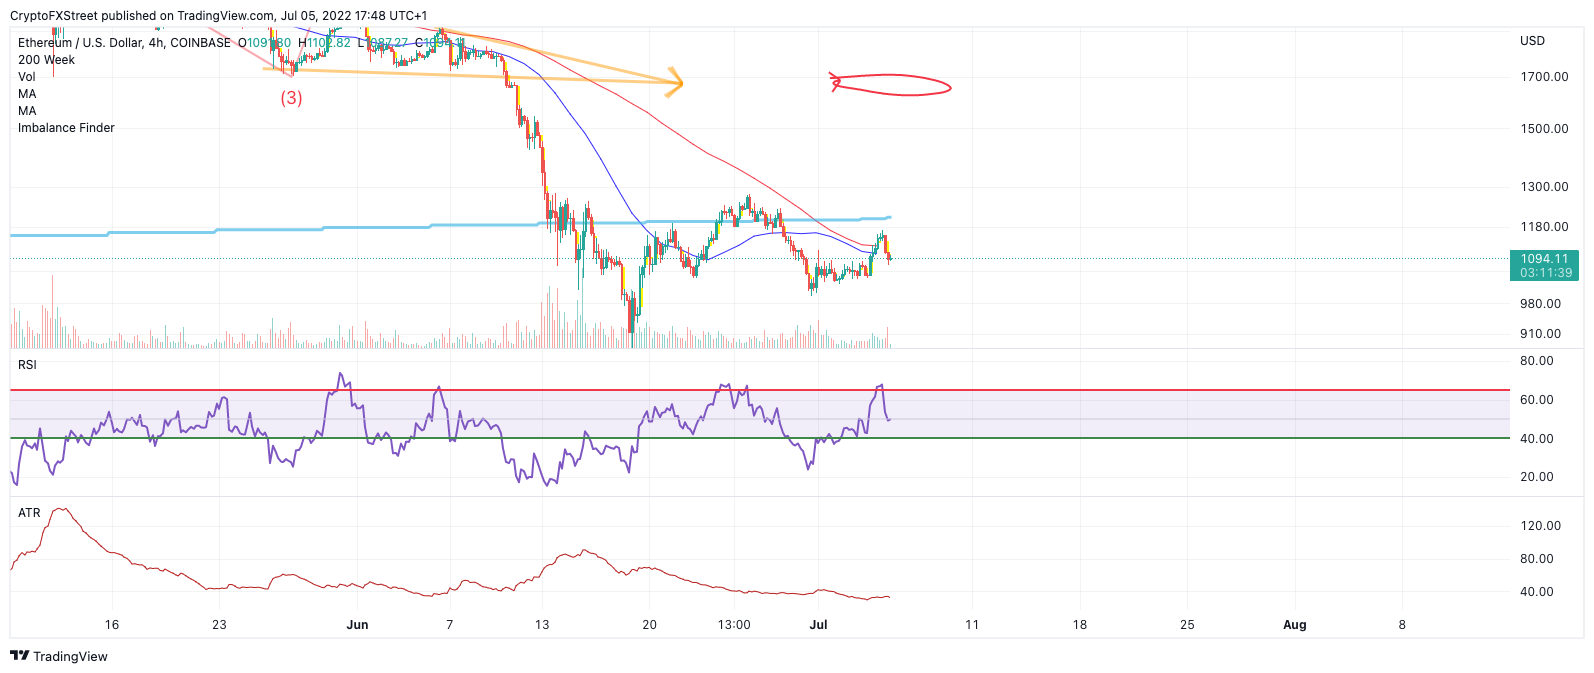
ETH/USDT 4-Hour Chart
Ripple price is blunted and bloody
Ripple price currently trades at $0.31 as the bears have rejected auctions in the mid- $0.35 region. Ripple now faces serious trouble as the 8- and 21-day moving averages hover just above the current market value, having produced a death cross during Asia’s overnight session.
The resolve of the two colliding moving averages could awaken sleeping breakout traders and become the catalyst to break June’s monthly low at $0.29. If the latter is breached, expect a further sell-off into $0.25 and potentially $0.21 for up to a 30% decline. However, jumping into the market as an early bear is ill-advised as the Relative Strength Index maintains the current XRP price at $0.31 within supportive bullish territory on the 4-hour chart.
Invalidation of the bearish thesis is a definitive close above $0.34. Said price action could induce a buyers' frenzy targeting $0.39 in the short term for a 24% increase from the current XRP price.
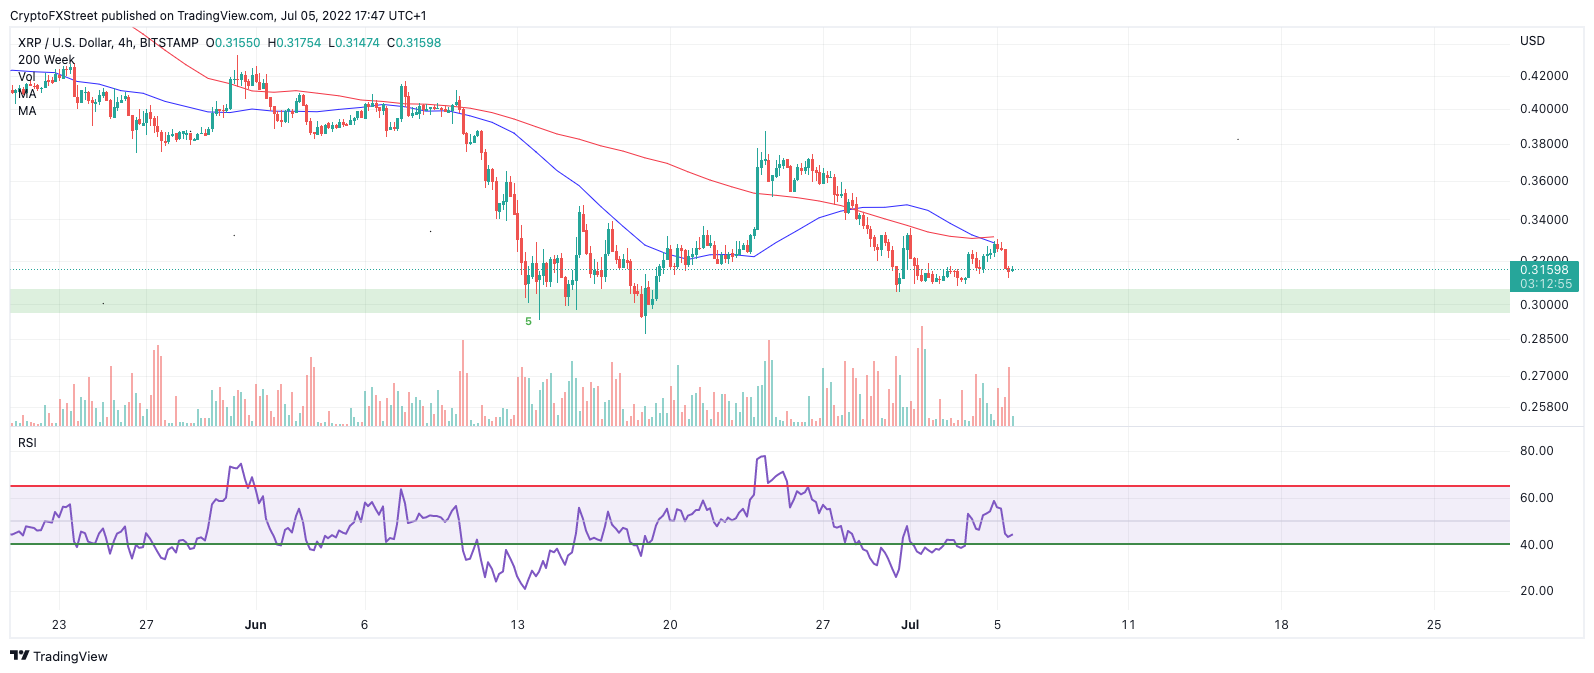
XRP/USDT 4-Hour Chart
Author

Tony M.
FXStreet Contributor
Tony Montpeirous began investing in cryptocurrencies in 2017. His trading style incorporates Elliot Wave, Auction Market Theory, Fibonacci and price action as the cornerstone of his technical analysis.




