Top 3 Price Prediction Bitcoin, Ethereum, Ripple: Spurts of bullish momentum fight resurging bears
- Bitcoin price displays a throwback that could retest $24,499 after a breakout from the rising wedge.
- Ethereum price consolidates in a small range, extending from $1,852 to $2,022, still lacking any discernible bullish bias.
- Ripple price breaks above the $0.381 level, but further confirmation is necessary.

Bitcoin price sees a bullish uptick in an attempt to clear up any inefficiencies formed during the recent sell-off. Despite its uptrend, Ethereum price remains broadly range bound in the short-term, while XRP price shows strength, to be confirmed at the daily close.
Bitcoin price throwback in action
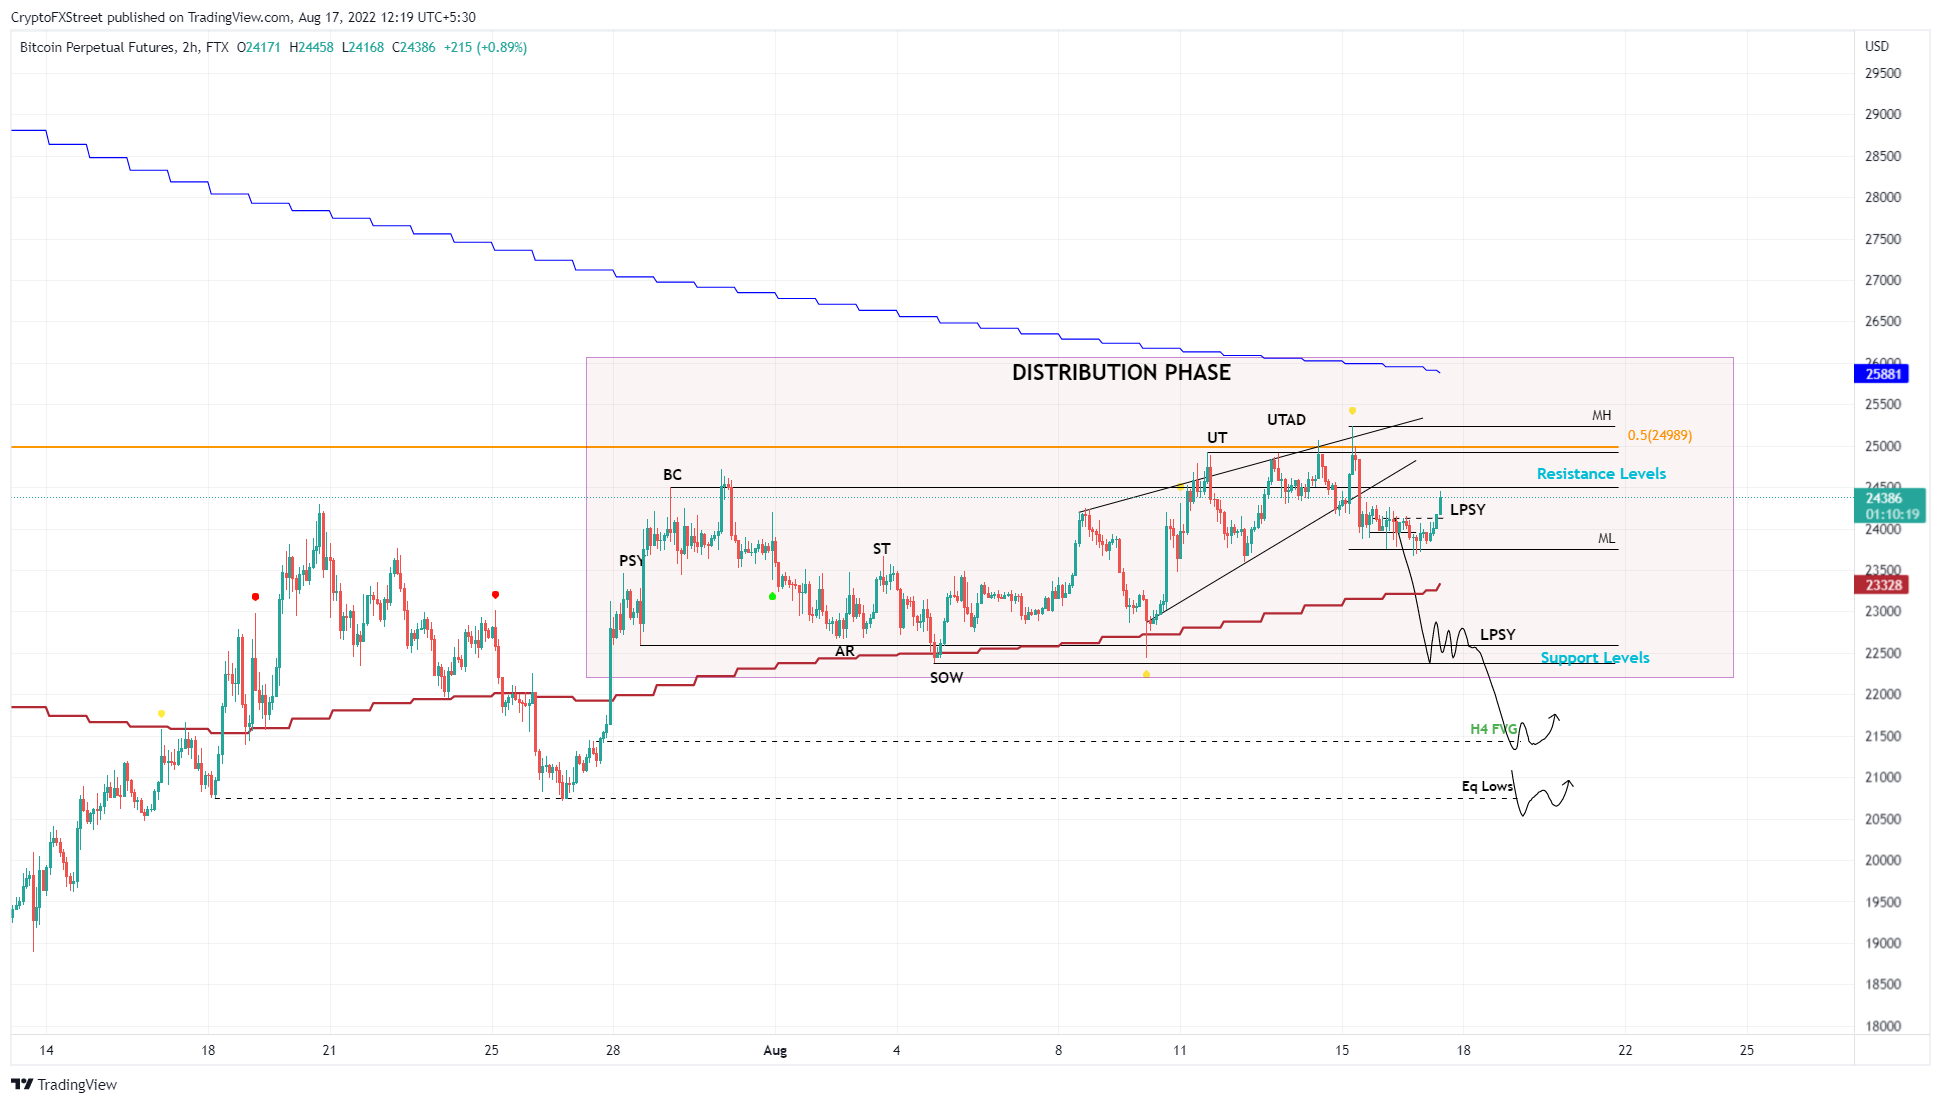
Bitcoin price is currently displaying a throwback higher after breaking out and to the downside of a rising wedge. While the current move could retest $24,989, investors should also pay close attention to $24,499 as another possible temporary upside target. In some cases, BTC could even start to change trend and climb higher and sweep Monday’s highs at $25,232.
Rejection at either of the two $24k levels, however, will indicate a resumption of the bear trend. Basically, bears will retain as long as this move gets undone quickly.
Downside targets include the 30-day Exponential Moving average (EMA) at $23,330. A breakdown of which will knock BTC down to intermediate support levels at $22,598 and $22,561.
While a steeper correction to $21,440 or $20,750 is likely, investors should not hold their breath expecting the down move to be swift.
BTC/USD 4-hour chart
While things are looking choppy for Bitcoin price, investors should note that a daily candlestick close above $24,989 that flips it into a support floor will invalidate the bearish thesis. In such a case, BTC could reach the $25,968 hurdle, where the 100-day EMA is located.
Ethereum price remains weak
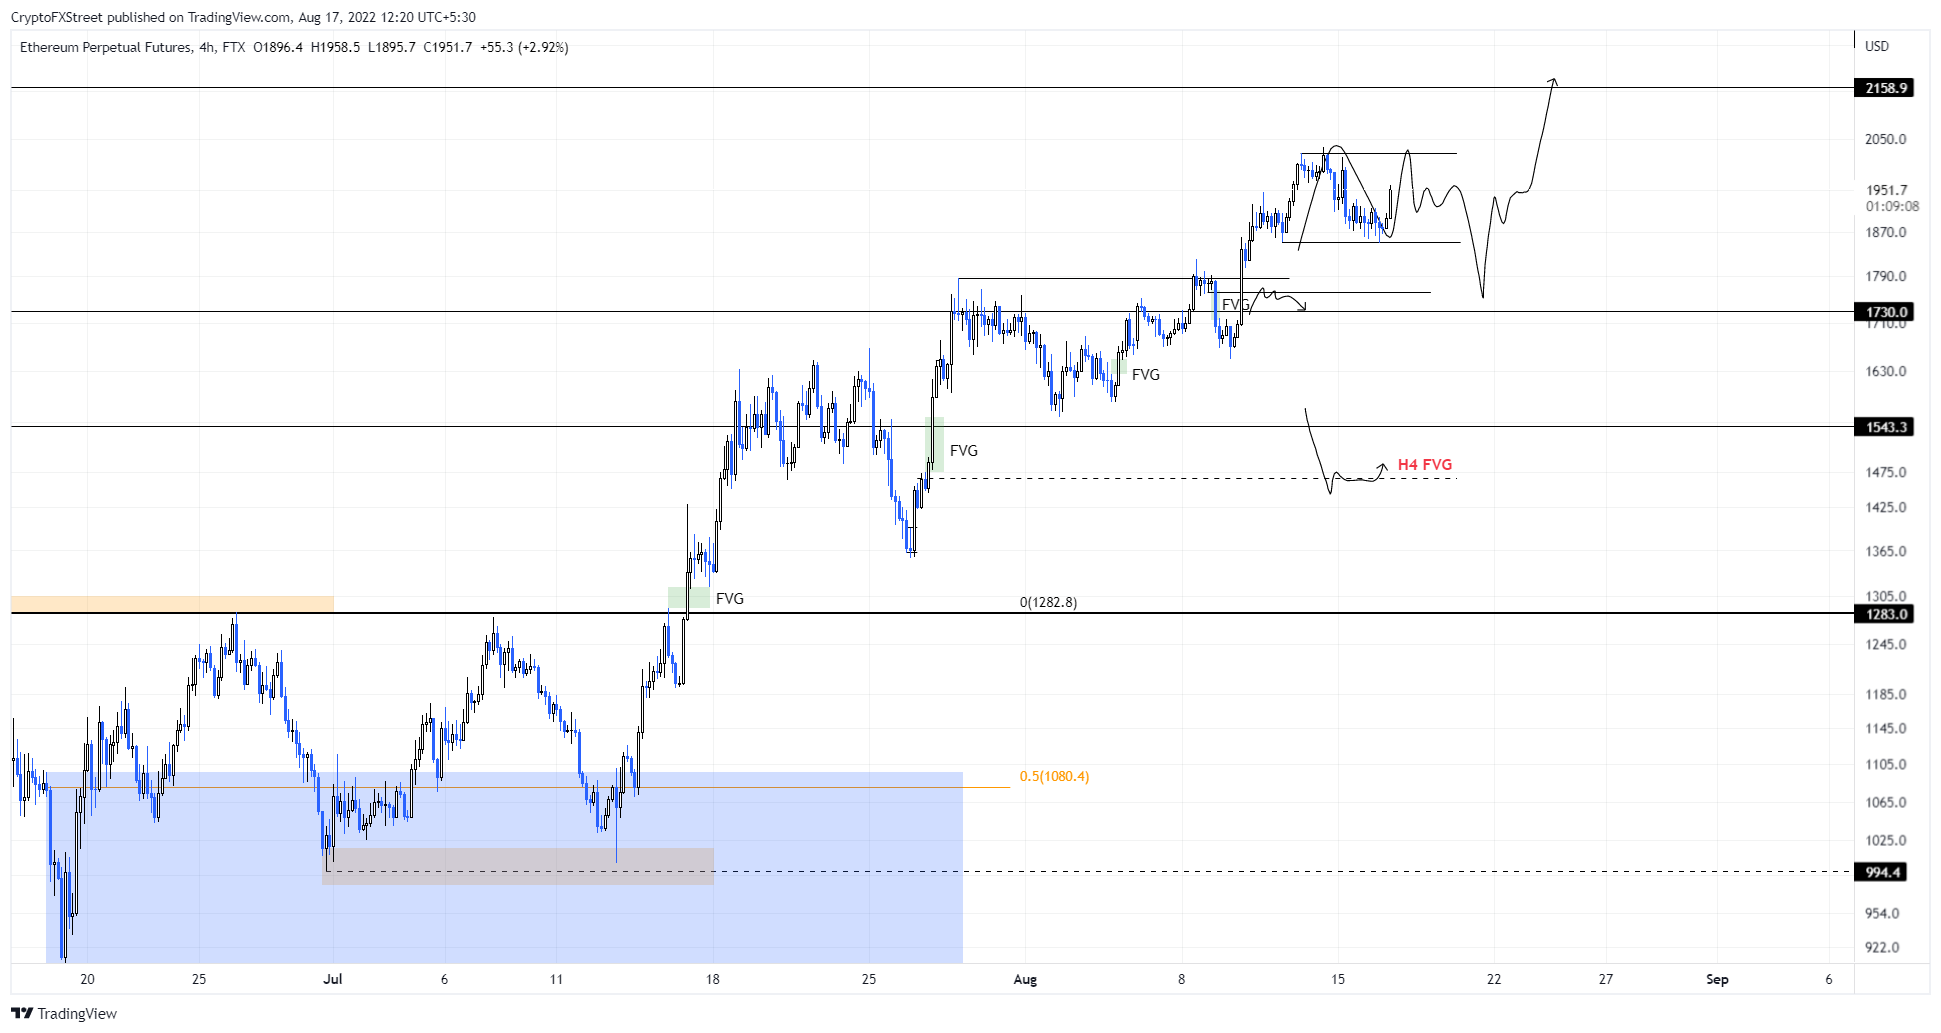
Ethereum price is consolidating inside the $1,852 to $2,022 range and is showing weakness after the recent spike in buying pressure. A breakdown of this range will signify a downtrend has started. In such a case, investors can expect ETH to retest the $1,730 support level next.
A persistence of bearish momentum could see Ethereum price head to $1,543 and the price inefficiency at $1,446, aka fair value gap (FVG).
ETH/USD 4-hour chart
On the other hand, if Ethereum price recovers inside the range low at $1,852 and flips the range high at $2,022 into a support floor, it will indicate a continuation of the bullish momentum. In such a case, investors can hold off the bearish thesis until a retest of the next hurdle at $2,158 and $2,266.
Ripple price continues to do the same thing
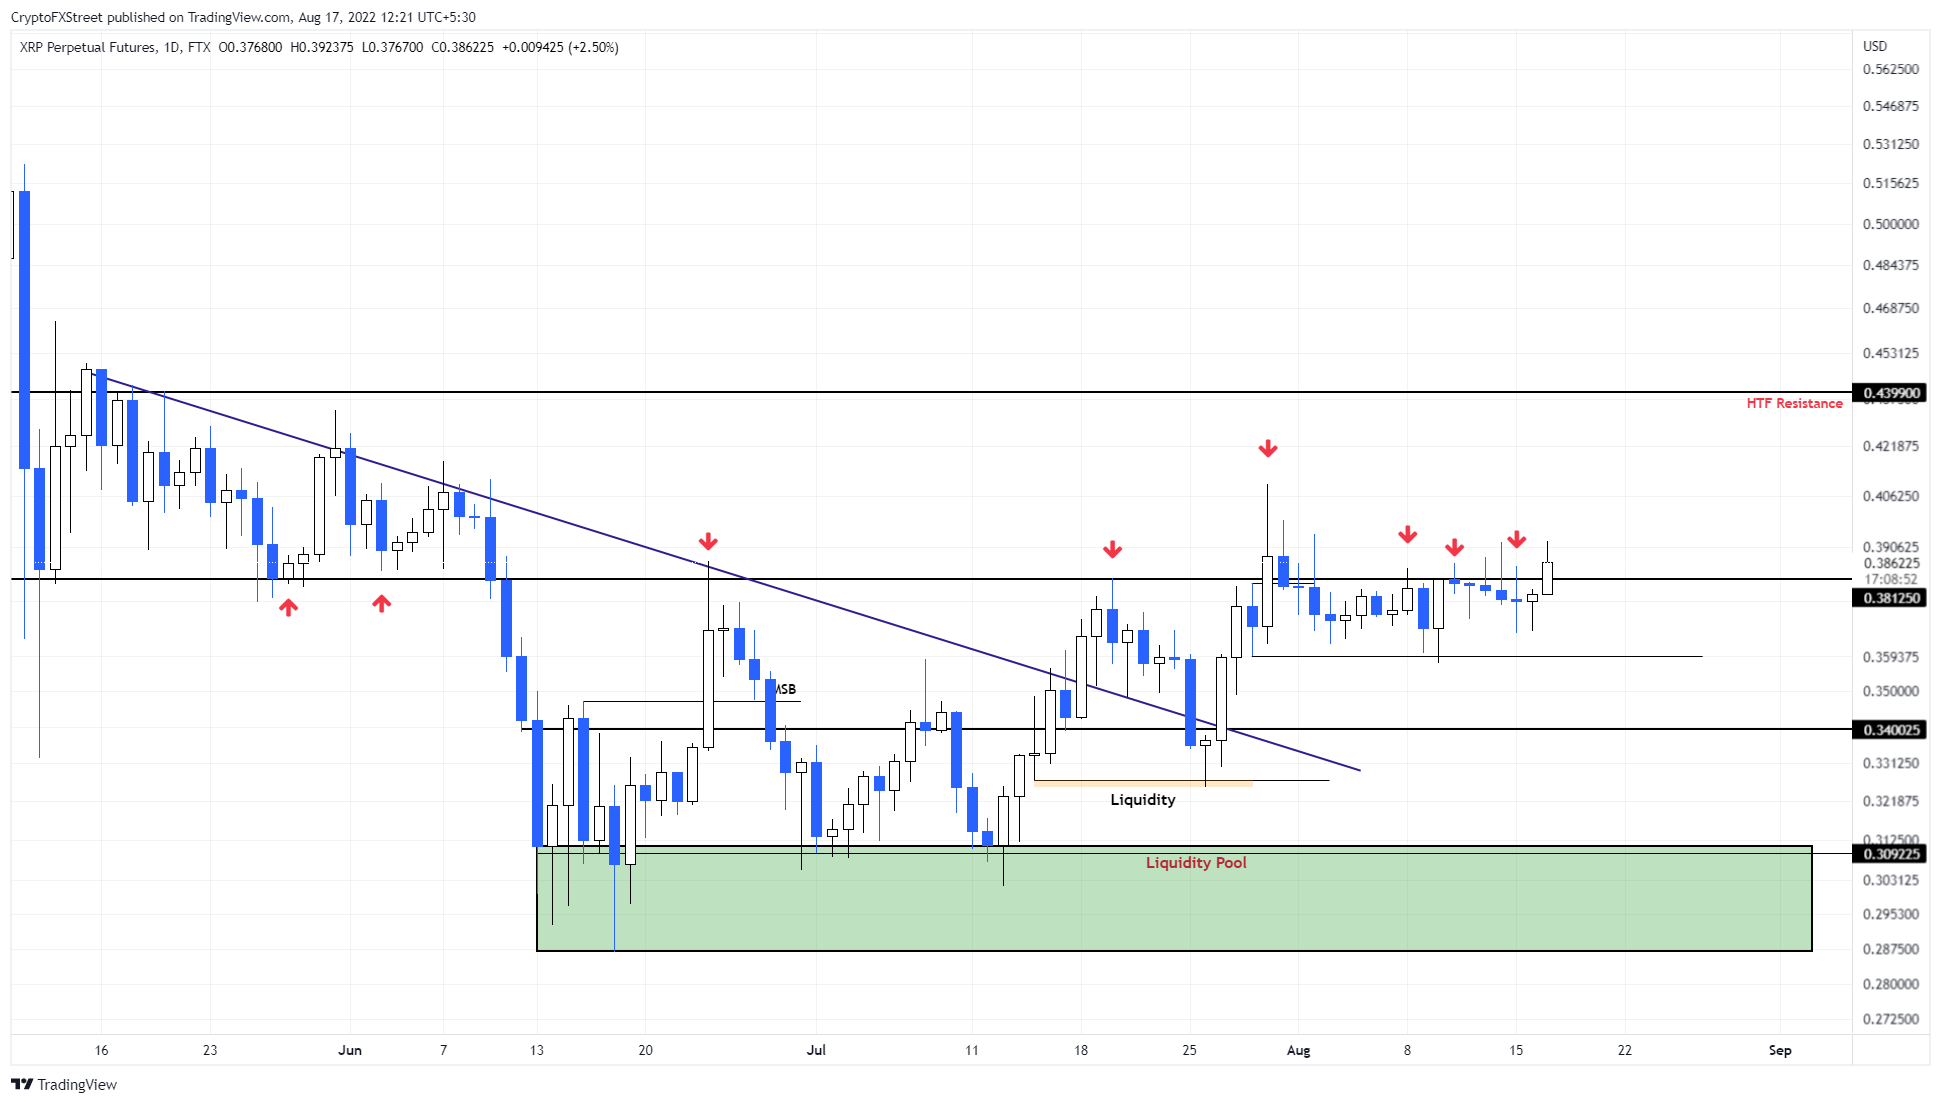
Ripple price sees exhaustion of the bullish momentum that briefly pushed it above the $0.381 hurdle. The undoing of these gains is likely to push the XRP price down to the $0.359 support level.
A breakdown of this level will confirm the start of a downtrend. In such a case, investors can expect Ripple price to make its way to the $0.340 support level. If holders continue to book profits, a sweep of the double bottom formed at $0.326 is likely.
XRP/USD 1-day chart
As long as XRP price remains between the $0.381 and $0.359 barriers, there is no point in trading the remittance token’s range bound moves.
A breakout or breakdown of one of these levels, however, will confirm the directional short-term outlook for Ripple price.
Author

Akash Girimath
FXStreet
Akash Girimath is a Mechanical Engineer interested in the chaos of the financial markets. Trying to make sense of this convoluted yet fascinating space, he switched his engineering job to become a crypto reporter and analyst.



