Top 3 Price Prediction Bitcoin, Ethereum, Ripple: Powell says private cryptos may not be necessary, while BTC nears a volatility surge
- Bitcoin price continues to tighten, compressing the Bollinger Band Width (BBW) to the lowest reading since October 15, 2020.
- Ethereum price briefly loses grip on the critical ascending trend line originating in March 2020, but beware of a bear trap.
- XRP loses pivotal $0.650 support, but Average True Range (ATR) has compressed to the early April levels, hinting at incoming volatility.

Bitcoin price has returned just over 9% since the May 19 crash low of $30,000, while Ethereum price is flat versus the May 19 low and XRP price is nearing a bearish Death Cross pattern on the daily charts.
Powell updates Federal Reserve outlook on cryptocurrencies
Today, Federal Reserve Chair Jerome Powell, in his presentation to the House Committee on Finance, responded to questions related to cryptocurrencies by stating that the Federal Reserve aims to publish a report on digital currencies in early September. He acknowledged that “risks to a central bank digital currency are real and that an appropriate regulatory framework is urgently needed for stablecoins.”
However, Powell was firm in his view that the US Dollar is not at risk of losing its status as the reserve currency for the world and opined that there might be no need for private cryptocurrencies if the Federal Research launch a fully digital dollar. Commonly referred to as a central bank digital currency (CBDC).
No doubt, the cryptocurrency market will be eagerly awaiting the September report on digital currencies. For now, the Federal Reserve seems content to recognize cryptocurrencies but diminish the threat they pose to the position of the US Dollar in the global monetary structure.
Bitcoin price may be readying for better outcomes this summer
To review, Bitcoin price has been testing the support provided by the 12-month SMA at $32,091 since the beginning of June and with success. The magnet effect of the long-term moving average has contained rallies from around the psychologically important $30,000 price level to $40,000. As a result, BTC has been slowly tightening, pushing the 20-day BBW to the lowest reading since October 2020.
The low 20-day BBW projects an uptick in volatility moving forward, but the BTC direction is unknown. A similar level in October 2020 marked the beginning of the massive advance into April 2021, while in August 2020, the low reading was followed by a drop in early September.
The July 8 breakdown from a rising wedge pattern tilts the probabilities in favor of a volatility spike to the downside. The pattern projects a measured move of 27% and a Bitcoin price low of $25,000. A drop to the measured price target would confirm the original breakdown from a larger head-and-shoulders pattern, first triggered on June 22 and dispose of the 61.8% Fibonacci retracement level of the 2020-2021 rally at $27,175.
However, considering the stable support generated by the BTC 12-month SMA at $32,091 and reinforced by the 50-week simple moving average (SMA) at $31,896, Bitcoin price could diffuse the narrowing price action highlighted in the 20-day BBW with a burst in upside volatility. It could overcome the resistance provoked by the 50-day SMA at $35,373 and the Anchored VWAP from October 21 at $37,672. If accomplished, BTC would be free to test the complicated resistance around the 38.2% retracement level of the April-June correction at $42,589, representing a 30% rally from the current price.
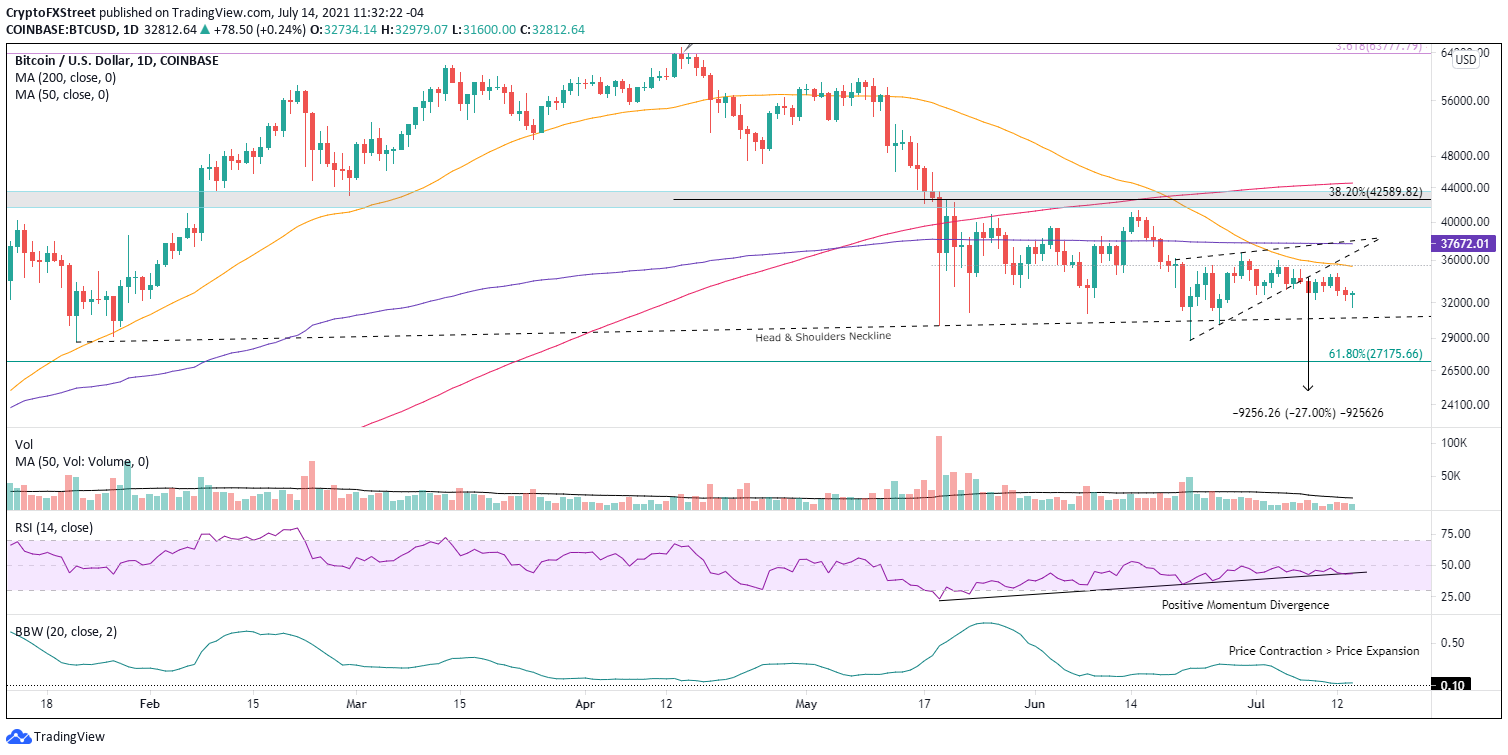
BTC/USD daily chart
Price contraction always leads to price expansion or volatility. Bitcoin price is nearing a moment of increased volatility as the pioneer cryptocurrency wrestles with the converging technical obstacles that are compressing price action. For sure, BTC will disrupt the early doldrums of summer for at least a short period.
Here, FXStreet's analysts evaluate where BTC could be heading next as it seems bound for a rebound before capitulation.
Ethereum price long-term trend at risk
To review, Ethereum price dropped below the lower trend line of a rising wedge pattern at $2,330 on July 8 before establishing some support along the 200-day SMA that meshed with the instructive February high of $2,041 and underpinned by the 2020 ascending trend line at $1,965.
Despite the riches of support, Ethereum price fell below the support levels yesterday and logged a daily close below the 2020 ascending trend line for the first time. It shifts the ETH risk to the downside and turning the once credible support of the February high and 200-day SMA into a role of resistance.
The potential downside includes the 61.8% Fibonacci retracement of the 2020-2021 advance at $1,730, the June 22 low of $1,700 and the 2018 high of $1,419. However, ETH investors need to be alert to the potential of an emerging bear trap, where Ethereum price temporarily slides below the ascending trend line, creates some fear before catapulting the smart contracts giant notably higher in a sling-shot formation.
ETH upside potential includes the 50-day SMA at $2,311 and then the upper trend line of a larger descending triangle being formed at $2,540, presenting a 27% rally from the current Ethereum price.
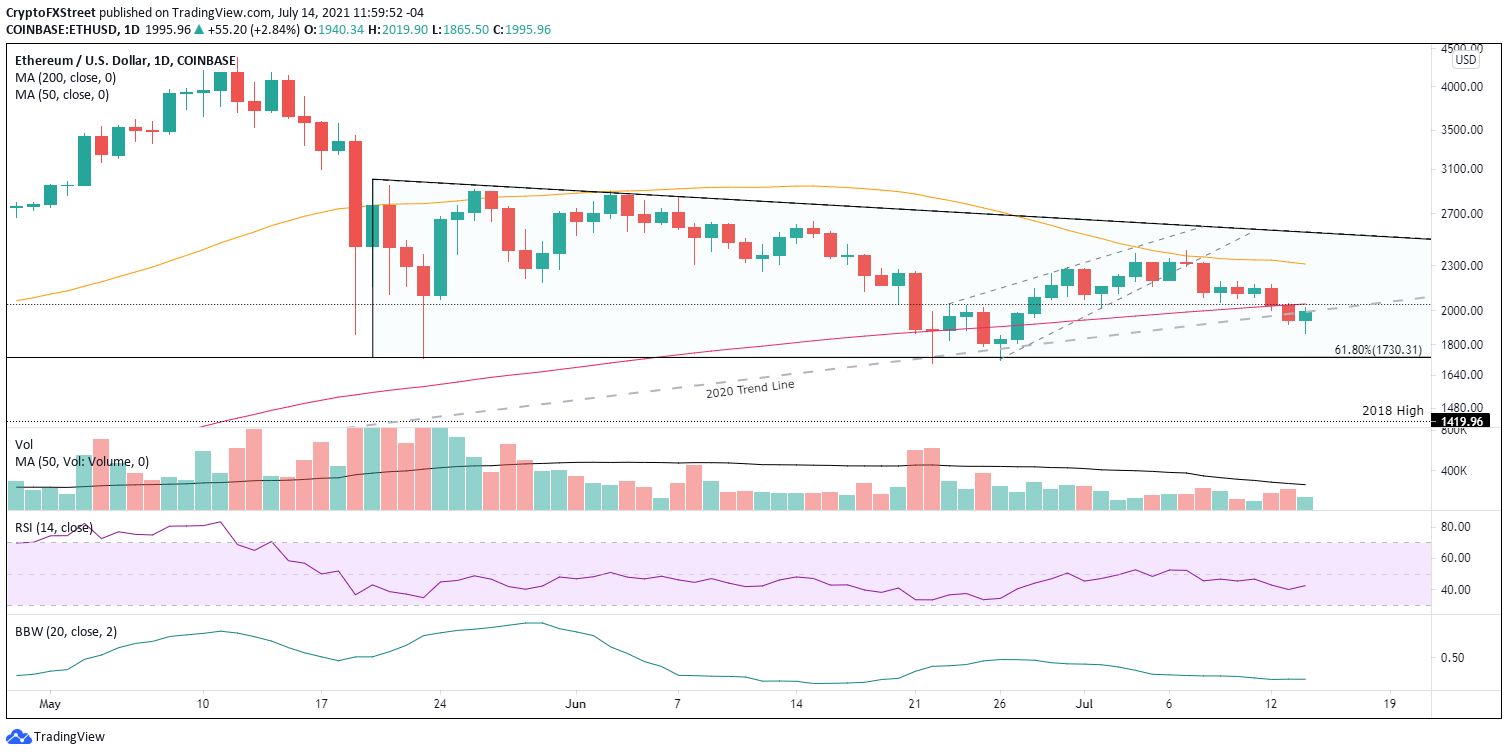
ETH/USD daily chart
Ethereum price is at an inflection point for the two-month corrective process. The dominant trend is at risk and fortified by a downward bias in the broader cryptocurrency complex. Nevertheless, the potential for a bear trap is a real scenario for ETH and should influence any investment decision-making.
Here, FXStreet's analysts evaluate where ETH could be heading next as it seems bound for an upswing.
XRP price situation remains fluid, with no clarity of trend intent
Since the breakdown from a rising wedge pattern on July 1, XRP price has been governed by the $0.650 price level, either acting as support or resistance. The $0.650 level corresponds to the May 23 low of $0.652 and a series of highs going back to early 2021 and December 2020.
The XRP price decline below $0.650 and resulting failures to rebound may be interpreted as Ripple extending the range of the listless consolidation that may include a test of the 78.6% Fibonacci retracement of the 2021 rally at $0.555.
A direct effect of the listless Ripple consolidation under the strategically important 200-day SMA at $0.744 and the neckline of a much larger inverse head-and-shoulders pattern at $0.770 is a contraction in the 14-day Average True Range (ATR) back to April levels that preceded the leap to $1.96. Hence, XRP price has experienced a level of price contraction that may signal a surge in volatility.
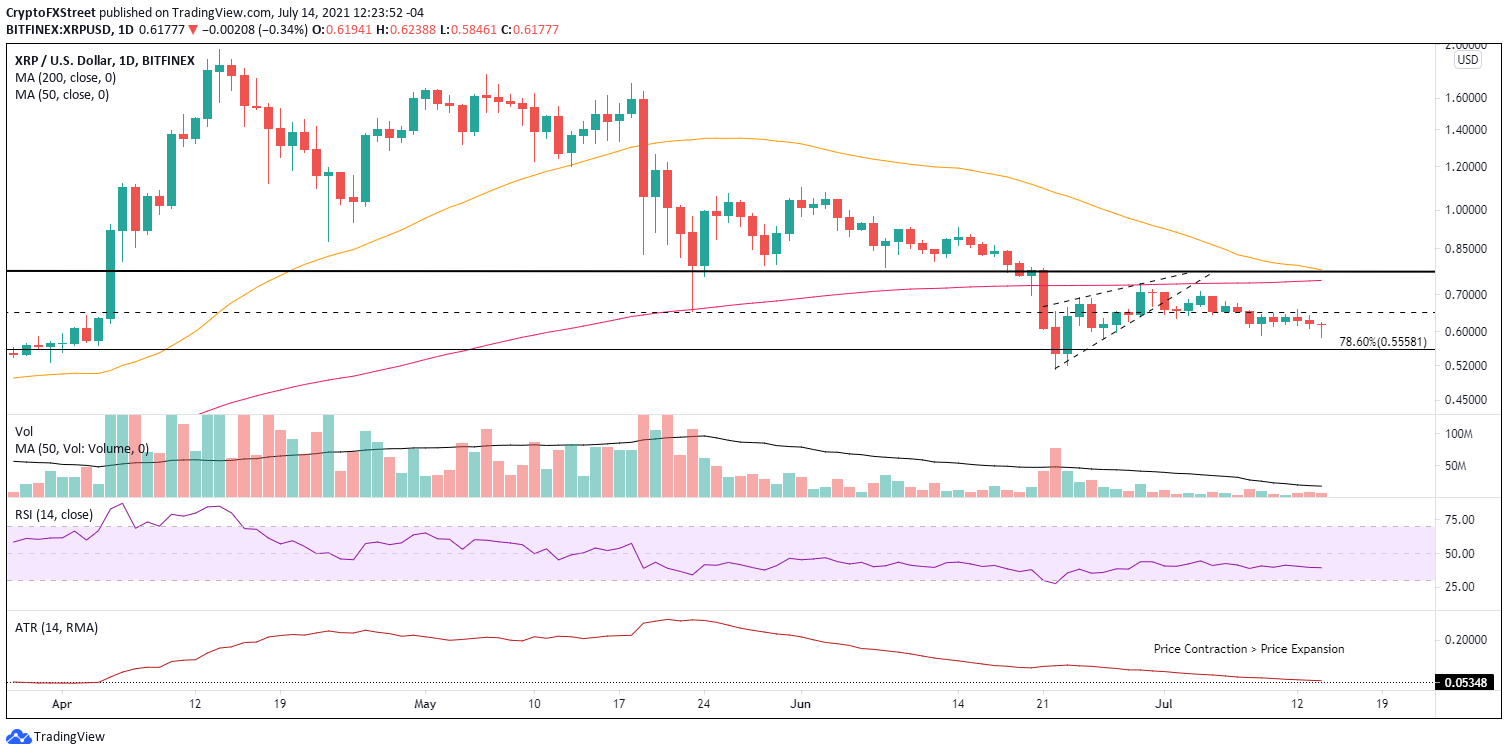
XRP/USD daily chart
Of course, the price contraction could extend for more weeks, but at the very least, it should prompt Ripple investors to acknowledge that risk moving forward. However, until renewed volatility, XRP price will be locked between $0.770 and $0.555, creating short-term trading opportunities.
Moreover, it should be highlighted that Ripple is nearing a bearish Death Cross pattern on the daily charts as the 50-day SMA inches closer to crossing below the 200-day SMA, thereby exerting more downward pressure on XRP price.
Here, FXStreet's analysts evaluate where Ripple could be heading next as it seems bound for an upswing.
Author

Sheldon McIntyre, CMT
Independent Analyst
Sheldon has 24 years of investment experience holding various positions in companies based in the United States and Chile. His core competencies include BRIC and G-10 equity markets, swing and position trading and technical analysis.


