Top 3 Price Prediction Bitcoin, Ethereum, Ripple: Big crypto needs to prove itself as downside risk multiplies
- Bitcoin price closed the week down -2.9% but remained well above the 50-week simple moving average (SMA).
- Ethereum price closed the week down -7.85% after making a brief rebound high.
- XRP price closed the week down -8.62% and below the tactically important $0.650 price level.

Bitcoin price is now down -4.44% for the month as it clings to the support formalized by the 12-month simple moving average (SMA). Ethereum price is down -7.75% for the month but barely holds the instructive 2020 ascending trend line. Meanwhile, XRP is down -10.24% this month while navigating a range framed by the inverse head-and-shoulders neckline and the 78.6% Fibonacci retracement level.
Bitcoin price support aligns, but can it hold
Beginning in June, Bitcoin price has been examining the credibility of the support offered by the 12-month SMA, currently at $32,135, with success. The 12-month SMA merges with the head-and-shoulders neckline that extends from January 2021 through May 2021, creating formidable support for intra-month weakness.
Solidifying the support around the 12-month SMA is the 50-week SMA at $31,906 as Bitcoin price has not closed below the tactically important moving average on a weekly basis since the corrective process began in April.
However, on July 8, Bitcoin price triggered a rising wedge pattern that had dominated BTC from the June 22 low of $28,800, augmenting the probability that risk is tilted to the downside moving forward.
The measured move of the rising wedge pattern is 27%, projecting an ultimate Bitcoin price low of $25,000 if the breakdown gains momentum. A decline of that magnitude would shutter the enduring BTC bullish forecast and, more importantly, transform the resilient support around $30,000 into an imposing resistance level for any rebound attempts from the measured move target of $25,000.
The Bitcoin price drop to the measured move target would confirm the breakdown from the larger head-and-shoulders pattern, first triggered on June 22, and displace the BTC support invoked by the 61.8% Fibonacci retracement level of the 2020-2021 rally at $27,175.
Thus, to avoid the bearish outcome, Bitcoin price needs to hold the 12-month SMA at $32,135, the 50-week SMA at $31,906 and the head-and-shoulders neckline at $30,640 on a weekly closing basis.
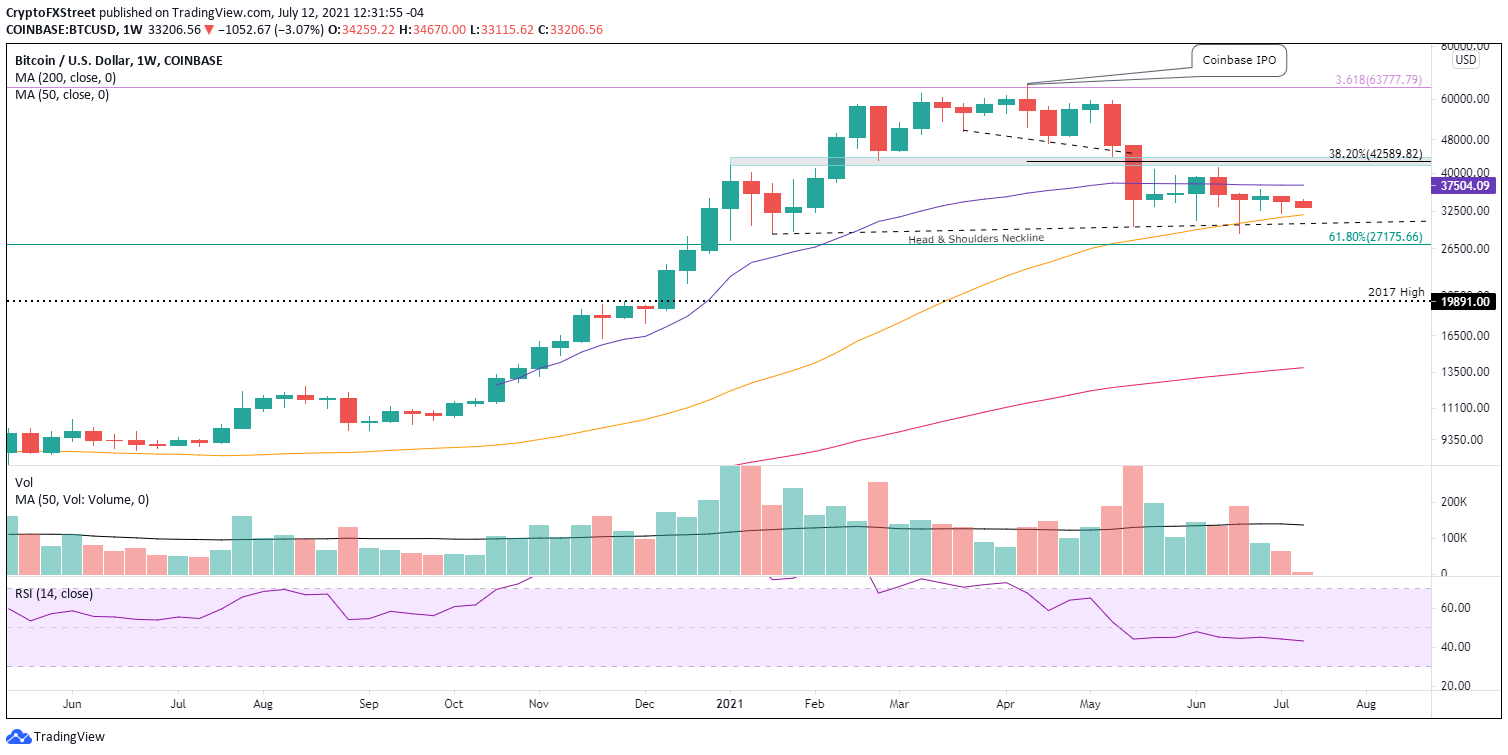
BTC/USD weekly chart
For now, until Bitcoin price can log a daily close above the wedge’s upper trend line and the Anchored VWAP from October 21 at $37,690, it is forecasted that BTC will continue to churn in the range manufactured since the May 19 low.
Here, FXStreet's analysts evaluate where BTC could be heading next as it seems bound for a rebound.
Ethereum price surfing critical support as broad crypto market roils
On July 8, Ethereum price collapsed below the lower trend line of a rising wedge pattern at $2,330, resolving the price structure that directed ETH since the doji candlestick low on June 22.
Since the breakdown, Ethereum price has surfed along the support granted by the February high at $2,041, and reinforced by the 200-day SMA at $2,030 and the ascending 2020 trend line now at $1,970.
A daily close below $1,970 would instantly tilt the ETH risk further to the downside and set in motion a drop to the 61.8% Fibonacci retracement of 2020-2021 advance at $1,730. If Ethereum price perfects a weekly close below $1,717, it would trigger the larger descending triangle pattern (highlighted in blue) and announce the potential for an additional 40% plunge based on the measured move of the descending triangle. More specifically, a 40% decline from the triangle breakout would equate to a price below $1,000.
An Ethereum price move of 40% would be challenged by the 12-month SMA at $1,420, the 2018 high at $1,419 and the 50-week SMA at $1,386. In fact, ETH should struggle to extend the sell-off beyond those levels, representing a 34% spike lower from the current price and a 19% decline from $1,717.
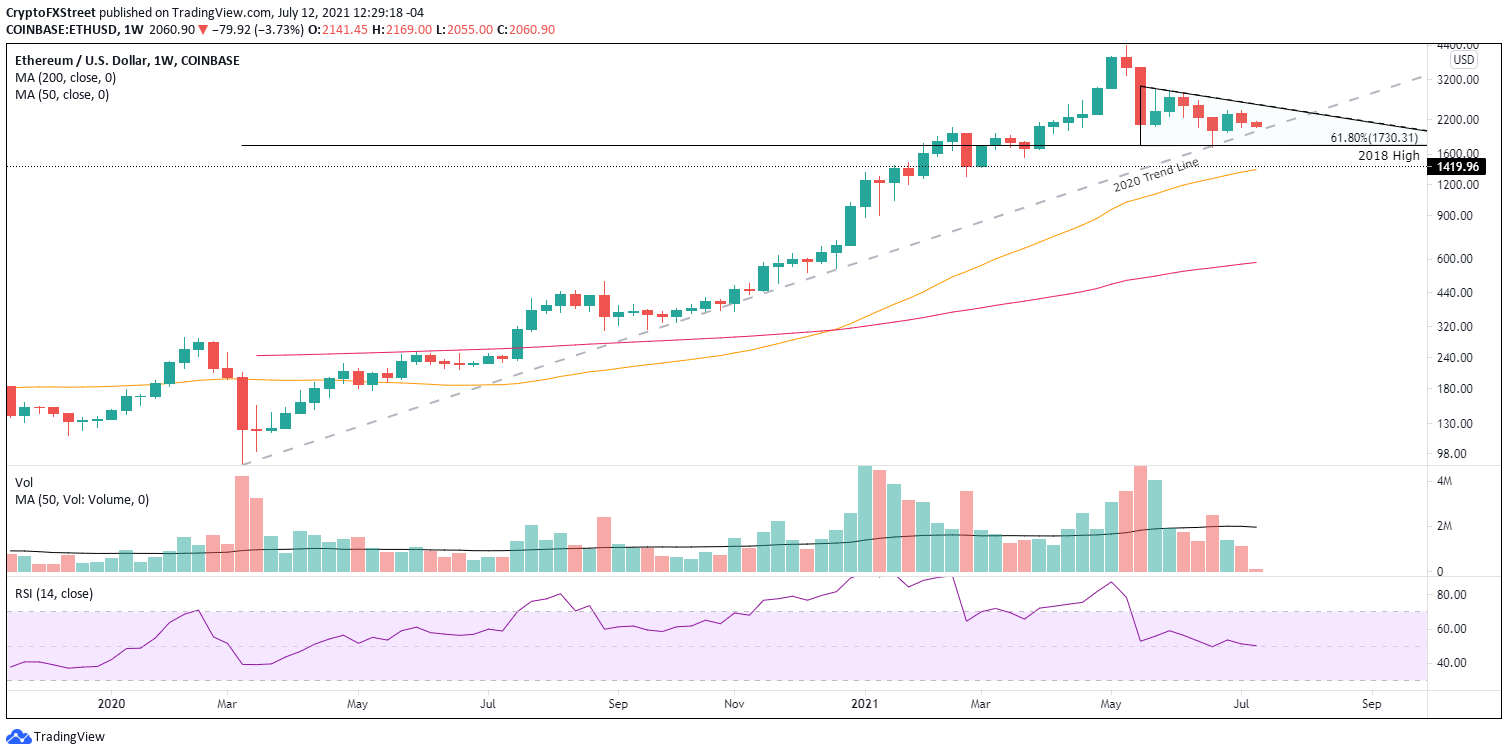
ETH/USD weekly chart
A daily close above the 50-day SMA at $2,341 would negate the short-term bearish outlook, but investors should not overlook the descending triangle’s upper trend line, now at $2,570. It will press down on price, limiting upside potential.
Here, FXStreet's analysts evaluate where ETH could be heading next as it seems bound for an upswing.
XRP price widens trading range, but still void of any actionable clues
Unlike Bitcoin and Ethereum, XRP price triggered a minor rising wedge pattern much sooner, on July 1, before shuffling into a consolidation along the critically important $0.650 price level, which corresponds with the May 23 low. The consolidative process broke on July 8. Ripple now cannot recover $0.65, thereby broadening the trading range, with support currently at the 50-week SMA at $0.566 or the 78.6% retracement level at $0.555.
The wedge’s measured move is around 30%, indicating that XRP price will push through the Fibonacci level and the June low at $0.512 before settling for support at $0.477. To reach the target price, Ripple needs to fall 24% from the current price level.
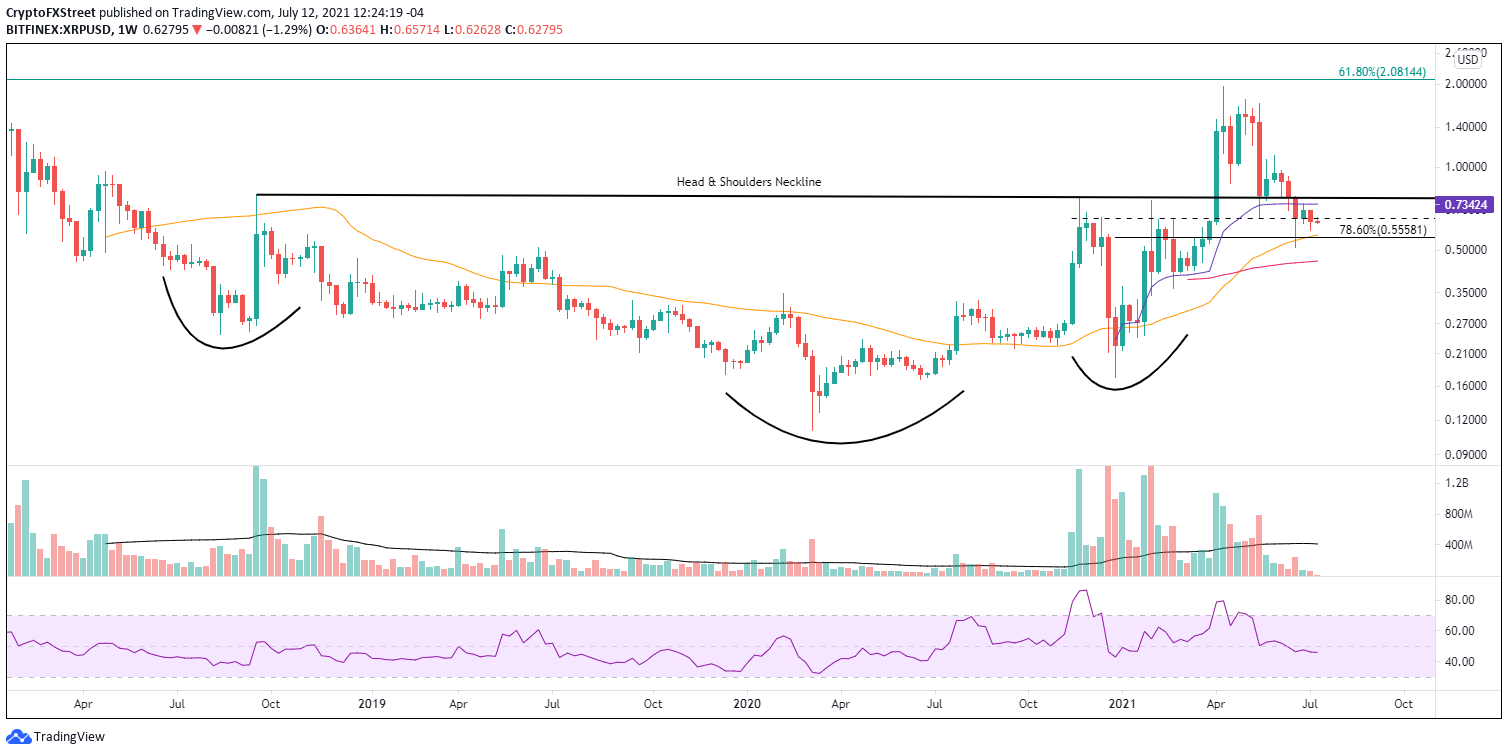
XRP/USD weekly chart
The best Ripple market operators can hope for at this point is for XRP price to oscillate around $0.650, and only a daily close above $0.770 would disrupt the bearish forecast being depicted in the Ripple charts of various timeframes.
In a cryptocurrency market characterized by wavering commitment and intensifying risk to the downside, market speculators should practice patience and let the digital tokens prove themselves before making definitive trading decisions. It is important to remember that investors have nothing to prove to the markets; instead, the markets must constantly prove themselves.
Here, FXStreet's analysts evaluate where Ripple could be heading next as it seems bound for an upswing.
Author

Sheldon McIntyre, CMT
Independent Analyst
Sheldon has 24 years of investment experience holding various positions in companies based in the United States and Chile. His core competencies include BRIC and G-10 equity markets, swing and position trading and technical analysis.


