Top 3 Price Prediction Bitcoin, Ethereum, Ripple: Possible start of a trend reversal for BTC
- Bitcoin price could drop to retest the $50,000 psychological level amid multiplying selling signals.
- Ethereum price is likely to retest the $2,874 support as crypto markets switch to weekend mode.
- Ripple price nosedive could see XRP retest $0.5000 psychological level as technicals flash bearish.

Bitcoin (BTC) price is leading markets into weekend mode where trading volumes are low and, therefore, the price becomes susceptible to volatility. With altcoins awaiting the BTC cue, Ethereum (ETH) and Ripple (XRP) prices appear to have taken a hint.
Also Read: Bitcoin Weekly Forecast: BTC likely to correct to $50,000 soon
Bitcoin, altcoins, stablecoins FAQs
What is Bitcoin?
Bitcoin is the largest cryptocurrency by market capitalization, a virtual currency designed to serve as money. This form of payment cannot be controlled by any one person, group, or entity, which eliminates the need for third-party participation during financial transactions.
What are altcoins?
Altcoins are any cryptocurrency apart from Bitcoin, but some also regard Ethereum as a non-altcoin because it is from these two cryptocurrencies that forking happens. If this is true, then Litecoin is the first altcoin, forked from the Bitcoin protocol and, therefore, an “improved” version of it.
What are stablecoins?
Stablecoins are cryptocurrencies designed to have a stable price, with their value backed by a reserve of the asset it represents. To achieve this, the value of any one stablecoin is pegged to a commodity or financial instrument, such as the US Dollar (USD), with its supply regulated by an algorithm or demand. The main goal of stablecoins is to provide an on/off-ramp for investors willing to trade and invest in cryptocurrencies. Stablecoins also allow investors to store value since cryptocurrencies, in general, are subject to volatility.
What is Bitcoin Dominance?
Bitcoin dominance is the ratio of Bitcoin's market capitalization to the total market capitalization of all cryptocurrencies combined. It provides a clear picture of Bitcoin’s interest among investors. A high BTC dominance typically happens before and during a bull run, in which investors resort to investing in relatively stable and high market capitalization cryptocurrency like Bitcoin. A drop in BTC dominance usually means that investors are moving their capital and/or profits to altcoins in a quest for higher returns, which usually triggers an explosion of altcoin rallies.
Bitcoin may have just chosen a directional bias
Bitcoin (BTC) price has recorded a steady series of lower highs and lower lows over the past four days, suggesting a clear directional bias. However, this is subject for confirmation considering that the $50,638 support level continues to hold. A break and close below it would confirm the continuation of the downtrend, likely sending BTC to $50,000.
The Relative Strength Index (RSI) has already executed a selling signal by crossing below the signal line (yellow band). This is reinforced by the histogram bars of the Awesome Oscillator (AO), which are steadily edging toward the midline.
In addition, based on the Mean Reversion Channel (MRC) indicator principle that holds that price tends to return to its average over time, the market is leaning to the downside.
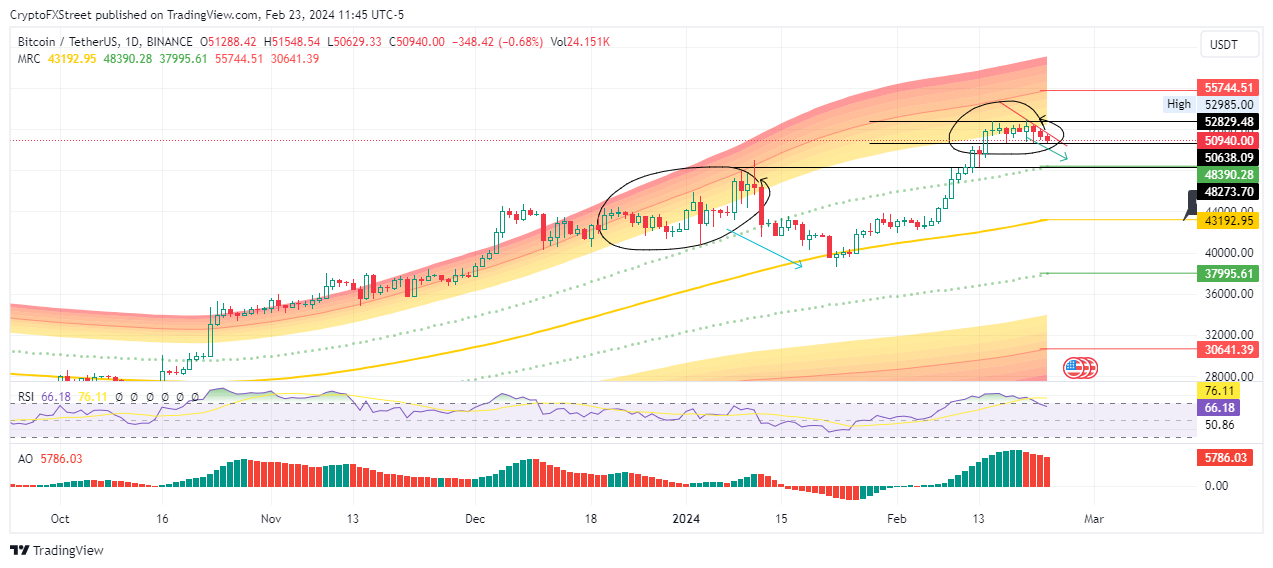
BTC/USDT 1-day chart
On the flip side, if buyer momentum increases, Bitcoin price could push north, escaping the market range above $52,829. In a highly bullish case, BTC could shatter the range high at $52,985 before confronting the $53,000 psychological level. A decisive candlestick close above this level would clear the path for an extended move north.
Also Read: Bitcoin price eyes $48,000 as European Central Bank tears down at BTC after spot ETF approval
Ethereum price repels $3,000
After a rejection from the $3,000 psychological level, Ethereum price is trading within the ascending parallel channel. However, it risks an extended fall following the execution of a selling signal on the RSI. With the weekend setting in, low trading volumes and the resultant volatility could see ETH retest the $2,874 support. In a dire case, the slump could send the Proof-of-Stake (PoS) token to the $2,770 support confluence between the horizontal line and the midline of the channel.
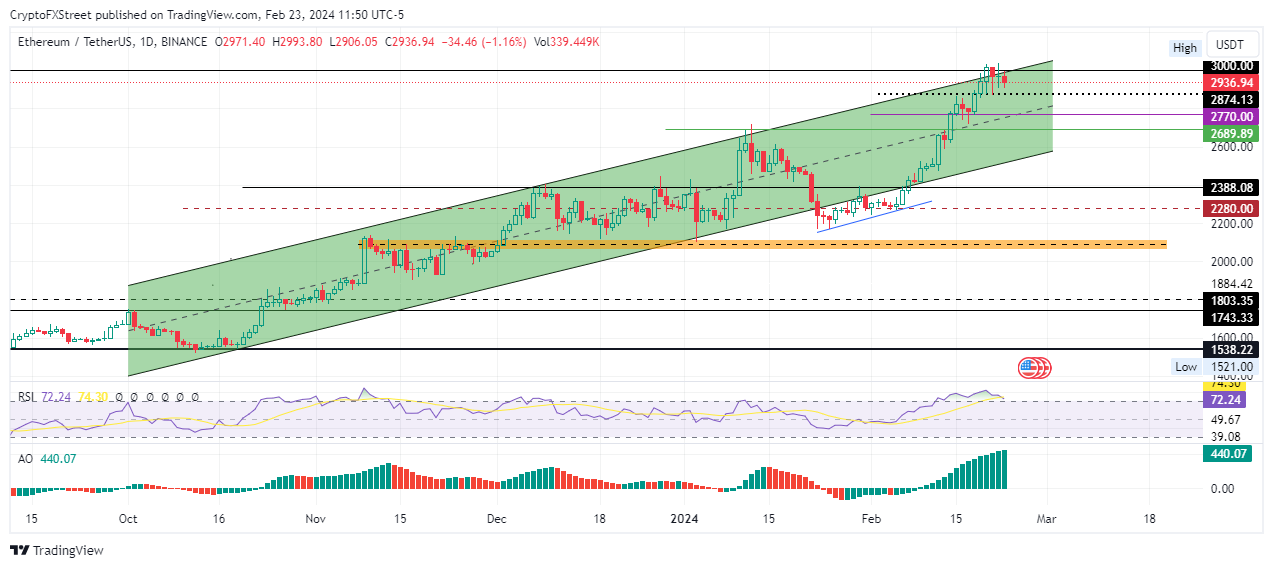
ETH/USDT 1-day chart
However, with the bulls still maintaining a presence in the BTC market, seen with the large volumes of green histogram bars of the AO, Ethereum price could overcome the $3,000 milestone, or in a highly bullish case, clear the range high of $3,036 to tag the $3,200 milestone.
Also Read: Ethereum price risks decline as increasing exchange supply raises chances of profit taking
Ripple price eyes $0.5000
Ripple (XRP) price has recorded a series of lower highs and lower lows over the past four days after a rejection from the upper boundary of the descending parallel channel. After crossing below the signal line, the RSI is below 50, showing the market is leaning to the downside. The red histogram bars of the AO accentuate this and add credence to the bearish thesis. In a dire case, Ripple price could roll over to the $0.4734 support floor.
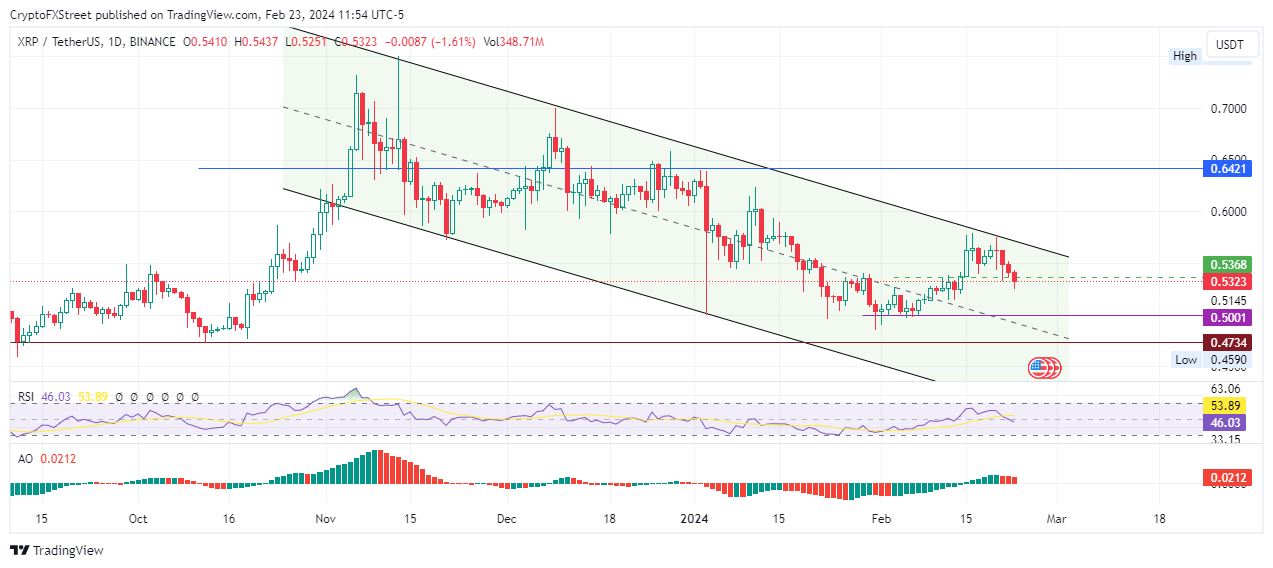
XRP/USDT 1-day chart
On the other hand, enhanced buyer momentum could send Ripple price above resistance stemming from the upper boundary of the channel, with a decisive candlestick close above it setting the pace for an extension to $0.6000. Such a move would constitute a 12% climb above current levels.
Also Read: XRP price plunges as Kraken cites SEC v. Ripple lawsuit in its legal battle against the regulator
Author

Lockridge Okoth
FXStreet
Lockridge is a believer in the transformative power of crypto and the blockchain industry.


