- Consolidation in the Ether affects the market and triggers a positive consolidation phase in the medium term.
- BTC/USD does not consolidate the $10000 level and will have to wait for the next upside.
- XRP affected by new token sales announced by Ripple Ltd.
Overbought levels were starting to get high at the end of last week. It seemed necessary and healthy for the price to consolidate, and it is doing so.
On Saturday, Ethereum, the most overbought asset in the Top 3, showed some selling. On Monday, Bitcoin is also joining the consolidation.
The Altcoin segment has done well in this 2020, escaping from the bearish territory and opening a new technical space where dreaming again with the moon does not sound epic.
The upward movement is so intense that it has quickly reached the upward barrier of the new scenario, and now it's time to define where things will move in the coming months.
The technical analysis of the ETH/BTC pair will help us understand where we stand.
ETH/BTC Daily Chart
ETH/BTC was unable to break above 0.0223 on Friday although the 0.022 support level appears to be reliable.
The leading pair shows a very particular moving average structure, with a possible evolving gold cross that would push the Ethereum-Bitcoin price ratio into a new dimension.
The ETH/BTC pair is currently trading at a price level of 0.22. Above the current price, the first resistance level is at 0.0251, then the second at 0.027 and the third one at 0.028.
Below the current price, the first support level is at 0.022, then the second at 0.020 and the third one at 0.0195.
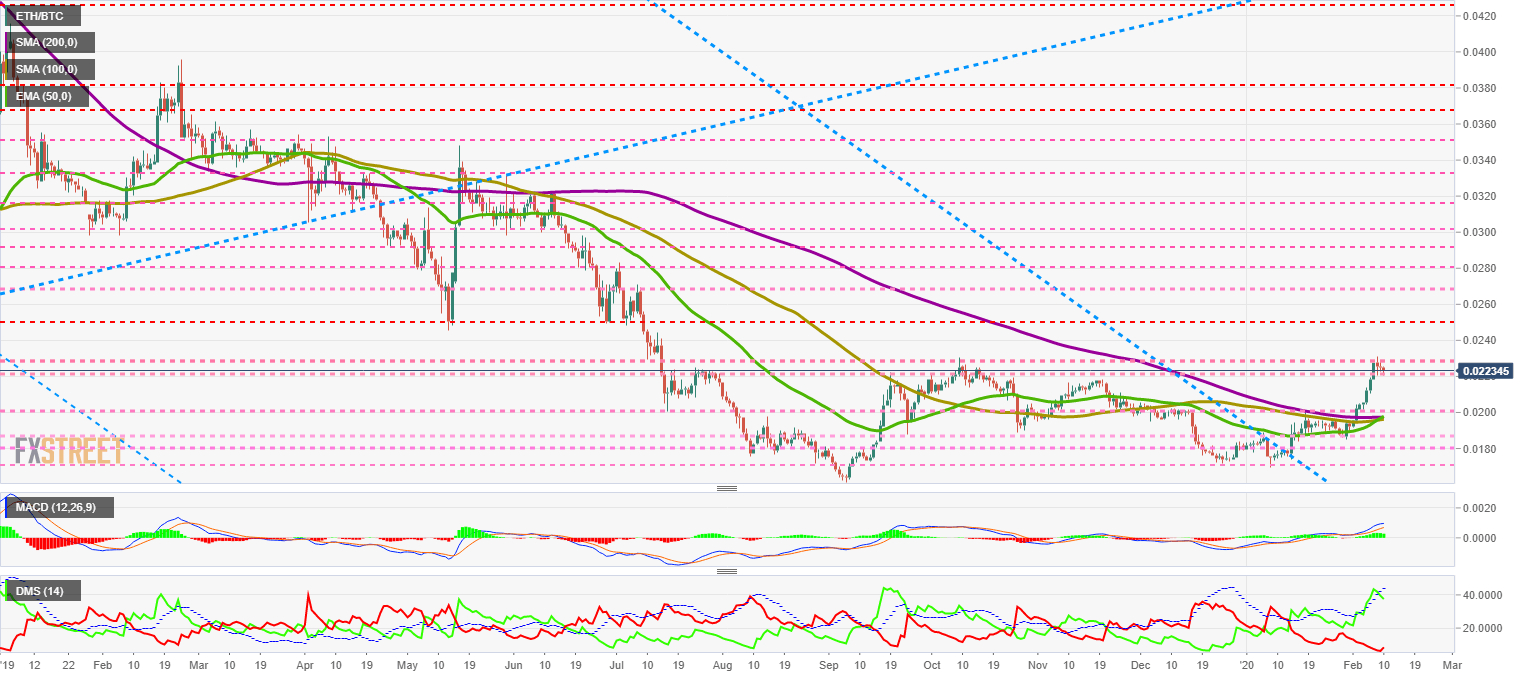
The MACD on the daily chart is losing its bullish profile, although the distance between the two averages remains unchanged. The profile cools off a bit from overbought levels, which is healthy for the price in the medium term.
The DMI on the daily chart shows the bulls losing the support of the ADX line, something that had already happened in the last few days. The bears do show some new behavior as they are now reacting to the bullish trend for the first time since mid-January.
BTC/USD Daily Chart
BTC/USD is currently trading at the price level of $9905 and is playing at the psychological level of $10000.
Above the current price, the first resistance level is at $10170, then the second at $10600 and the third one at $11200.
Below the current price, the first support level is at $9600, then the second at $9200 and the third one at $8800.
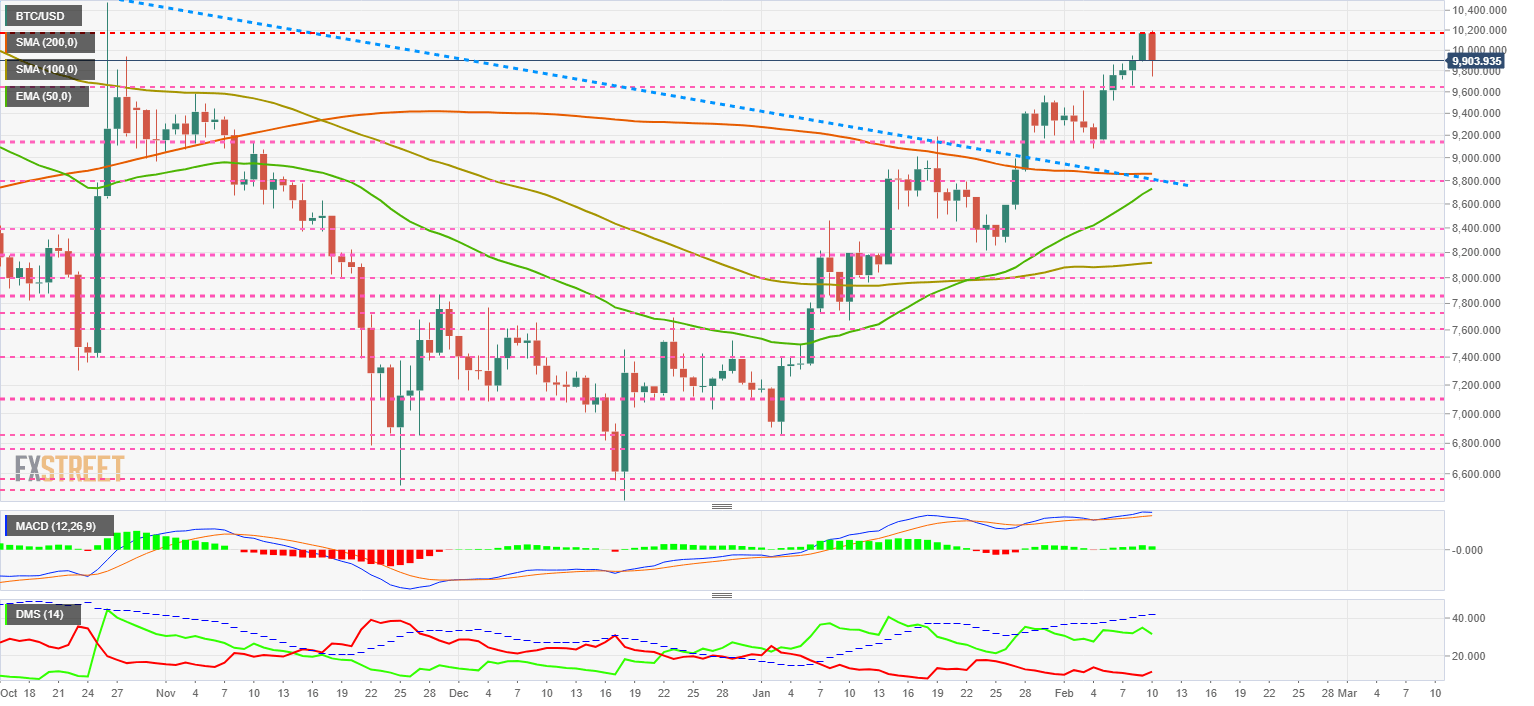
The MACD on the daily chart shows a slight loss of momentum. The development pattern of this structure is usually to drive the price down.
The DMI on the daily chart shows bulls at levels similar to those of recent days, while bears do change their attitude and move upward in response to the current weakness of BTC/USD.
ETH/USD Daily Chart
ETH/USD is currently trading at the $221.5 price level after failing to overcome price congestion resistance at $230.
The rise in Ethereum from December's lows has been very rapid, and a phase of consolidation is very positive.
Above the current price, the first resistance level is at $230, then the second at $240 and the third one at $250.
Below the current price, the first support level is at $212, then the second at $206 and the third one at $200.
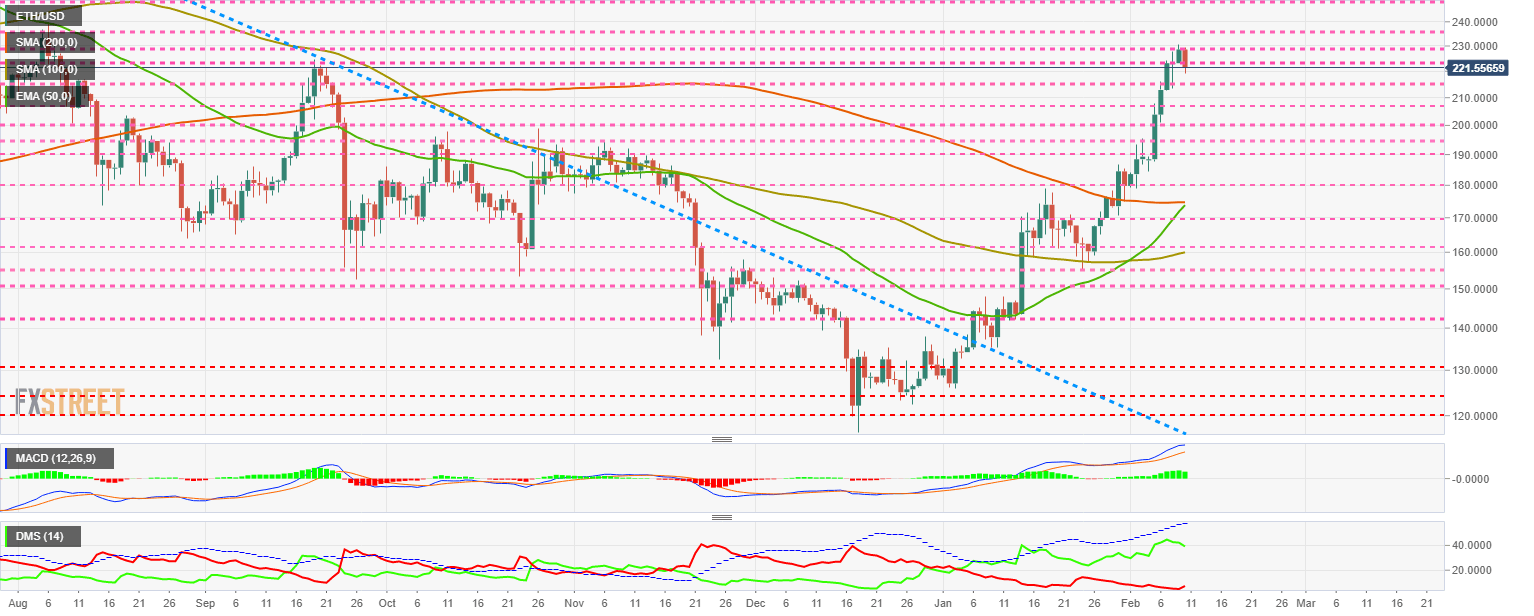
The MACD on the daily chart shows a very positive opening between the lines, although it loses some of its tilt. The current structure is susceptible to buying and may go into full bullish mode again as soon as fresh money returns to the Ether.
The DMI on the daily chart shows that the bulls are losing some ground, but not the bullish trend that began in late December 2019. The bears are moving a little bit higher, but far from discussing the leadership on the buying side.
XRP/USD Daily Chart
XRP/USD is currently trading at the price level of $0.2729 after a failed attempt at the $0.29 and $0.28 levels. News of XRP selling by parent company Ripple Ltd has not helped the bullish trend continue.
Above the current price, the first resistance level is at $0.28, then the second at $0.29 and the third at $0.30.
Below the current price, the first support level is at $0.27, then the second at $0.255 and the third one at $0.237.
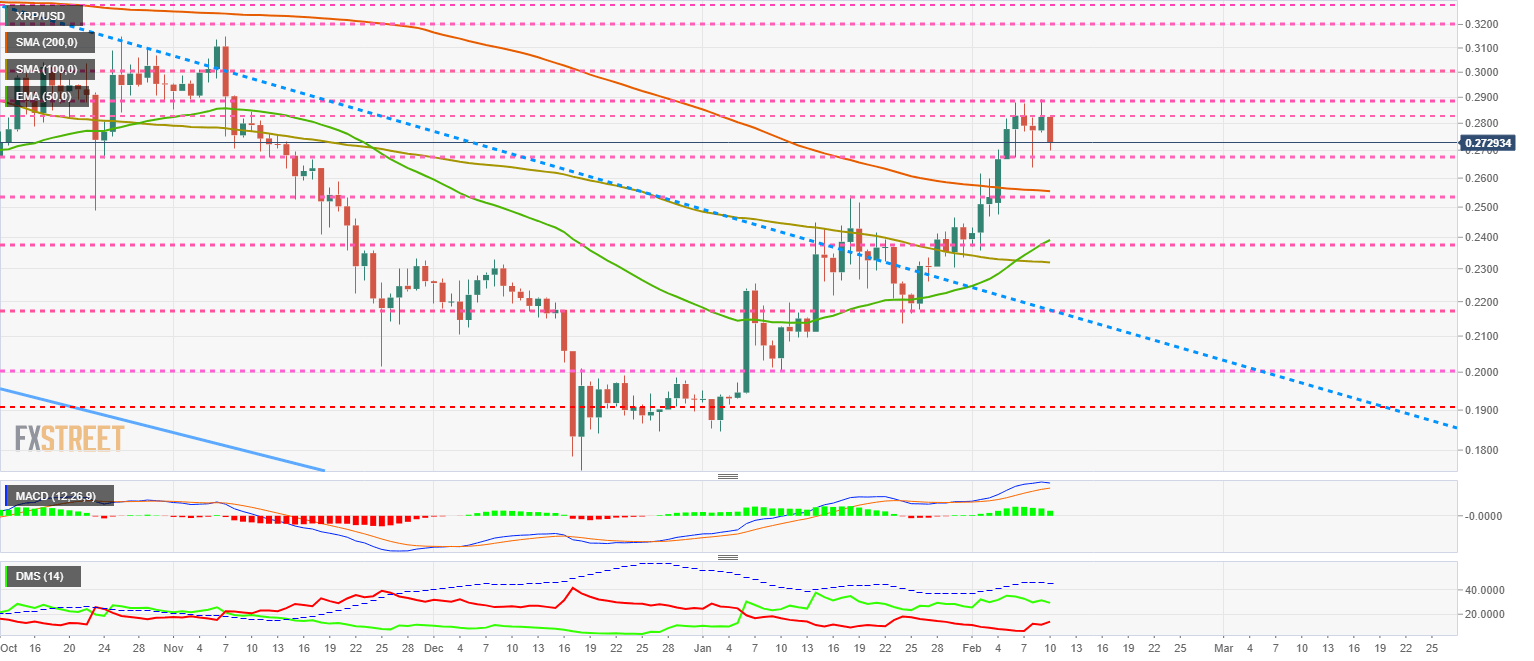 The MACD on the daily chart shows that the upward slope is decreasing slightly, while the opening between the lines is also getting worse.
The DMI on the daily chart shows bulls with a neutral profile, while bears react strongly. It appears that the selling side of the XRP/USD may be able to take the lead in this pair.
Get 24/7 Crypto updates in our social media channels: Give us a follow at @FXSCrypto and our FXStreet Crypto Trading Telegram channel
Information on these pages contains forward-looking statements that involve risks and uncertainties. Markets and instruments profiled on this page are for informational purposes only and should not in any way come across as a recommendation to buy or sell in these assets. You should do your own thorough research before making any investment decisions. FXStreet does not in any way guarantee that this information is free from mistakes, errors, or material misstatements. It also does not guarantee that this information is of a timely nature. Investing in Open Markets involves a great deal of risk, including the loss of all or a portion of your investment, as well as emotional distress. All risks, losses and costs associated with investing, including total loss of principal, are your responsibility. The views and opinions expressed in this article are those of the authors and do not necessarily reflect the official policy or position of FXStreet nor its advertisers. The author will not be held responsible for information that is found at the end of links posted on this page.
If not otherwise explicitly mentioned in the body of the article, at the time of writing, the author has no position in any stock mentioned in this article and no business relationship with any company mentioned. The author has not received compensation for writing this article, other than from FXStreet.
FXStreet and the author do not provide personalized recommendations. The author makes no representations as to the accuracy, completeness, or suitability of this information. FXStreet and the author will not be liable for any errors, omissions or any losses, injuries or damages arising from this information and its display or use. Errors and omissions excepted.
The author and FXStreet are not registered investment advisors and nothing in this article is intended to be investment advice.
Recommended Content
Editors’ Picks

Bitcoin Weekly Forecast: Fed-led rally could have legs towards $65,000
Bitcoin has risen 7% so far this week, supported by the US Fed interest-rate cut and more than $300 million in ETFs inflows. The recent surge led BTC price to shatter several key technical resistance levels, a sign that the current two-week rally has likely some more way to go towards $65,000.

Ethereum, BNB and POL holders on the watch as BingX faces loss of $26 million in hack
Crypto exchange BingX said on Friday that it suffered a hack, an attack that led to “minimal” losses that researchers at PeckShield estimate at $26.68 million. The attacker swapped the stolen altcoins for Ethereum, Binance Coin and Polygon tokens, according to on-chain data.

Pepe price forecast: Eyes for 30% rally
Pepe extends the upward movement on Friday after breaking above the descending trendline and resistance barrier on Thursday. PEPE’s dormant wallets are in motion, and the long-to-short ratio is above one, further supporting this bullish move and hinting at a rally on the horizon.

Shiba Inu is poised for a rally as price action and on-chain metrics signal bullish momentum
Shiba Inu remains strong on Friday after breaking above a symmetrical triangle pattern on Thursday. This breakout signals bullish momentum, further bolstered by a rise in daily new transactions that suggests a potential rally in the coming days.
Bitcoin: Fed-led rally could have legs towards $65,000
Bitcoin (BTC) has risen 7% so far this week, supported by the US Federal Reserve (Fed) interest-rate cut and more than $300 million in ETFs inflows. The recent surge led BTC price to shatter several key technical resistance levels, a sign that the current two-week rally has likely some more way to go towards $65,000.

Moneta Markets review 2024: All you need to know
VERIFIED In this review, the FXStreet team provides an independent and thorough analysis based on direct testing and real experiences with Moneta Markets – an excellent broker for novice to intermediate forex traders who want to broaden their knowledge base.