- The BTC/USD Returns to Sideways Scenario and Loses Momentum.
- The ETH/USD plays with fire and can be burned.
- Ripple plays with advantage and can give, again, the surprise.
A new day begins in Europe with declines in Bitcoin and especially Ethereum, which loses support and begins a new downward stretch. Bitcoin goes back into the lower range that has contained it since early September and clearly gives away the bullish moment.
For its part, the XRP/USD manages to withstand the momentum in the bullish scenario, although the odds of losing it and entering a neutral territory are high.
BTC/USD 240-Min
The BTC/USD at 240-min arrives at the European session maintaining its bearish tone for the fourth consecutive day. Yesterday, the BTC/USD failed to stay above the $6,580 price level and is back in the range it has moved most of the time since early August.
The BTC/USD is currently trading at the price level of $6,417, just $300 below the recent high but which, given the limited space available at the bottom of the price, jeopardizes the short term future.
Above the current price, the scene is filled with resistance once again, as the BTC/USD loses all the moving averages that now become, once again, the obstacle to beat.
The first resistance is at $6,448 (SMA100). If Bitcoin overcomes it, it would leave ahead of the most significant level in both the short and medium term at the aforementioned price level of $6,850 (EMA50 and price congestion support). Recovering this level would return the BTC/USD to the bullish scenario in the short term. As a third bullish target, the relative highs of $6,757 (relative highs and price congestion resistance).
It is worth highlighting how the BTC/USD, an example of volatility and broad ranges, sees its evolution in the medium and long-term compromised in a field of barely $500. It is walking a very thin line. Too thin.
Below the current price, the margin is perhaps even narrower. The first support is at $6.385 (price congestion support). Ether will probably lose this support in the next few hours. Below this level, the next cushion is at $6,200 (price congestion support), only a few dollars above the scenario price limit at $6,190 (trend line from year lows).
The loss of this important trend line would open the door to panic and we could see very strong declines.
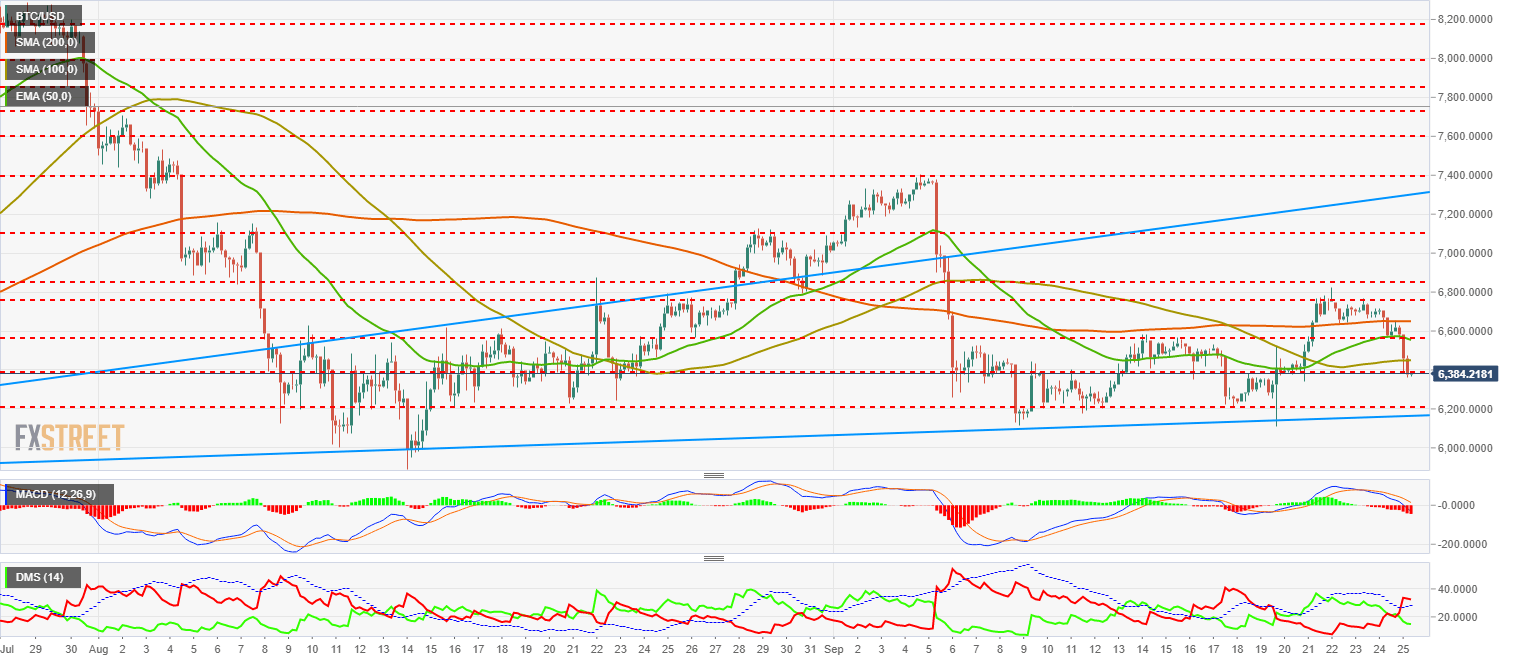
The MACD at 240-Min is fully in line with the bearish movement. The opening and tilt between the moving averages, reinforce the continuity of the weakness. It slightly enters the indicator’s negative terrain.
The DMI at 240-Min shows us how the bears believe the decline and enter the market with strength. They are above the ADX and comply with the typical pattern of this indicator. Sellers have the potential to be in charge for several days. Bulls retreat and return to minimum levels.
ETH/USD 240-Min
The ETH/USD suffers the most today. It completely loses the bullish line from the annual lows, and moving averages also become resistance lines and increase the likelihood of seeing Ether again below $200.
The ETH/USD is currently quoted at the $211 price level. It is battling not to lose the SMA100 definitively, but I get the impression that that battle is already lost. Right now it's a falling knife and all we can do is wait for it to hit the ground.
Above the current price, the first resistance is just above the current price level at $211.92 (SMA100). If it manages to recover above this moving average, the ETH/USD would face a significant resistance level at $224 (EMA50 and price congestion resistance).
As a third resistance, it would point to the price range between $240 (SMA200) and the bearish channel ceiling at $255.
Below the current price, the first support for the ETH/USD at the $195 price level (price congestion support). It is the last stop before annual lows at $170 (price congestion support and year lows). If the ETH/USD were to lose this last level of support, a panic scenario would open, as well as opportunities at $155 (price congestion support), $125 (price congestion support) and $95 (price congestion support).
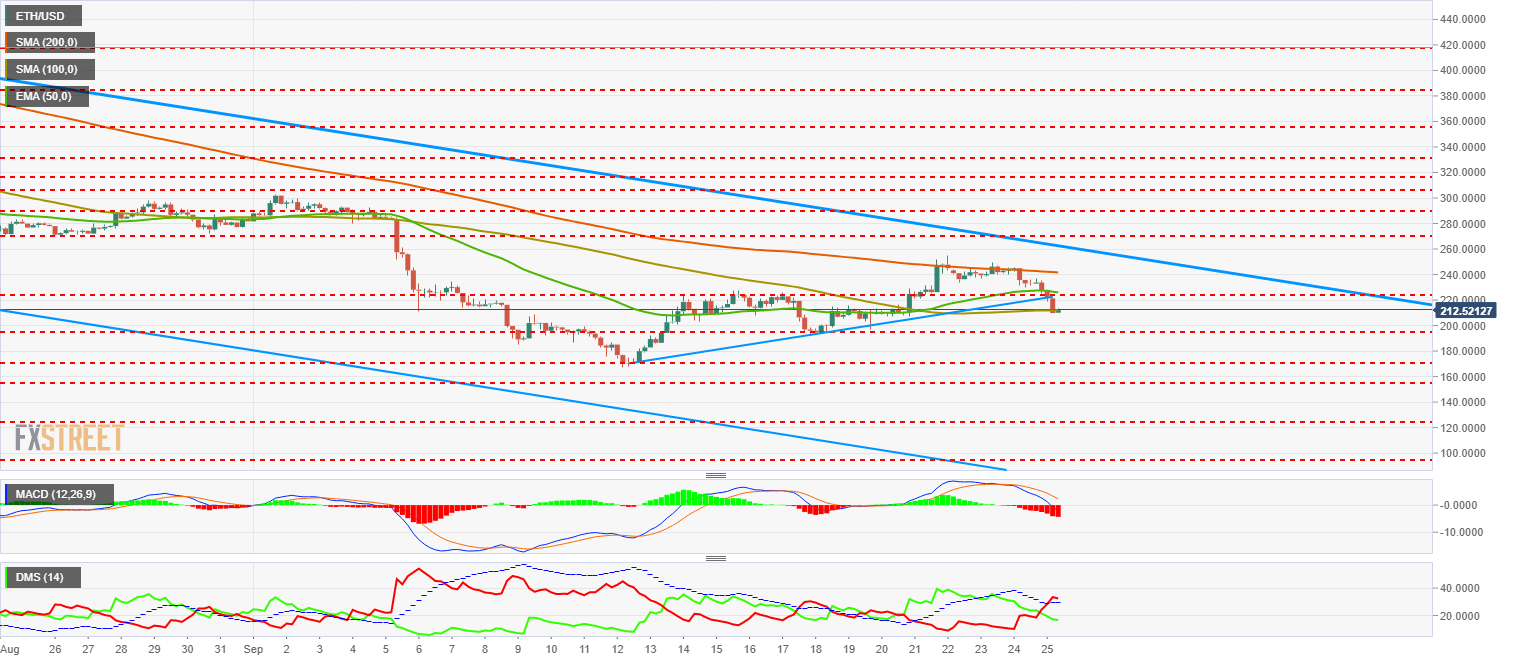
The MACD at 240-Min confirms the bearish environment. The gap between the lines augurs a downward trend for several periods before we can see any upward reaction.
The DMI at 240-Min shows us how bears convince themselves of falls and increase their activity. On the other hand, the bulls continue in a soft downward trend and maintain an acceptable level of activity. This is contradictory to price action.
XRP/USD 240-Min
The XRP/USD is currently trading at the $0.44 price level and is once again losing the base of the long-term channel recovered last week. The XRP/USD loses the EMA50 at 240-Min but remains above the SMA100 and the SMA200. Ripple is, of the three leaders of the Crypto board, the only one who can boast about it.
Above the current price, the first and most important resistance is at $0.457 price level (EMA50, price congestion resistance, and long-term channel base). Recovering this level would send a very powerful message to the market and could catapult Ripple to the second position by market capitalization, especially with an Ether in technical KO.
Beyond this resistance level, the next level is $0.505 (price congestion resistance). The third resistance level is $0.55 (price congestion resistance). The key bullish technical objective is at the long-term channel ceiling of $0.80.
Below the current price, the first support line awaits at $0.444 (price congestion support), the second support level awaits at $0.429 (price congestion support) and the third support level awaits at $0.412 (price congestion support). It should be noted that the first moving average is $0.356 (SMA100).
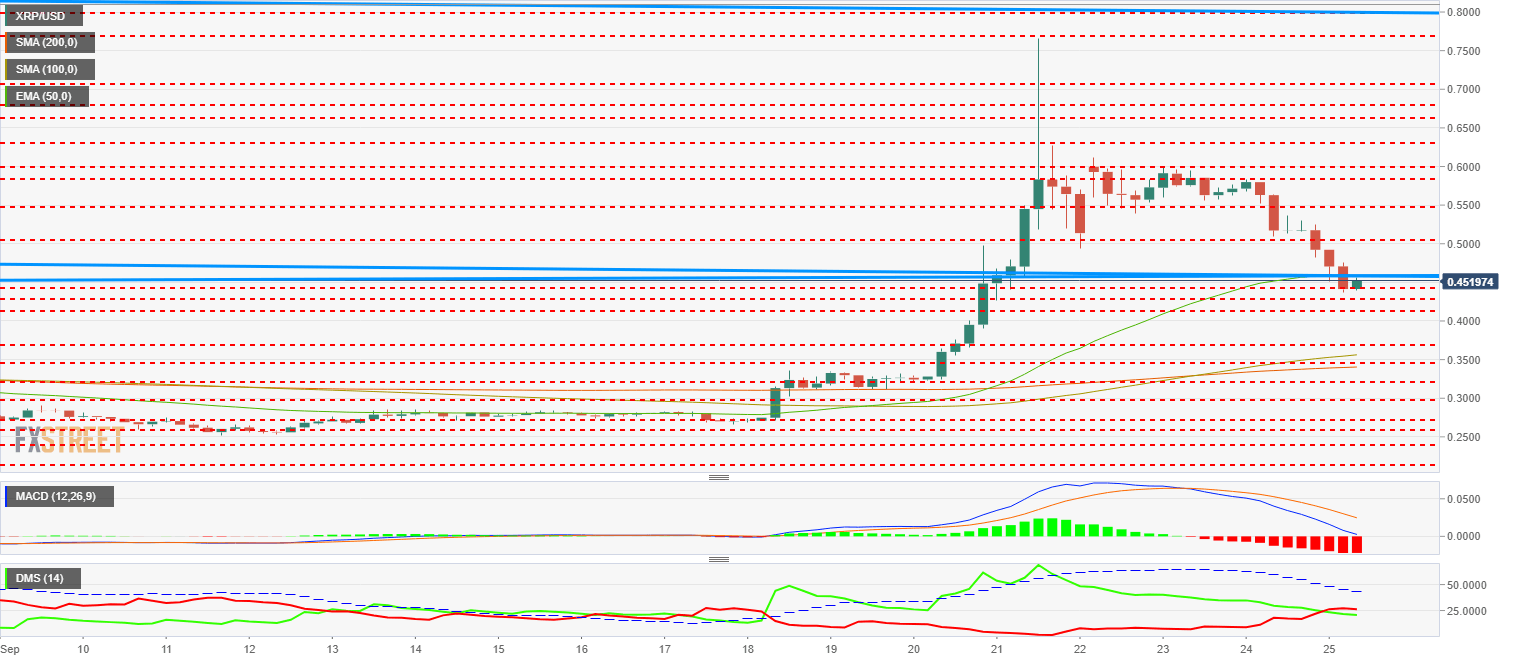
The MACD at 240-Min is fully open down but clearly remains on the bullish side of the indicator. It has room to turn upside down without entering the bearish zone. Ripple clearly has the best setup out of the three cryptos.
The 240-Min DMI shows the bears slightly above the bulls for very little. The most statistically probable pattern is that the bulls take control again in a very short period of time.
Get 24/7 Crypto updates in our social media channels: Give us a follow at @FXSCrypto and our FXStreet Crypto Trading Telegram channel
Information on these pages contains forward-looking statements that involve risks and uncertainties. Markets and instruments profiled on this page are for informational purposes only and should not in any way come across as a recommendation to buy or sell in these assets. You should do your own thorough research before making any investment decisions. FXStreet does not in any way guarantee that this information is free from mistakes, errors, or material misstatements. It also does not guarantee that this information is of a timely nature. Investing in Open Markets involves a great deal of risk, including the loss of all or a portion of your investment, as well as emotional distress. All risks, losses and costs associated with investing, including total loss of principal, are your responsibility. The views and opinions expressed in this article are those of the authors and do not necessarily reflect the official policy or position of FXStreet nor its advertisers. The author will not be held responsible for information that is found at the end of links posted on this page.
If not otherwise explicitly mentioned in the body of the article, at the time of writing, the author has no position in any stock mentioned in this article and no business relationship with any company mentioned. The author has not received compensation for writing this article, other than from FXStreet.
FXStreet and the author do not provide personalized recommendations. The author makes no representations as to the accuracy, completeness, or suitability of this information. FXStreet and the author will not be liable for any errors, omissions or any losses, injuries or damages arising from this information and its display or use. Errors and omissions excepted.
The author and FXStreet are not registered investment advisors and nothing in this article is intended to be investment advice.
Recommended Content
Editors’ Picks
Crypto traders brace for short-term volatility with $2.4 billion options expiry on Friday

Bitcoin and Ethereum options market looks bullish on Friday, according to data from intelligence tracker Greeks.live. The firm said it has identified two Bitcoin calls that show an underlying bullish sentiment among market participants.
XRP recovers from week-long decline following Ripple’s response to SEC motion

Ripple filed a letter to the court to support its April 22 motion to strike new expert materials. The legal clash concerns whether SEC accountant Andrea Fox's testimony should be treated as a summary or expert witness.
Lido adds 4% gains as protocol rolls out first step towards decentralization
Lido takes the first batch of simple DVT validators to live, a step taken to decentralize the protocol. Lido leveraged technology to expand the protocol to multiple node operators, inviting both solo and community stakers.
Bitcoin Weekly Forecast: Should you buy BTC here? Premium

Bitcoin (BTC) price shows signs of a potential reversal but lacks confirmation, which has divided the investor community into two – those who are buying the dips and those who are expecting a further correction.
Bitcoin: Should you buy BTC here? Premium
Bitcoin (BTC) price shows signs of a potential reversal but lacks confirmation, which has divided the investor community into two – those who are buying the dips and those who are expecting a further correction.