- Bitcoin loses strength versus the altcoins, which are more resistant to falls.
- The market is once again feeling fear, according to sentiment indicators.
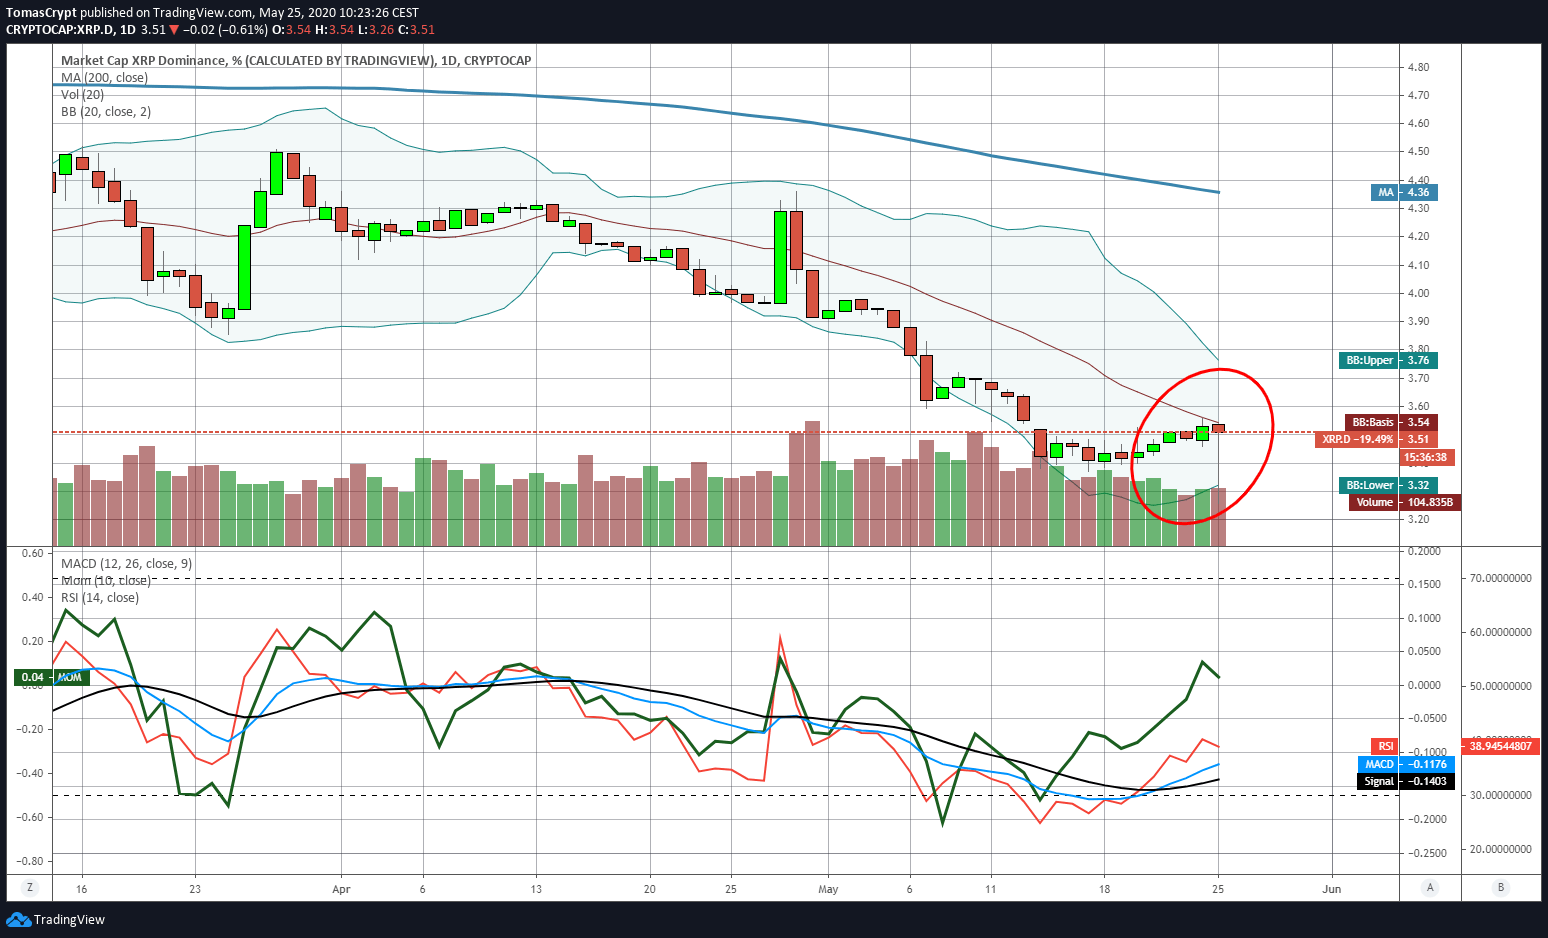
- The XRP, the last one to reach the market share battle, shows strong growth potential.
The cryptocurrencies market started the last week of May with significant drops that closed last week below the $9000 price level for Bitcoin.
Ethereum confirms the market's weakness in the short term as it closed yesterday at the price level of $195.5. Closing below the $200 level with such a small margin shows that the bulls are not in the business of defending the price structure to keep it up.
The dominance charts confirm the trend change initiated last week and Bitcoin continues to lose market share against Ethereum and other Altcoins.
XRP recovers the pace of improvement in market share in a significant way after a volatile session that has taken it to a new relative low at the 3.24% dominance level. The technical structure of the XRP dominance chart is strongly bullish. The short-term target is at 3.8%, and the medium-term target is at 4.3%.
The media focus is starting to focus on the future release of version 2.0 of the Ethereum network. The market expects a first test of the new version after the summer.
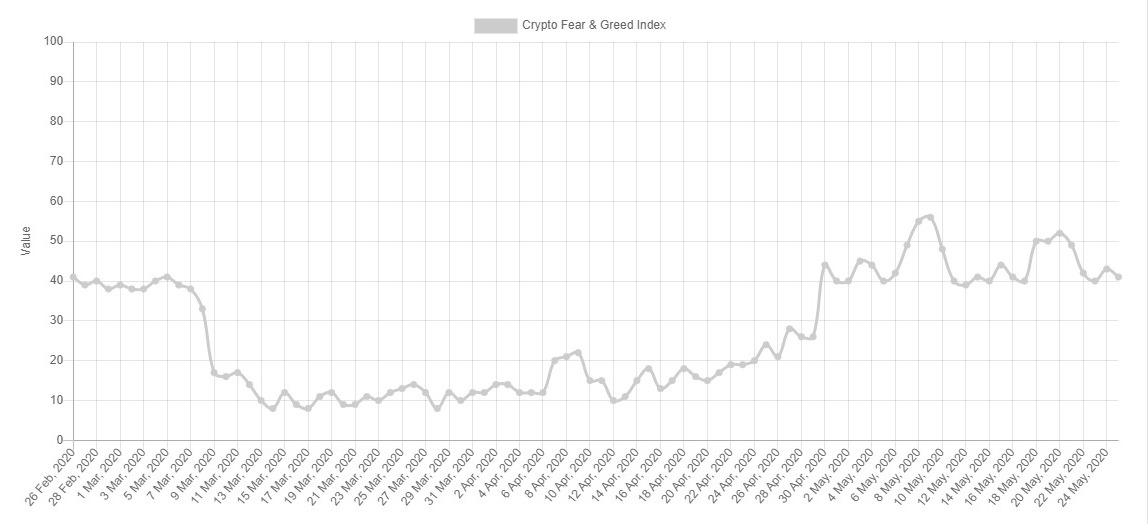
Source: alternative.me
Fear has again spread among crypto market participants, and today it drops to level 41 after reaching level 50 last week.
ETH/BTC Daily Chart
The ETH/BTC pair is rushing upwards and is already moving above the 50-day exponential moving average.
Above the current price, the first resistance level is at 0.0237, then the second at 0.024 and the third one at 0.0248.
Below the current price, the first support level is at 0.023, then the second at 0.022 and the third one at 0.0217.
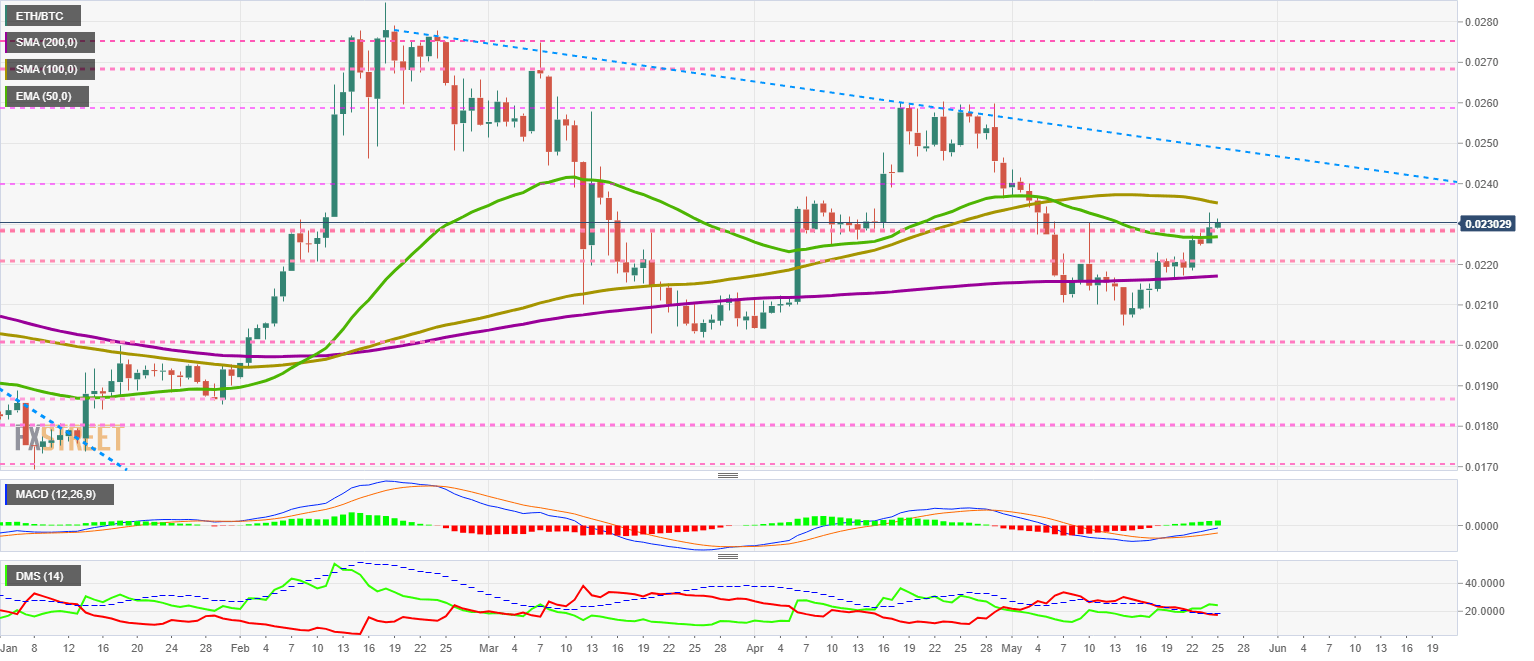
The MACD on the daily chart continues its upward trend and is approaching the neutral level of the indicator where resistance to the upward movement will increase.
The DMI on the daily chart shows the bulls controlling the ETH/BTC pair but without enough of a lead to rule out a change in direction.
BTC/USD Daily Chart
The BTC/USD pair is currently trading at the $8830 price level and is attempting to regain the $8800 price support level it lost at yesterday's close.
The 200-day simple moving average is leaning dangerously low and could be signalling continued downward movement towards the $7000-$7500 levels.
Above the current price, the first resistance level is at $9150, then the second at $9500 and the third one at $10,000.
Below the current price, the first support level is at $8550, then the second at $8150 and the third one at $8000.
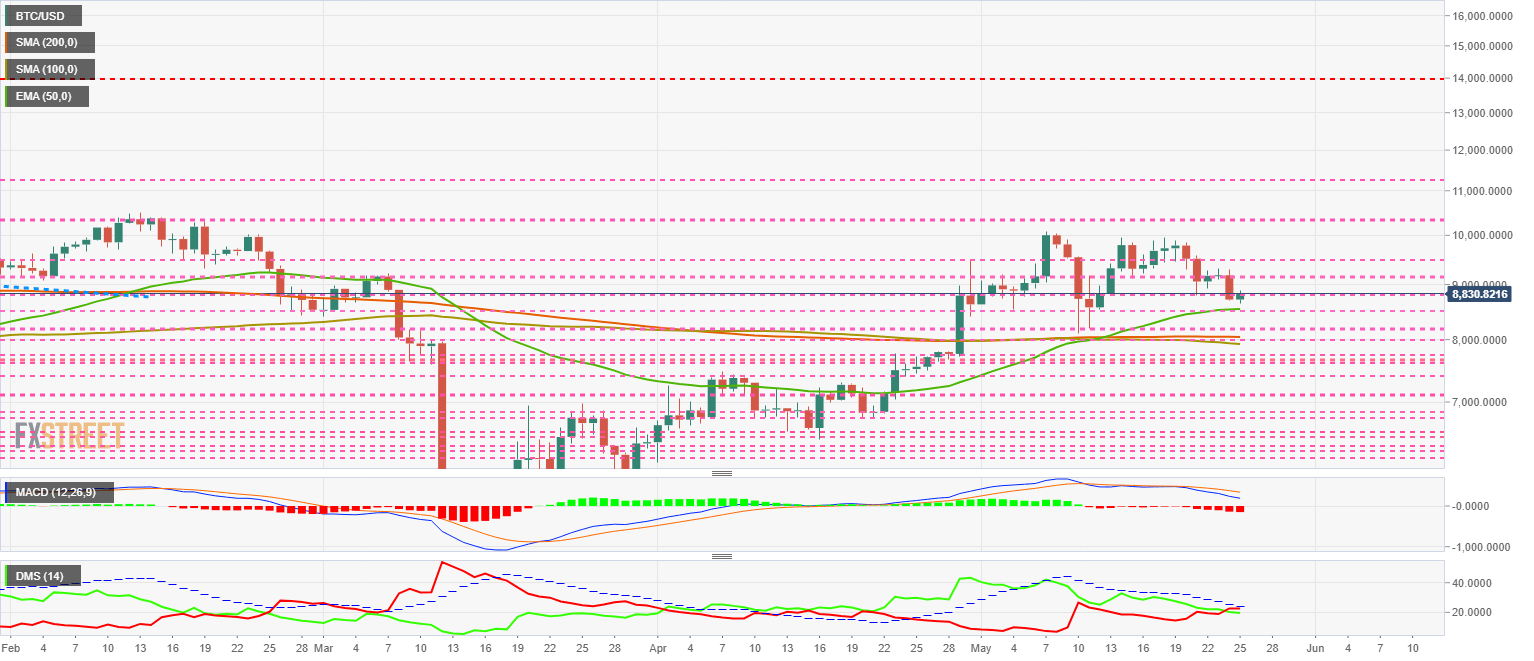
The MACD on the daily chart increases the bearish profile – both in slope and in the opening between the average lines.
The DMI on the daily chart shows bears gaining control of the pair momentarily. The bears are very close and may try to regain the lead over BTC/USD at any time.
ETH/USD Daily Chart
The ETH/USD pair is currently trading at $203.4. The weekly close at $199.5 is a dangerous sign of weakness that we should be aware of before we rush to buy.
Above the current price, the first resistance level is at $207.5, then the second at $215 and the third one at $225.
Below the current price, the first support level is at $200, then the second at $195 and the third one at $190.
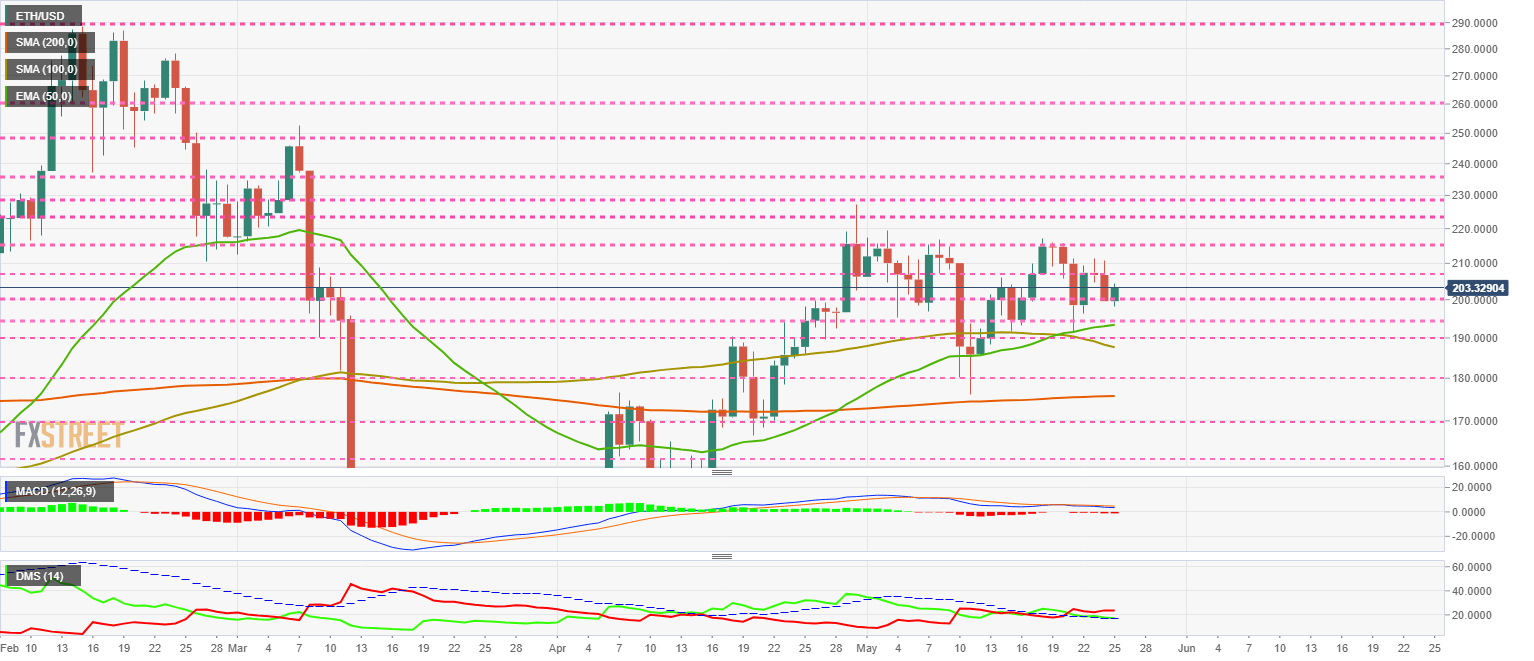
The MACD on the daily chart shows a slightly downward sloping side profile, open the door to an unexpected upward movement.
The DMI on the daily chart shows bears controlling the pair. The bulls are still above the ADX line, which would allow them to move up with little resistance.
XRP/USD Daily Chart
The XRP/USD pair is currently trading at the price level of $0.194. The technical structure denies the bullish potential it was hinting at during last Friday's session.
Above the current price, the first resistance level is at $0.20, then the second at $0.217 and the third one at $0.24.
Below the current price, the first support level is at $0.19, then the second at $0.18 and the third one at $0.162.
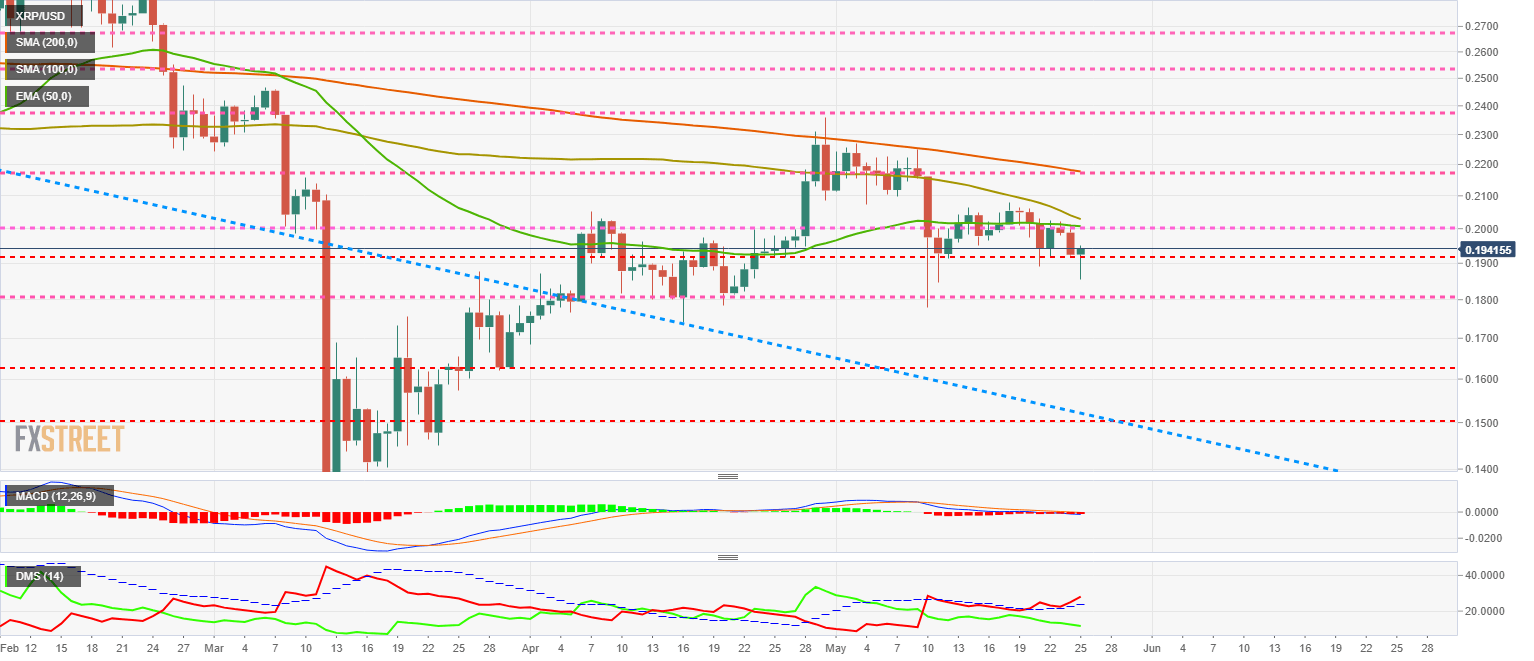
The MACD on the daily chart shows a completely flat profile and in the neutral zone of the indicator. This structure does not provide any visibility about the future development of the price.
The DMI on the daily chart shows the bears gaining strength and with a lot of advantage against a buying side that keeps losing levels constantly.
Information on these pages contains forward-looking statements that involve risks and uncertainties. Markets and instruments profiled on this page are for informational purposes only and should not in any way come across as a recommendation to buy or sell in these assets. You should do your own thorough research before making any investment decisions. FXStreet does not in any way guarantee that this information is free from mistakes, errors, or material misstatements. It also does not guarantee that this information is of a timely nature. Investing in Open Markets involves a great deal of risk, including the loss of all or a portion of your investment, as well as emotional distress. All risks, losses and costs associated with investing, including total loss of principal, are your responsibility. The views and opinions expressed in this article are those of the authors and do not necessarily reflect the official policy or position of FXStreet nor its advertisers. The author will not be held responsible for information that is found at the end of links posted on this page.
If not otherwise explicitly mentioned in the body of the article, at the time of writing, the author has no position in any stock mentioned in this article and no business relationship with any company mentioned. The author has not received compensation for writing this article, other than from FXStreet.
FXStreet and the author do not provide personalized recommendations. The author makes no representations as to the accuracy, completeness, or suitability of this information. FXStreet and the author will not be liable for any errors, omissions or any losses, injuries or damages arising from this information and its display or use. Errors and omissions excepted.
The author and FXStreet are not registered investment advisors and nothing in this article is intended to be investment advice.
Recommended Content
Editors’ Picks
Crypto traders brace for short-term volatility with $2.4 billion options expiry on Friday

Bitcoin and Ethereum options market looks bullish on Friday, according to data from intelligence tracker Greeks.live. The firm said it has identified two Bitcoin calls that show an underlying bullish sentiment among market participants.
XRP recovers from week-long decline following Ripple’s response to SEC motion

Ripple filed a letter to the court to support its April 22 motion to strike new expert materials. The legal clash concerns whether SEC accountant Andrea Fox's testimony should be treated as a summary or expert witness.
Lido adds 4% gains as protocol rolls out first step towards decentralization
Lido takes the first batch of simple DVT validators to live, a step taken to decentralize the protocol. Lido leveraged technology to expand the protocol to multiple node operators, inviting both solo and community stakers.
Bitcoin Weekly Forecast: Should you buy BTC here? Premium

Bitcoin (BTC) price shows signs of a potential reversal but lacks confirmation, which has divided the investor community into two – those who are buying the dips and those who are expecting a further correction.
Bitcoin: Should you buy BTC here? Premium
Bitcoin (BTC) price shows signs of a potential reversal but lacks confirmation, which has divided the investor community into two – those who are buying the dips and those who are expecting a further correction.