Top 3 Price Prediction Bitcoin, Ethereum, Ripple: Euphoria warns of danger
- Market optimism soars to dangerous levels in the short term.
- A massive drop in the crypto market could trigger a rotation that would benefit Bitcoin.
- Ripple can continue to rise and move towards the $0.50 level.

Euphoria is spreading in the crypto market, and market sentiment readings are reaching a very worrying level today.
The market sentiment indicator published by the website alternative.me reaches today the 84 levels from the 78 printed yesterday.
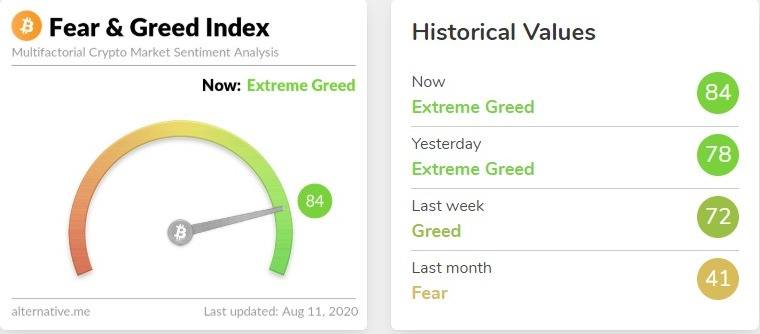
This high level of optimism will almost inevitably lead to discouragement if prices don't start to rise soon, and for now Bitcoin, Ethereum and Ripple are playing hooky.
The consolidation figures seen in the Top 3 charts are ambiguous. All three could develop a new uptrend, although in all likelihood they would do so in terminal mode, subsequently falling in search of support to consolidate the significant uptrend of previous months.
From the crypto ecosystem, the current moment invites us to look for opportunities to balance the portfolio towards Bitcoin, which after giving up market dominance against Ethereum, shows technical patterns that are favorable to a recovery in the short term.
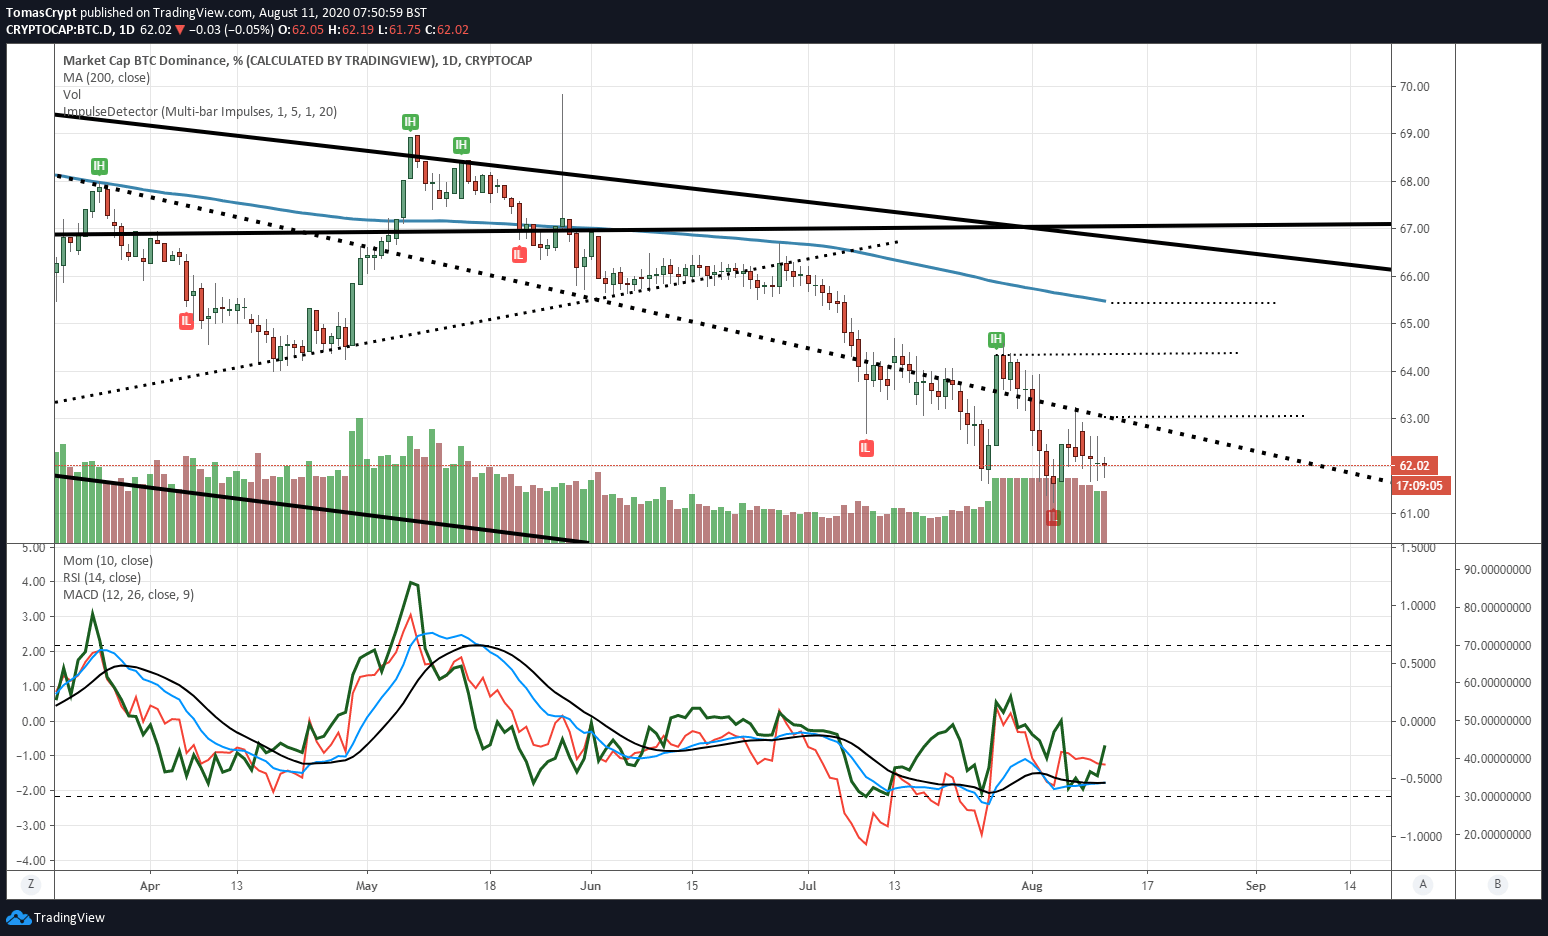
Bitcoin's current dominance level is 62.03, up from 69 in May. The first bullish target of the move is at 63.1, then at 64.3 and the third one at 65.45.
ETH/BTC Daily Chart
The ETH/BTC pair is currently trading at the price level of 0.0332 after finding reliable support at 0.033. The previous bullish consolidation found the ground at 0.029, so the current one should not go higher than 0.0296. Technical indicators are showing more declines in the coming days.
Above the current price, the first resistance level is at 0.0352, then the second at 0.0367 and the third one at 0.0392.
Below the current price, the first support level is at 0.033, then the second at 0.0306 and the third one at 0.0296.
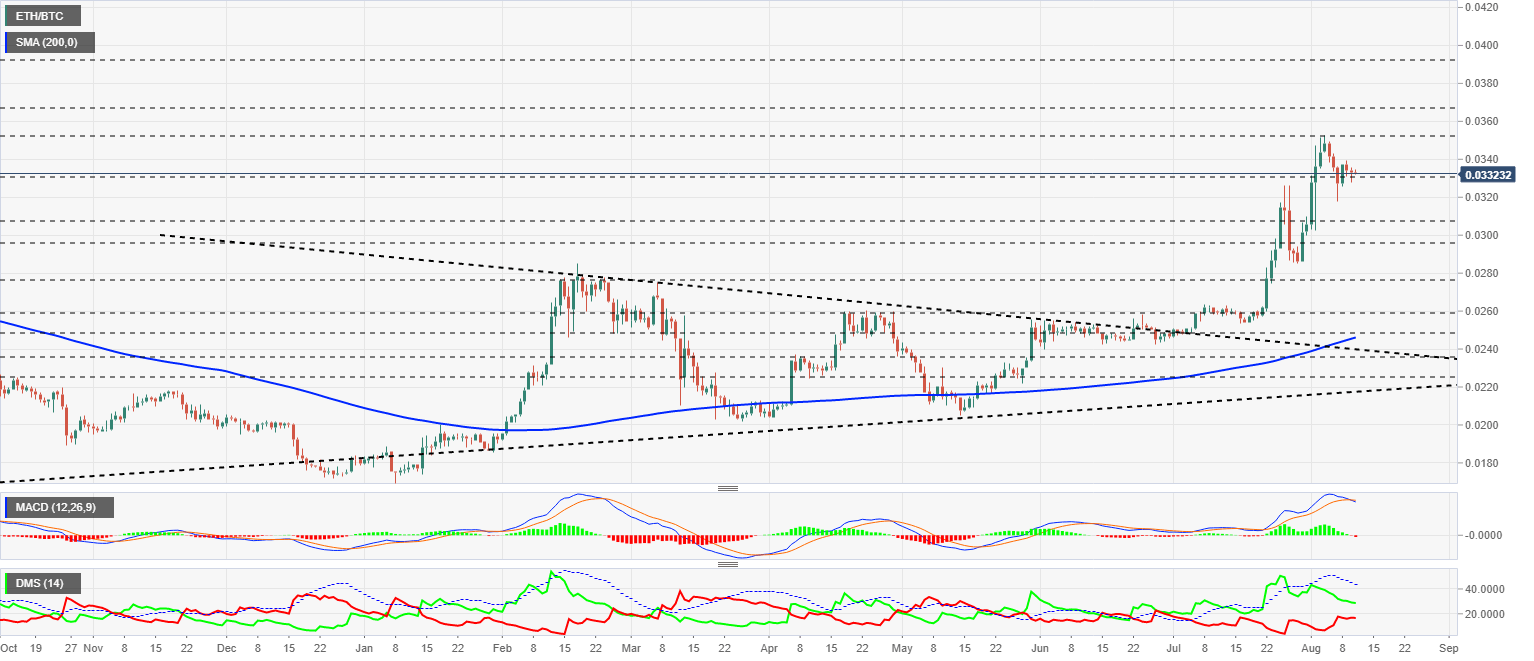
The MACD on the daily chart finally confirms the bearish cross, although the figure is undeveloped and could maintain a sideways tone in the price for a while.
The DMI on the daily chart shows the bulls following their downward trend, while the bears remain flat but close to being able to take control of the pair.
BTC/USD Daily Chart
The BTC/USD pair is currently trading at $11771 and continues the lateral bullish movement of the past few days. The Bitcoin is limited at the top by a trend line that formed earlier in the year. BTC/USD has little resistance to separate it from the historic highs, but the current scenario is not easy to break out of the upside.
Above the current price, the first resistance level is at $12310, then the second at $12860 and the third one at $14150.
Below the current price, the first support level is at $11350, then the second at $10440 and the third one at $9650.
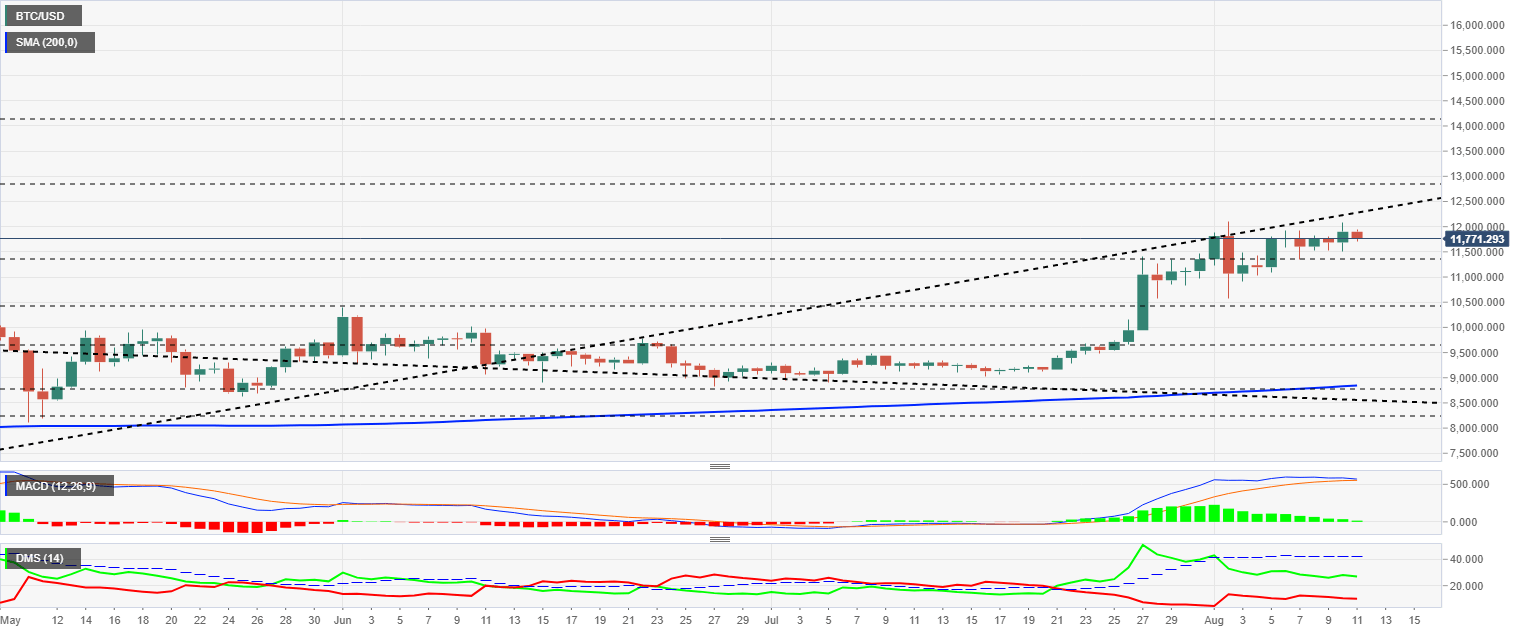
The MACD on the daily chart has a very flat profile with a tendency to cross over in the next few sessions. The current structure would still allow for a new bullish stretch although of a terminal nature.
The DMI on the daily chart shows both sides of the market following a lateral move for many days. The lack of direction on the D+ and D- indicators dramatically reduces the visibility of the BTC/USD pair.
ETH/USD Daily Chart
The ETH/USD pair is currently trading at the price level of $391.6 and is unable to overcome the price congestion resistance at $400.
Above the current price, the first level of resistance is at $400, then the second at $440 and the third one at $500.
Below the current price, the first support level is at $360, then the second at $318 and the third one at $288.
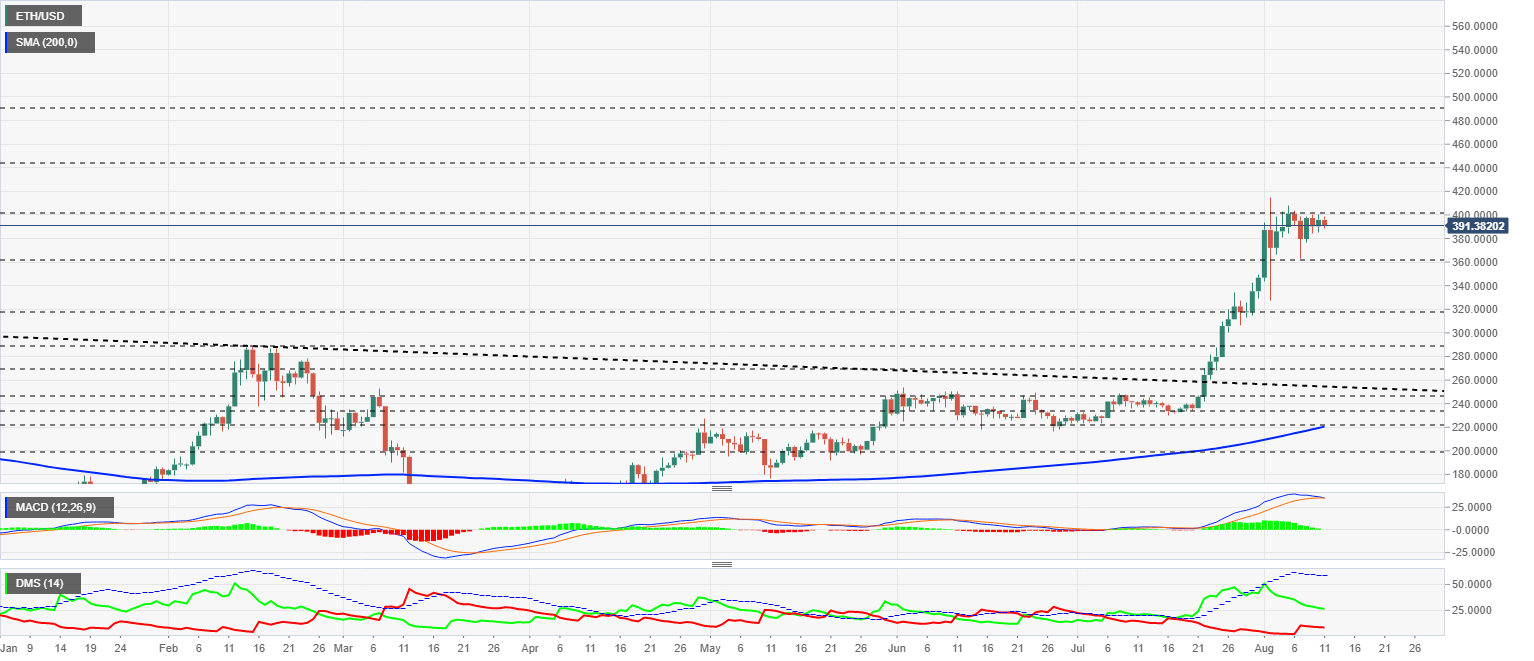
The MACD on the daily chart is about to cross over to the downside, a bearish cross that could trigger a rotation towards Bitcoin when confirmed. The current structure gives little chance of a bullish rebound, which would be terminal anyway.
The DMI on the daily chart shows bulls in a downtrend while bears flattened out waiting to move up to take control of the ETH/USD pair.
XRP/USD Daily Chart
The XRP/USD pair is currently trading at the price level of $0.2989 and confirms the importance of the price congestion resistance level at $0.308.
Above the current price, the first resistance level is at $0.308, then the second at $0.337 and the third one at $0.381.
Below the current price, the first support level is at $0.285, then the second at $0.262 and the third one at $0.235.
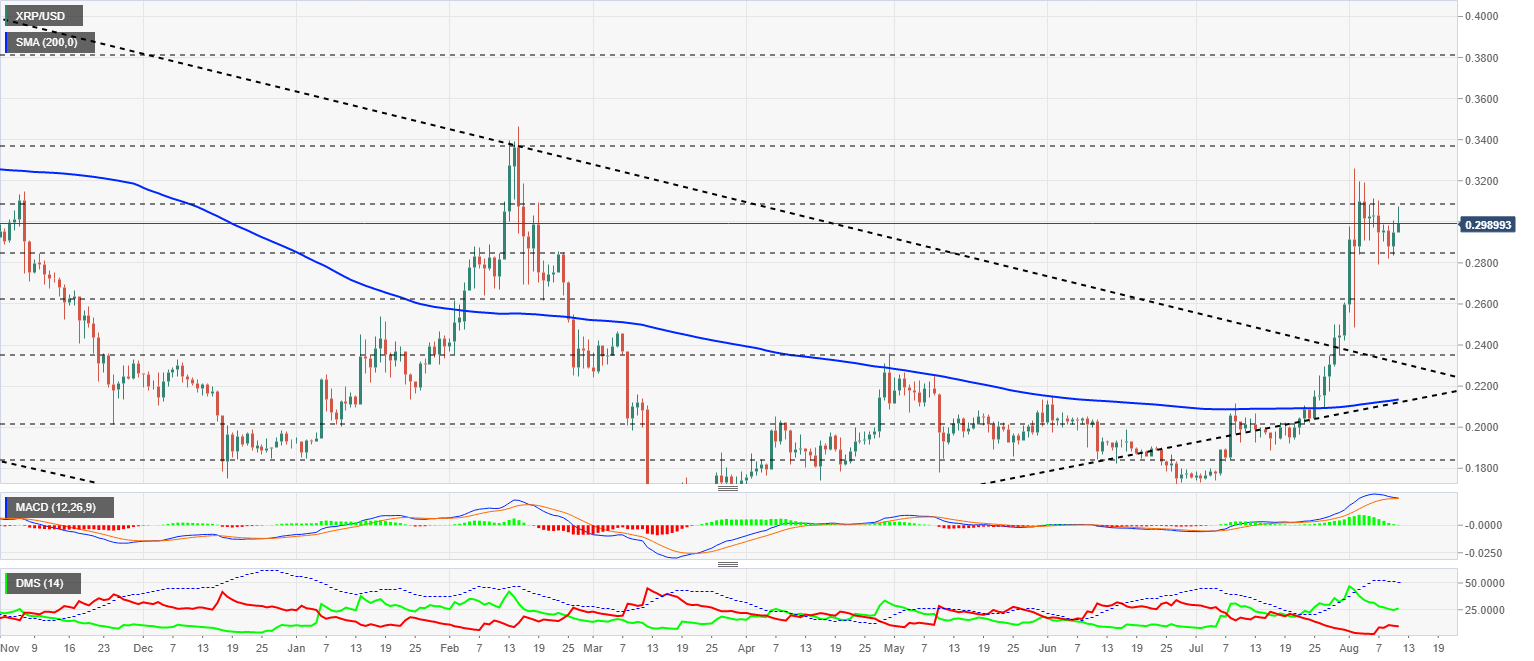
The MACD on the daily chart is close to the bearish cross, although the flat profile of the fast-moving average increases the possibility of a further upward movement.
The DMI on the daily chart shows the bulls moving upward as the bears move downward. The possibilities of a terminal structure bullish trend are high.
Author

Tomas Salles
FXStreet
Tomàs Sallés was born in Barcelona in 1972, he is a certified technical analyst after having completing specialized courses in Spain and Switzerland. He expanded his technical training following the guidance of great experts on the financial markets.


