Top 3 Price Prediction Bitcoin, Ethereum, Ripple: Ethereum hits Bitcoin's bid to lead the market
- Bitcoin risks dominance after the strong rise of Ethereum.
- Technical indicators show some significant discrepancies keeping the stress on the board.
- Sentiment levels are improving and bordering on optimism.

The structural tension in the crypto market is increasing after yesterday's significant rise in Ethereum. The fear of being left out (FOMO) of the launch of the UNI token by Uniswap triggered the perception of the value of the Ethereum network and consequently its interest in taking part in the project.
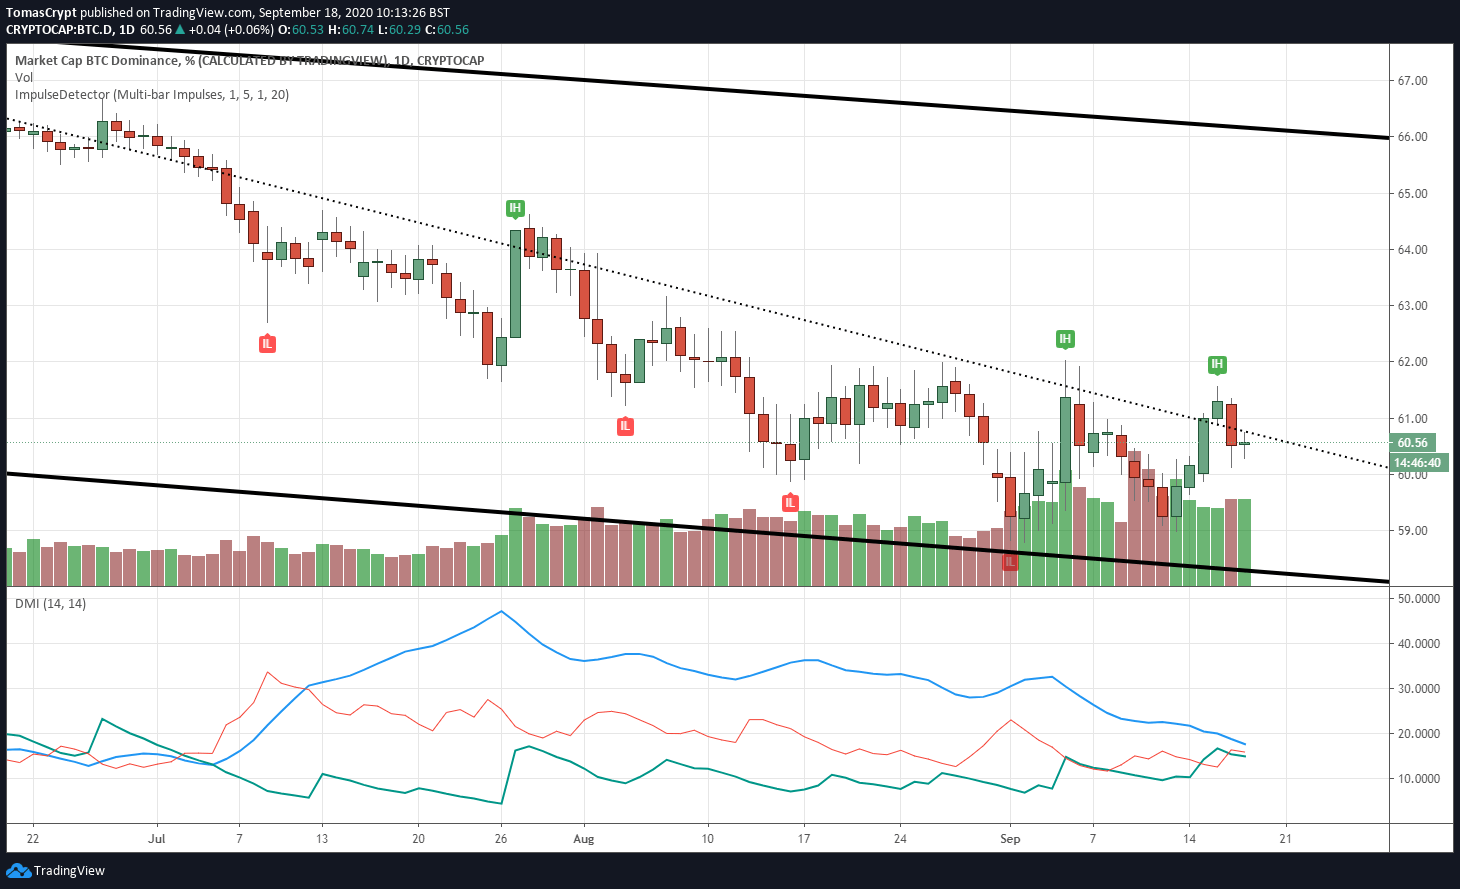
The impact of the rise on the volatile structure underlying the market was that Bitcoin, on its dominance chart, fell back below the downward trend line it had conquered 48 hours ago.
Against fiat currencies, the situation is no longer calm. Technical indicators continue to show dual scenarios that could be broken violently as either up or down.
The Bitcoin dominance chart does not show irreparable damage, but it does require a quick response, or we could see a sharp drop in market share in the coming days in search of lower support at the 58% level.
The market sentiment level improves by one point and today is at the 49 level, counting the rise in Ethereum as positive, something that until now has been a Bitcoin exclusive.
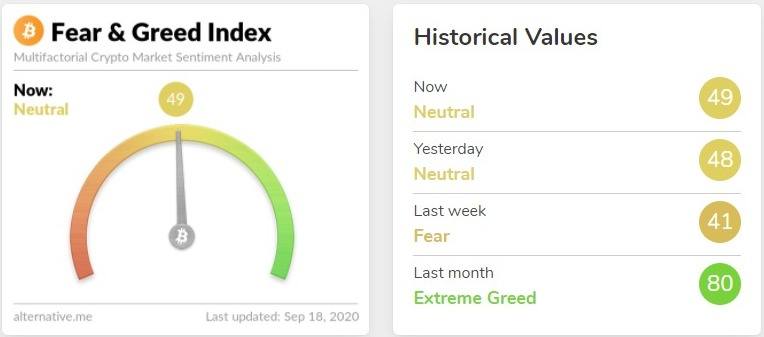
Source: alternative.me
ETH/BTC Daily Chart
The ETH/BTC pair is currently trading at 0.0352 and is moving away from yesterday's high of 0.036.
Above the current price, the first resistance level is at 0.036, then the second at 0.0372 and the third one at 0.040.
Below the current price, the first support level is at 0.035, then the second at 0.0327 and the third one at 0.0315.

The MACD on the daily chart is losing its bullish profile after finding support at the neutral level. If the indicator moves downwards, it will trigger a development that is unusual from the current position.
The DMI on the daily chart shows the bulls distancing themselves from the bears, although the sell-side does not lose strength and remains above the ADX line. Bears, from this position, can quickly move upwards and snatch the lead from the buying side.
BTC/USD Daily Chart
The BTC/USD pair is currently trading at the price level of $10934 and is strangely far from the price congestion resistance level of $11000.
Above the current price, the first resistance level is at $11000, then the second at $11350 and the third one at $11950.
Below the current price, the first support level is at $10450, then the second at $10000 and the third one at $9500.
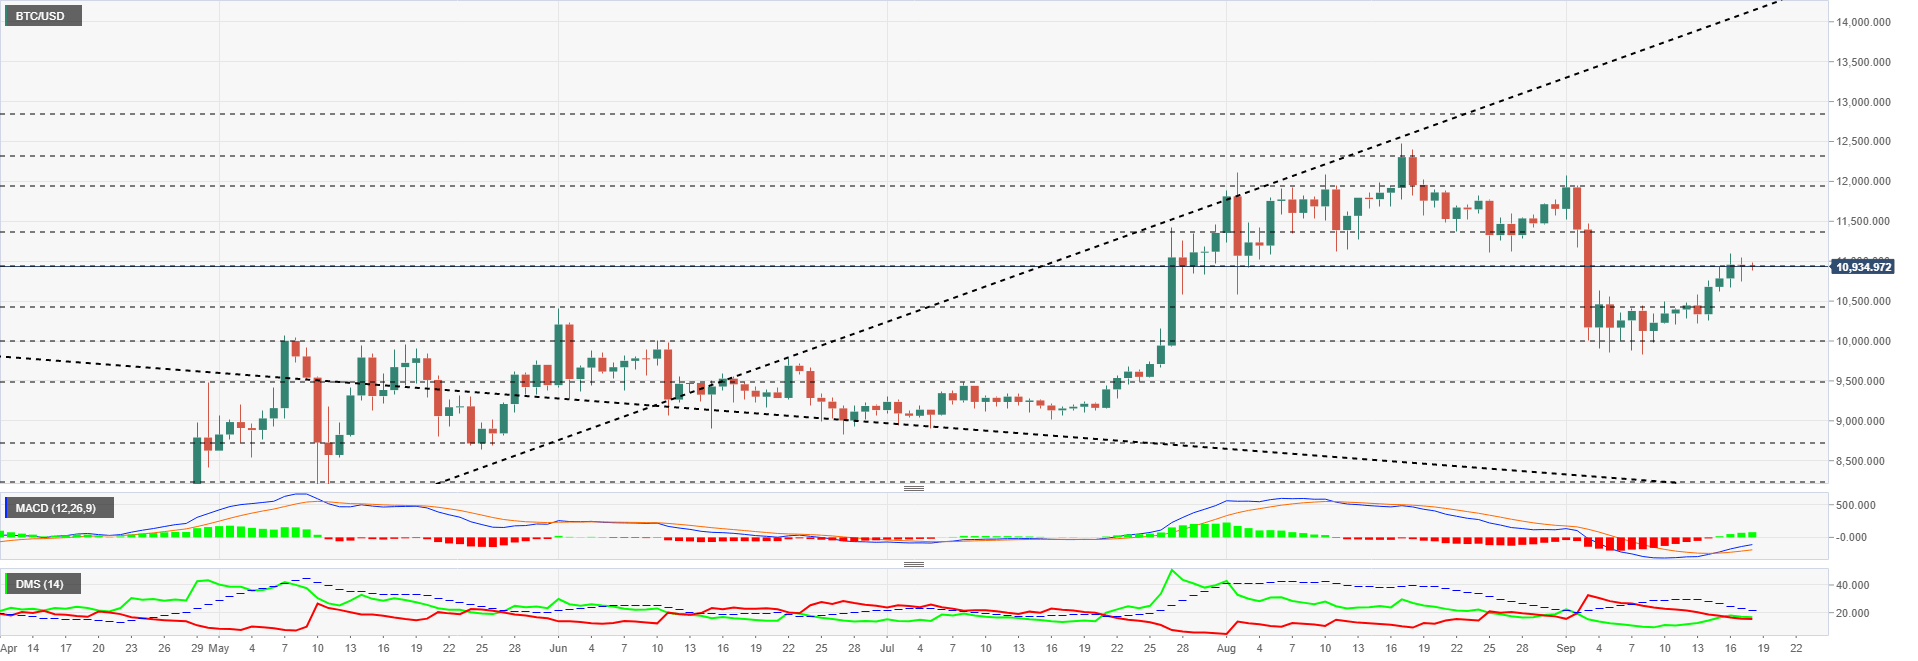
The MACD on the daily chart shows a similar bullish profile to the previous days and is not losing momentum despite being stuck below $11000.
The DMI on the daily chart shows the bulls resisting above the bears but very limited by the presence of the ADX line exercising technical resistance.
ETH/USD Daily Chart
The ETH/USD pair is currently trading at $384.5 and confirms the price's congestion resistance level at $389.5 as being very relevant. Above this price level, Ethereum would fly around $400 quickly.
Above the current price, the first resistance level is at $389.5, then the second at $408 and the third one at $418.
Below the current price, the first support level is at $365, then the second at $335 and the third one at $318.
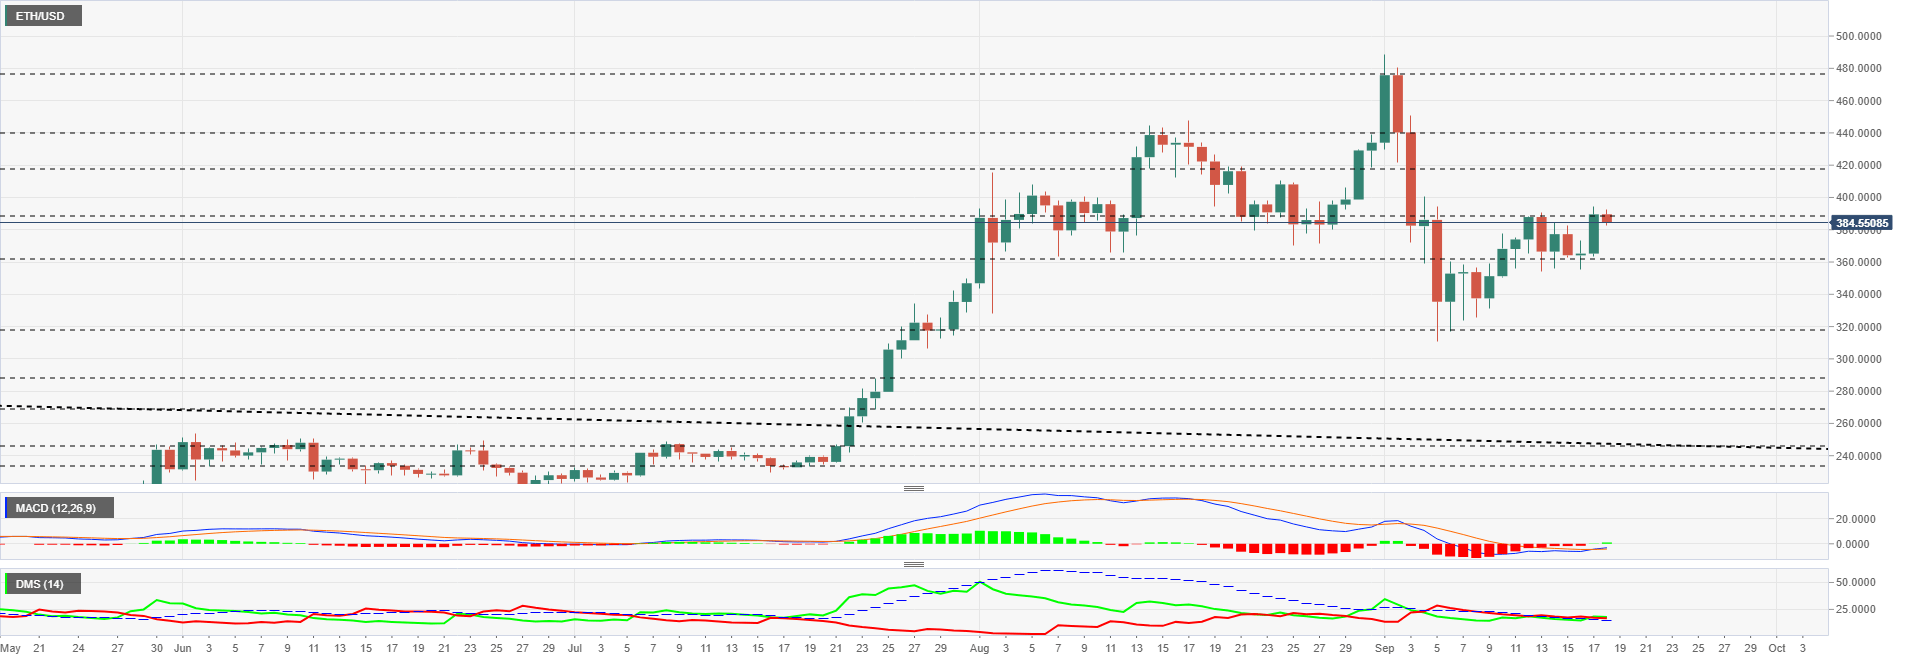
The MACD on the daily chart confirms the bullish cross, although limited by the presence of the neutral line on the indicator. Neither the slope of the moving averages nor their separation presents a suitable profile for a cross into the indicator's upward zone.
The DMI on the daily chart shows bears glued to bulls despite yesterday's rise. This unexpected position on the selling side should keep us on our toes for any sudden downward movements.
XRP/USD Daily Chart
The XRP/USD pair is currently trading at a price level of $0.2546 and has been rising for three consecutive days.
Above the current price, the first resistance level is at $0.255, then the second at $0.265 and the third one at $0.282.
Below the current price, the first support level is at $0.247, then the second at $0.241 and the third one at $0.235.
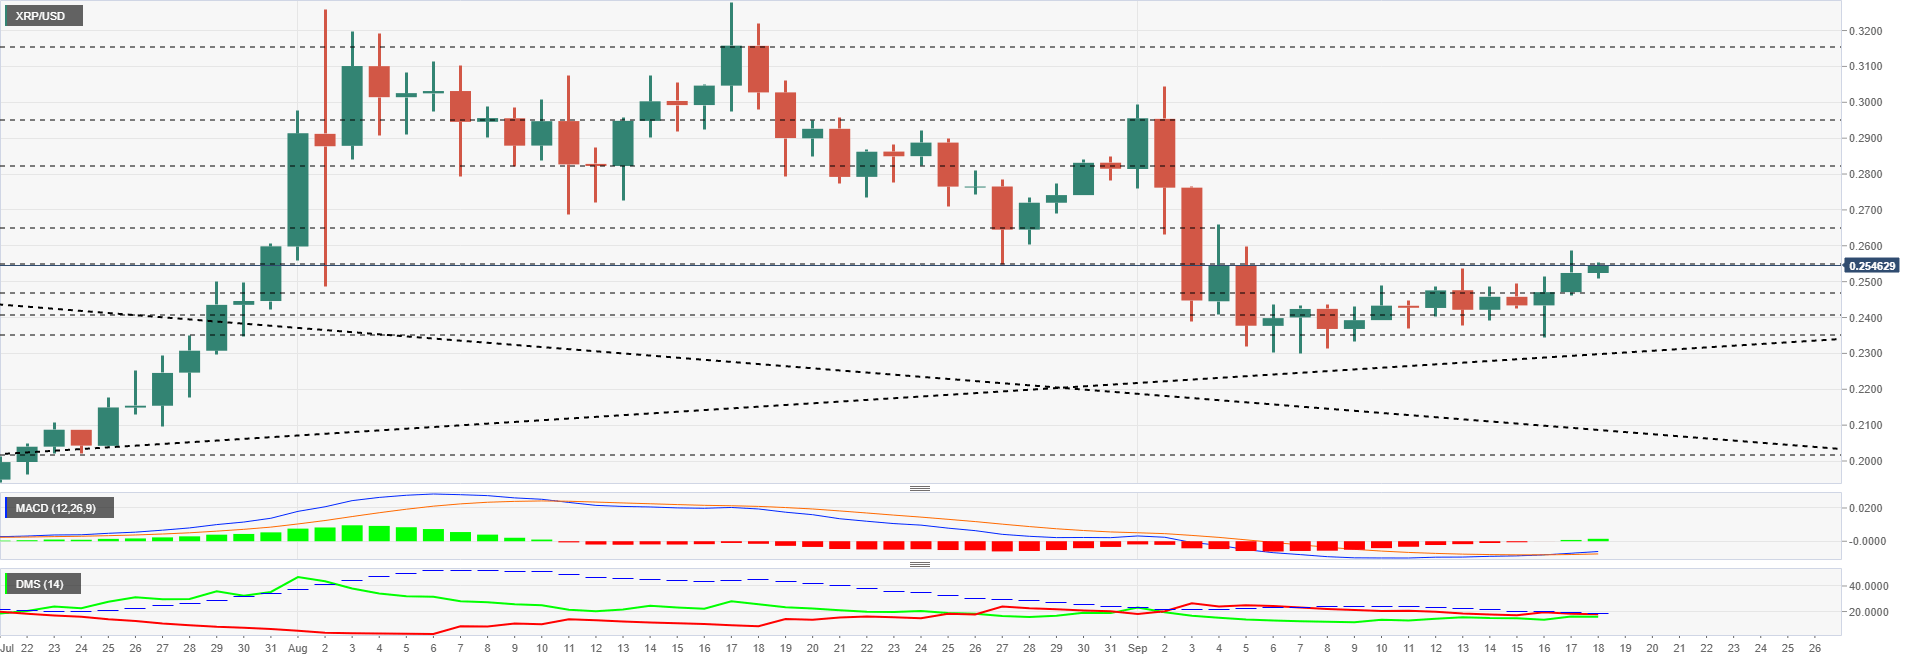
The MACD on the daily chart shows a full bullish cross, although it has no upward slope and there is also a little separation between the moving averages. The Ripple needs an increase in volatility to enable it to acquire more aggressive profiles.
The DMI on the daily chart shows bears leading the pair, a surprising factor considering the three consecutive rising sessions in the XRP/USD pair.
Author

Tomas Salles
FXStreet
Tomàs Sallés was born in Barcelona in 1972, he is a certified technical analyst after having completing specialized courses in Spain and Switzerland. He expanded his technical training following the guidance of great experts on the financial markets.


