Top 3 Price Prediction Bitcoin, Ethereum, Ripple: Decorrelation begins, but which crypto wins?
- Bitcoin price continues to coil in preparation for the next powerful movement.
- Ethereum price has pierced through the 200-Week Moving Average.
- Ripple price catches traders off guard blasting through key resistance levels.

The crypto market begins to show market divergence between the top moving assets.
Bitcoin price has yet to decide
Bitcoin currently coils in sideways fashion, lagging behind the Ethereum and Ripple, who have already begun ascending. This scenario prompts caution. Will Bitcoin consolidate below the 200-week moving average at the current price of $21,200 and enable a mini crypto trading season in the process? Or will Bitcoin plummet and wipe early Altcoin buyers out of the market.
Bitcoin still needs to invalidate the downtrend by breaching above $31,000, a long trajectory away from Friday's $21,200 market value. A breach below $19,728 could be the catalyst to plummet the BTC price to $16800.
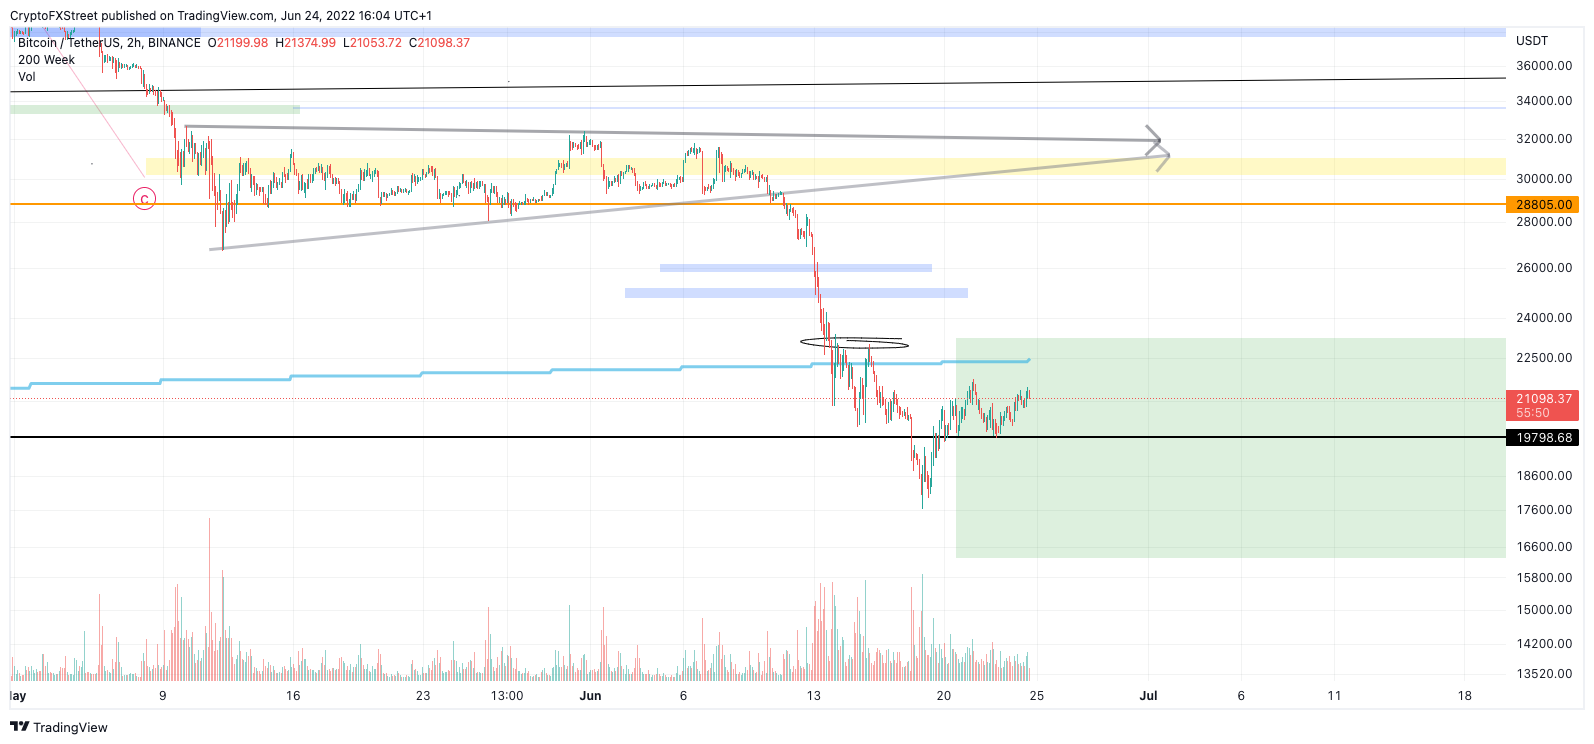
BTC/USDT 2-Hour Chart
Ethereum price moves ahead
Ethereum price has begun decorrelating from the Bitcoin price action. On Friday, June 24, the ETH price breached the 200 Week Moving Average. A piercing bullish engulfing candle established on the 2-hour chart now supports the ETH price back above $1200.
Ethereum price does show an interesting volume pattern as there is a subtle turning in favor of the bulls. If market conditions are genuine, the Ethereum price should have no problem tackling $1420 and possibly $1535 in the short term.
Invalidation of the bullish thesis is the June 18 low at $881.50.Traders should beware that Bitcoin has yet to move through the 200-week moving average, which exponentializes the potential for a losing trade setup. If $881 were to get breached, the Ethereum price could fall back to $750, resulting in a 37% decrease from the current ETH Price.
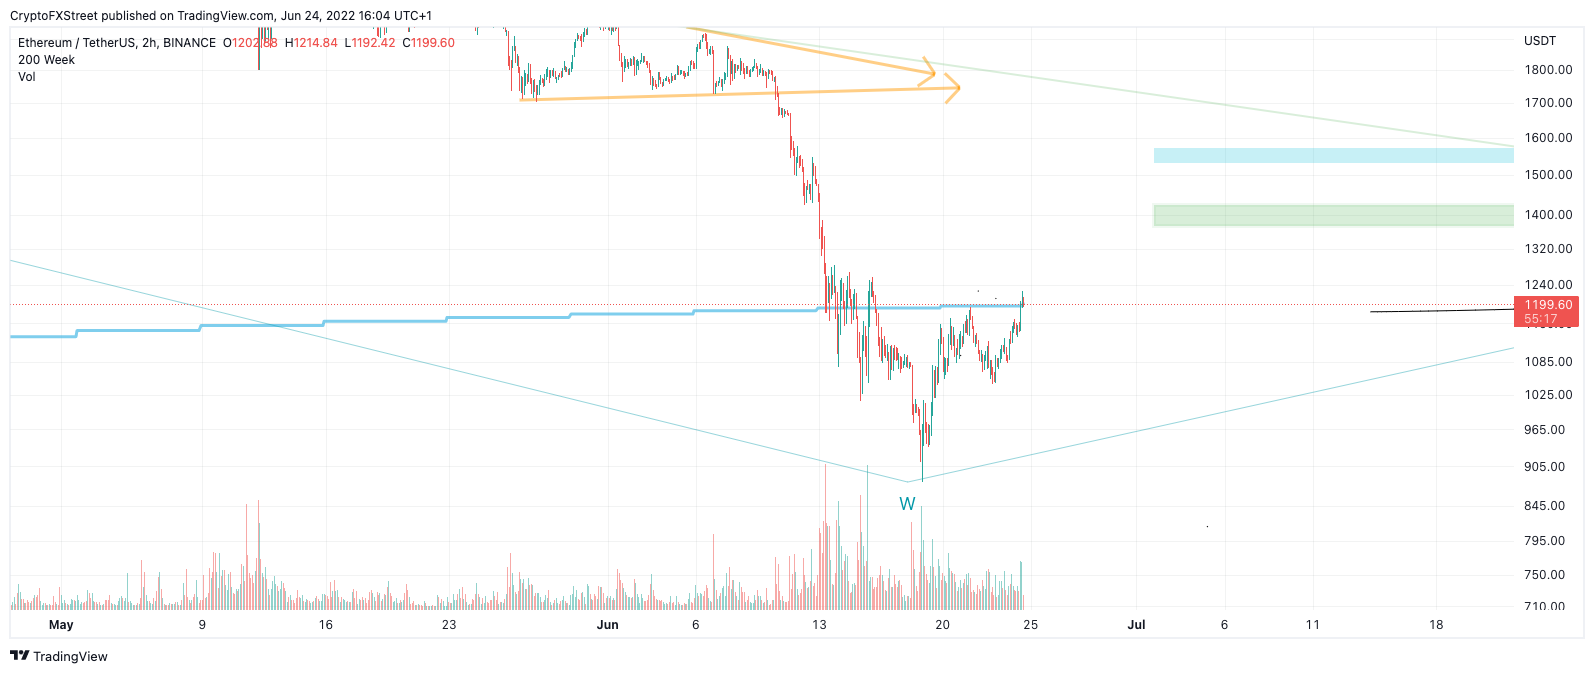
ETH/USDT 2-Hour Chart
Ripple leads the race
Ripple's XRP price has surprised sleeping bulls as the digital remittance token has risen 16% in just a few short hours. The bullish surge comes just two days after Ripple announces plans to hire 100 new employees to bring forth the next phase of their blockchain solutions.
Ripple price currently trades at $0.365 within a previous support level dating back to the May 11 sell-off. If the bull run is genuine, Ripple should hurdle the triangle apex at $0.395 and cross back into the 40-cent price levels. A pullback should commence somewhere in the mid $0.40 zone and provide an excellent entry for bullish traders, placing a stop loss below the June 19 lows at $0.298.
However, the other scenario could be a sharp drop into new lows, as the current rally could be a zigzag correction. A safe bearish invalidation point is the top of wave four at $0.4650. If 0.465 gets breached, long-term counts towards $1.20 and higher will be back on the cards with confidence resulting in a 237% increase from the current Ripple price.
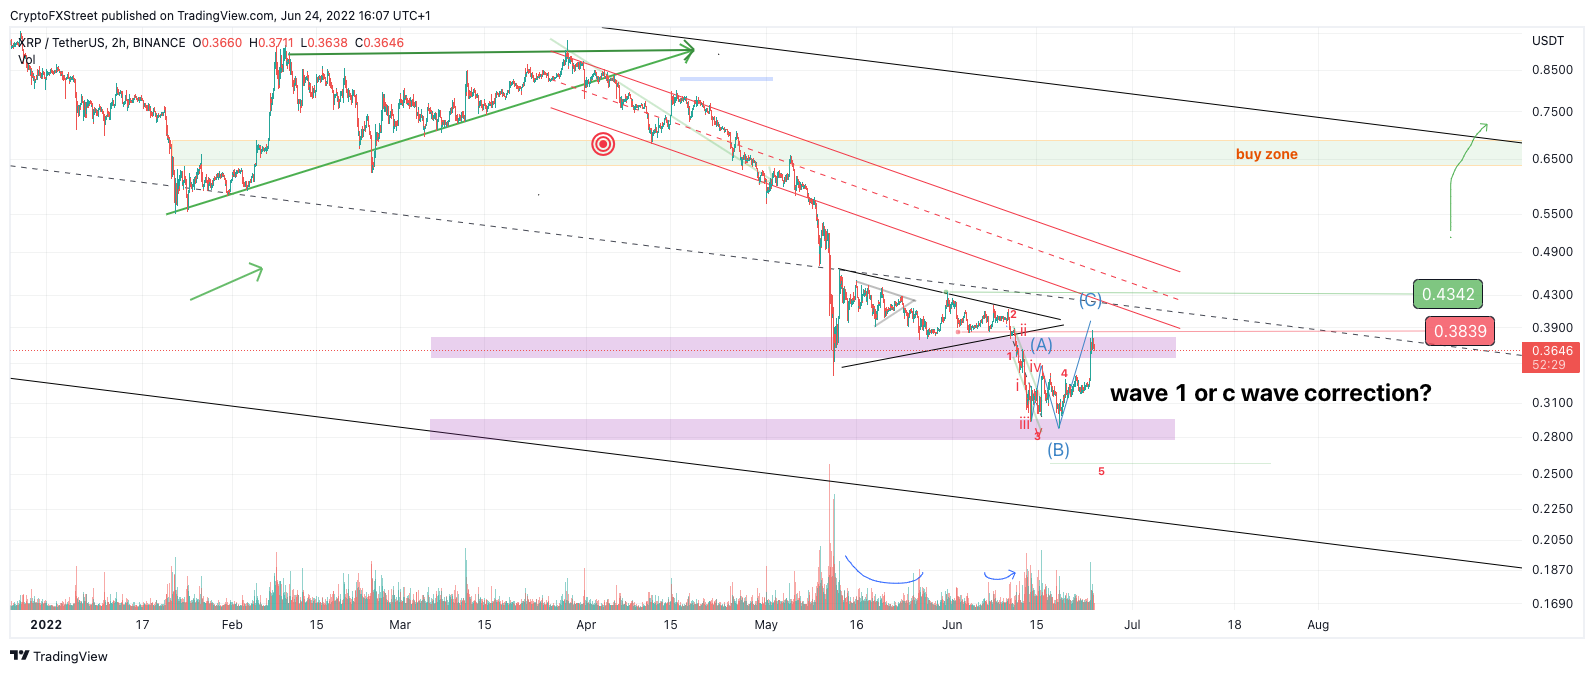
XRP/USDT 2-Hour Chart
Author

Tony M.
FXStreet Contributor
Tony Montpeirous began investing in cryptocurrencies in 2017. His trading style incorporates Elliot Wave, Auction Market Theory, Fibonacci and price action as the cornerstone of his technical analysis.


