Top 3 Price Prediction Bitcoin, Ethereum, Ripple: Cryptos look bearish but one might rebound
- Bitcoin prices are in the process of breaking below $59,586, fading further away from $60,000.
- Ethereum price sees bulls defending $4,060 and shows signs of further bullish action.
- XRP price sees bulls recovering ground against the bulls, overtaking strategic support levels to the upside.

Bitcoin price remains under pressure and looks depressed as BTC price action is fading away from the $60,000 marker even further. When bears can consolidate below $59,586, expect another 10% devaluation of BTC price. Ethereum price has undergone a similar correction as Bitcoin but saw bulls stepping in at $4,060 and already shows further recovery to the upside. Finally, XRP price looked to break and spiral into an extensive price correction. But XRP saw its buy-side volume pickup, and bulls are regaining control of two key-support levels and could see a 13% uptick in the coming days if bulls keep the momentum going.
Bitcoin price still rattled as bears try to reverse a large portion of the uptrend
Bitcoin (BTC) price is under siege by bears that are squeezing price action against $59,586. That level has held importance since April 13 and has seen price respecting it in both upside and downside moves. Bitcoin bears have already broken down below this level twice before, but bulls rushed in each time to defend. With the Relative Strength Index (RSI) pushing further downwards, expect bulls to quickly forfeit any attempts of defending the level again, which opens the doors for bears to further downside moves.
BTC price could see some intermediary support from the 55-day Simple Moving Average (SMA) at $58,000 and the monthly pivot at $57,300. These levels will instead slow down the nosedive but will not be strong enough to halt the devaluation. This is simply because no actual historical levels could help strengthen the conviction that one of these levels could hold some importance.
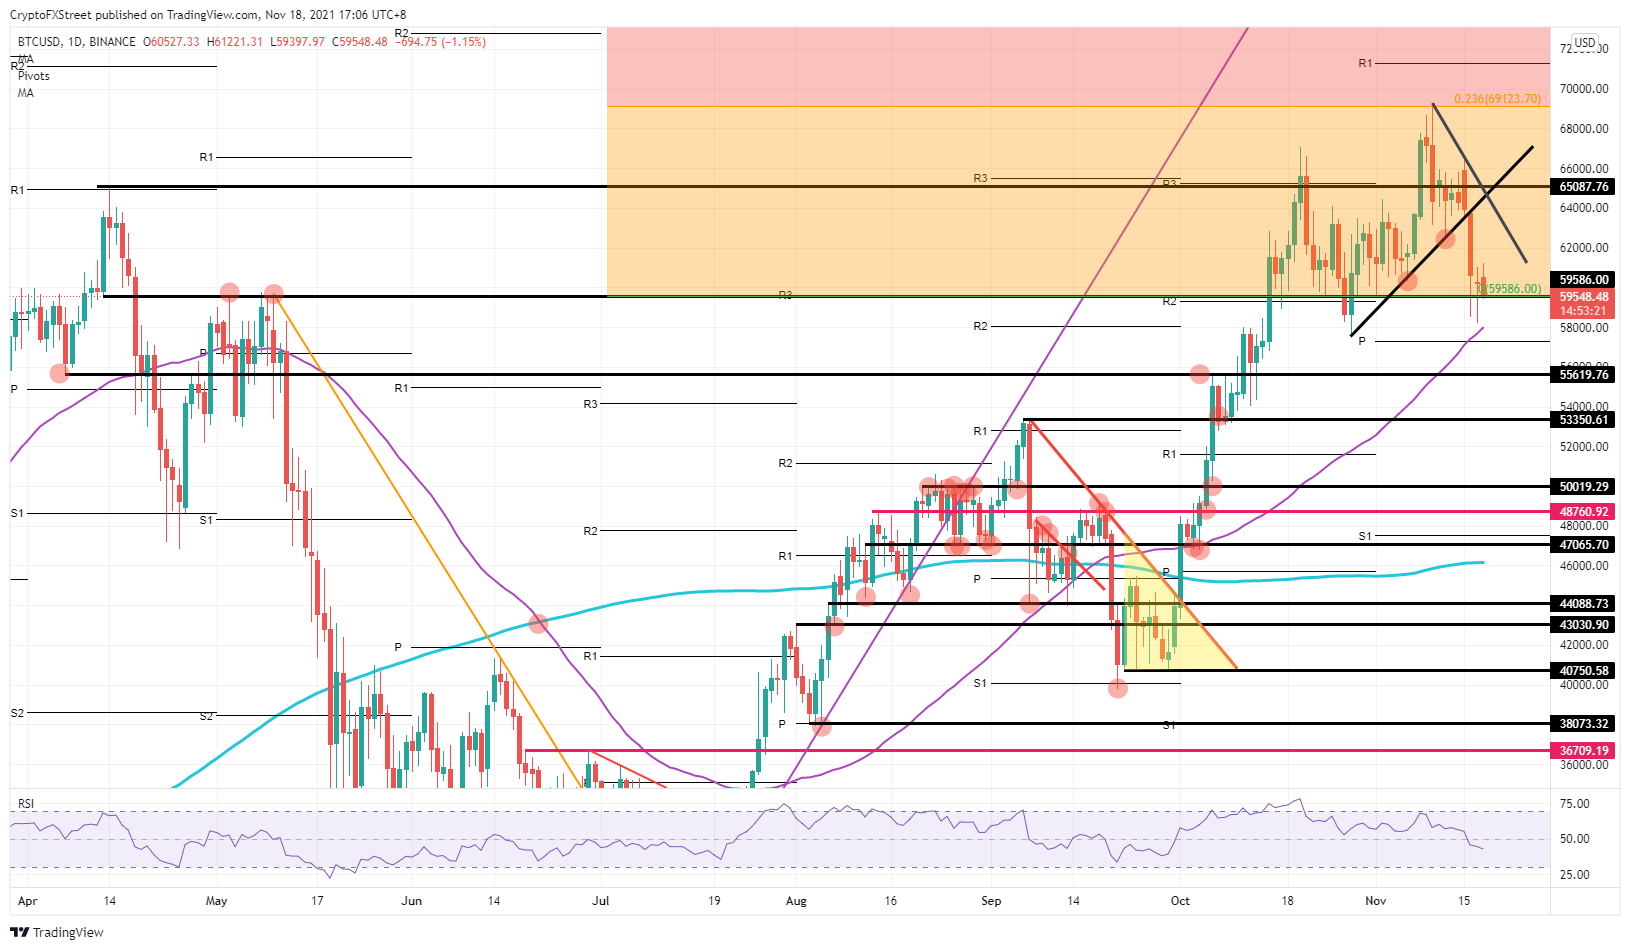
BTC/USD daily chart
Expect the break of $59,586 to lead to an acceleration lower as bulls step out of the way and accept defeat.. BTC price will then probably see another 6% devaluation towards historical support at $55,619 and slow down at the 55-day SMA and the monthly pivot, triggering some profit-taking among bears along the way. Expect bulls to stand pat at $53,350 which has proven to be more solid in the past from tests, breaks and rebounds during BTC price’s uptrend.
Ethereum price sees bullish bounce and could see ETH price pare back losses
Ethereum (ETH) price saw bulls stepping in and delivering a strong signal that they would not go down without a fight at $4,060. The break of the green ascending trend line saw a downward spiraling correction quickly unwind towards $4,060, but bulls rapidly moved back in to pick up the correction and buy ETH coins at a discount. With that rebound, buyers formed bullish hammer candle formations on Wednesday.
ETH price saw the bullish signal reflected in the Relative Strength Index (RSI) that showed a nudge to the upside in what looked to be a steep decline towards the oversold zone. Do not expect price action to quickly return to $4,646 today, but rather see bears fretting about breaking below $4,060. They may end up getting matched by bulls each time, which would make them fatigued from trying to break lower. The knee-jerk reaction on Wednesday will have washed quite a lot of bearish volume out of the downward correction.
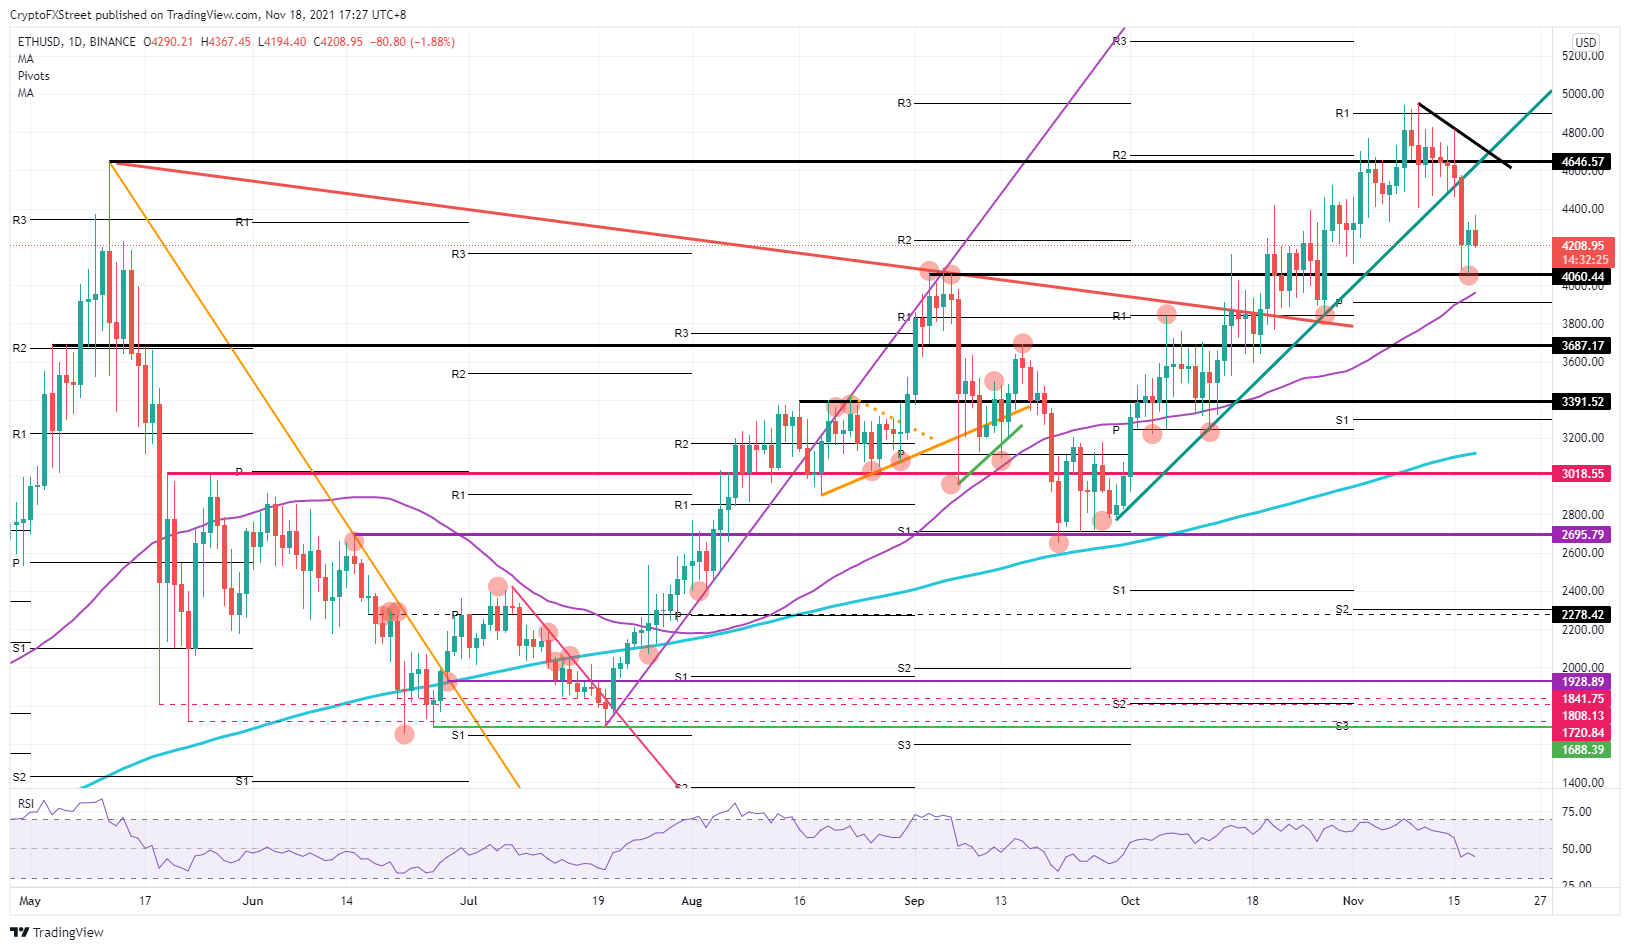
ETH/USD daily chart
Expect bulls to be under pressure from the current headwinds overall present in cryptocurrencies at the moment. As long as bulls can withstand, expect a quicker uptick back towards $4,646 and a possible pop back above the black and green trend lines to the upside, that would reinstate the dormant uptrend. On the downside, the monthly pivot and the 55-day SMA are important levels to consider just below $4,000.
XRP price saw bulls almost paring back incurred losses, bears remain persistent for now
Ripple (XRP) price has seen bulls entering positions at $1.04 and quickly consolidating back above that level the following day. With that move, bears that entered on the break below got stuck in a bear trap. Expect the further uptick from today to have hurt quite some bears and see some loss taking occurring throughout the day, as long as the current headwinds do not start to weigh any further as they are already doing.
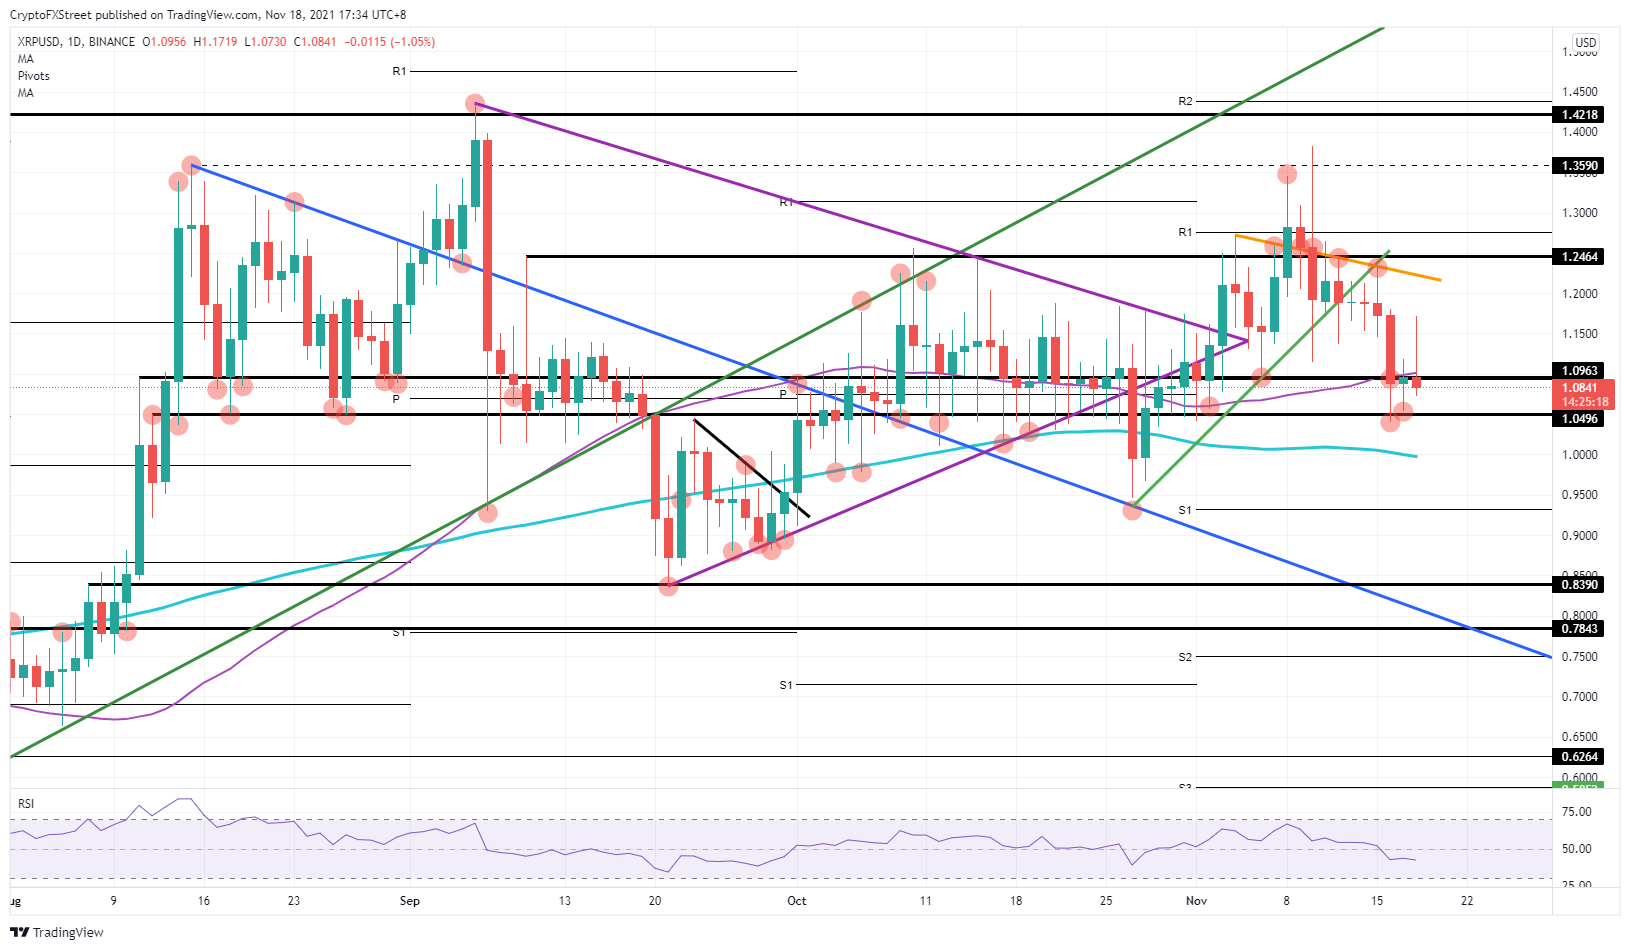
XRP/USD daily chart
XRP price will need to see bulls close above $1.09 today to keep the momentum and buy-side pickup going. The flat Relative Strength Index (RSI) proves that both buyers and sellers are going against each other, and both want to have it their own way. Should bulls fail to close above $1.09, expect a retest of $1.04 and see price drift lower towards $1.0, which will act as a psychological level. The 200-day SMA is a very supporting element that could quickly see a similar reversal to the upside like we saw earlier today.
Author

Filip Lagaart
FXStreet
Filip Lagaart is a former sales/trader with over 15 years of financial markets expertise under its belt.


