Top 3 Price Prediction Bitcoin, Ethereum, Ripple: Crypto markets might pause before the uptrend catches traction
- Bitcoin price swept the liquidity resting above $49,527 and edged closer to retesting the $50,000 psychological level.
- Ethereum price could see a brief correction to solidify its breakout from the falling wedge pattern.
- Ripple price remains strong as it sets up a higher high, indicating a retest of $1 is likely.

Bitcoin price is hovering around a crucial level after collecting liquidity above it. This development over the past 48 hours indicates that BTC will consolidate here before continuing its ascent. Ethereum and Ripple follow the pioneer crypto closely and show promise of gains soon.
Bitcoin price faces a decisive moment
Bitcoin price sliced through Monday’s high at $47,565 and collected the liquidity resting above $49,527. While BTC might head higher and retest the $50,000 psychological level, investors need to pay attention to the possibility that the big crypto might slide lower and sweep Monday’s low at $45,550.
If buyers resist booking profits, there is a high chance BTC will retest $50,00 and make a run for last week’s high at $50,0835. In some cases, Bitcoin price might extend to the $53,618 resistance level. In total, this run-up would constitute an 8.6% ascent.
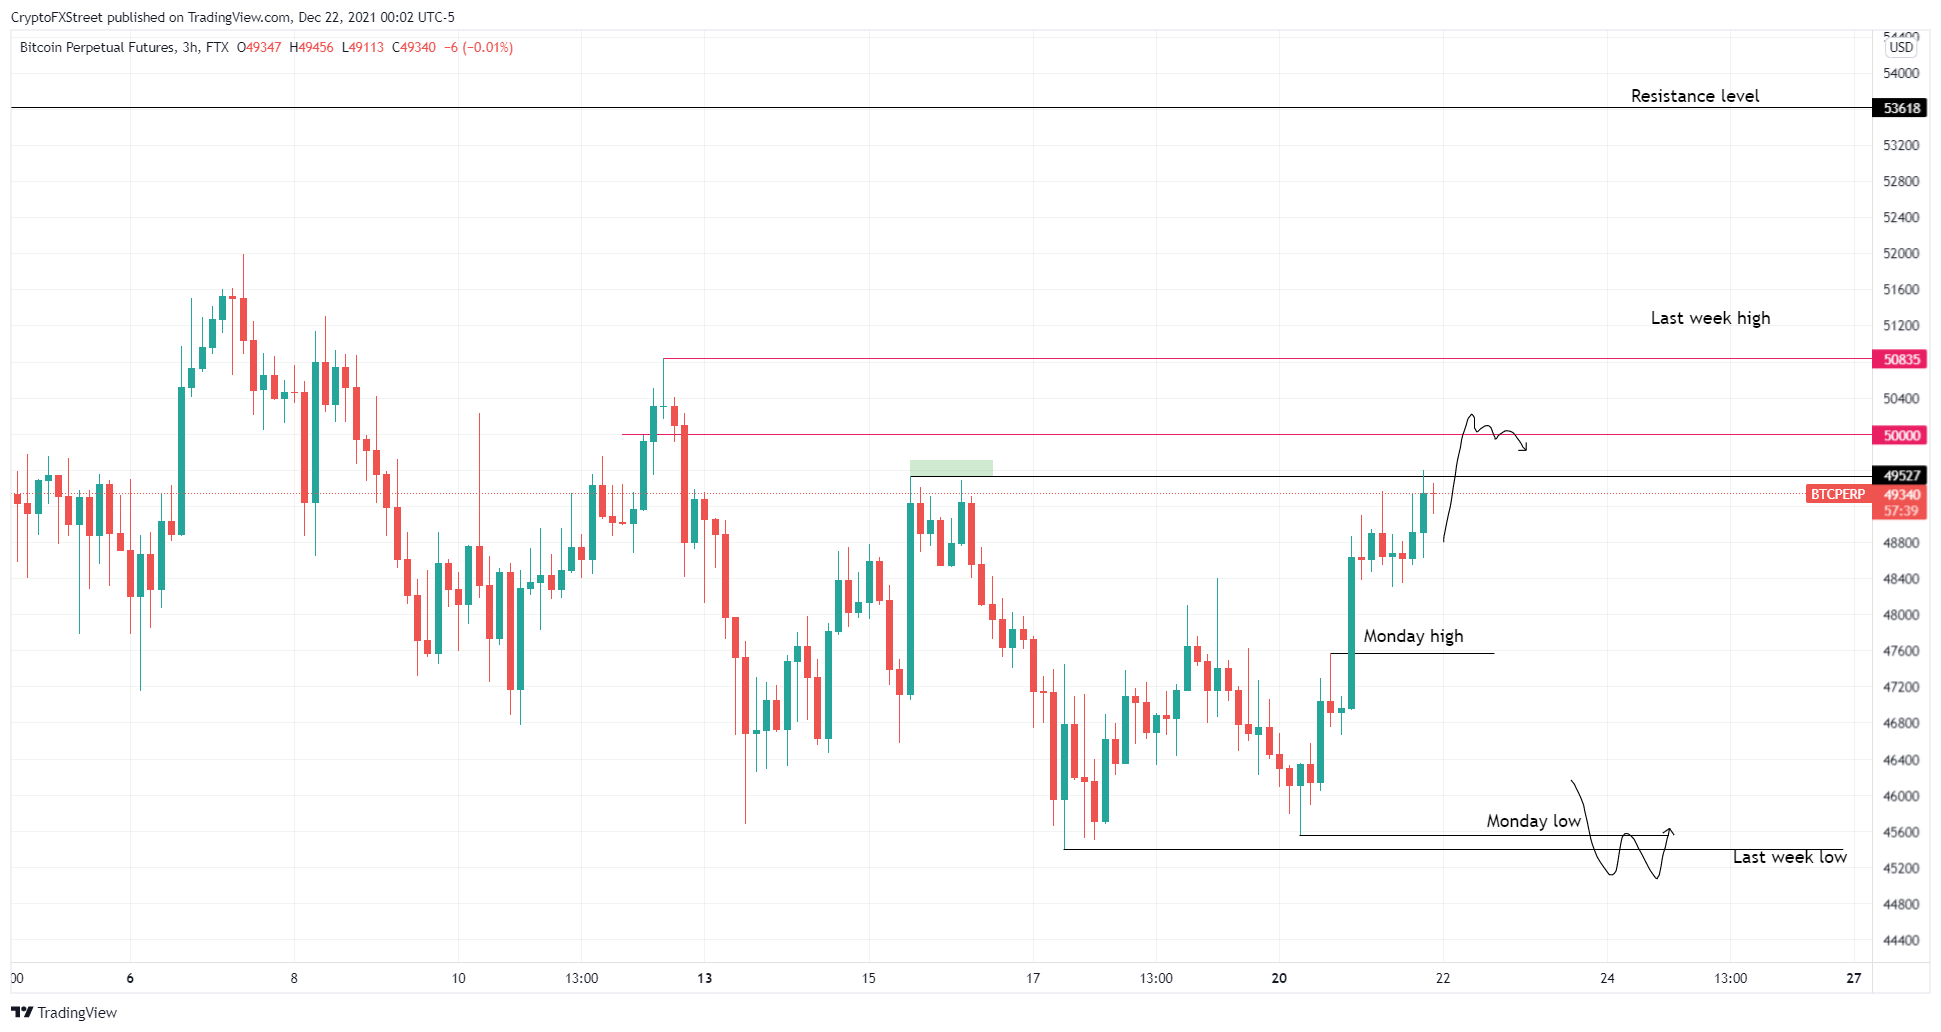
BTC/USD 3-hour chart
Increased profit-taking from holders could undo the gains seen over the past 48 hours. This development could knock BTC down to Monday’s lows at $45,550 or sweep last week’s lows at $45,438.
Ethereum price needs to solidify its stance
Ethereum price action since November 28 set up a falling wedge pattern. This setup is obtained by connecting the three lower lows and four lower highs formed during this period using trend lines.
The technical formation forecasts a 16% upswing, obtained by adding the distance between the first swing high and swing low to the breakout point at $3,912, which puts ETH at $4,533.
So far, ETH has broken out of this pattern and crawled closer to retest the $4,155 resistance barrier. Initially, however, investors can expect a retracement to $3,912 or the 62% retracement level at $3,823.
A bounce from these barriers will solidify the breakout and indicate that a 16% ascent to $4,535 is likely.
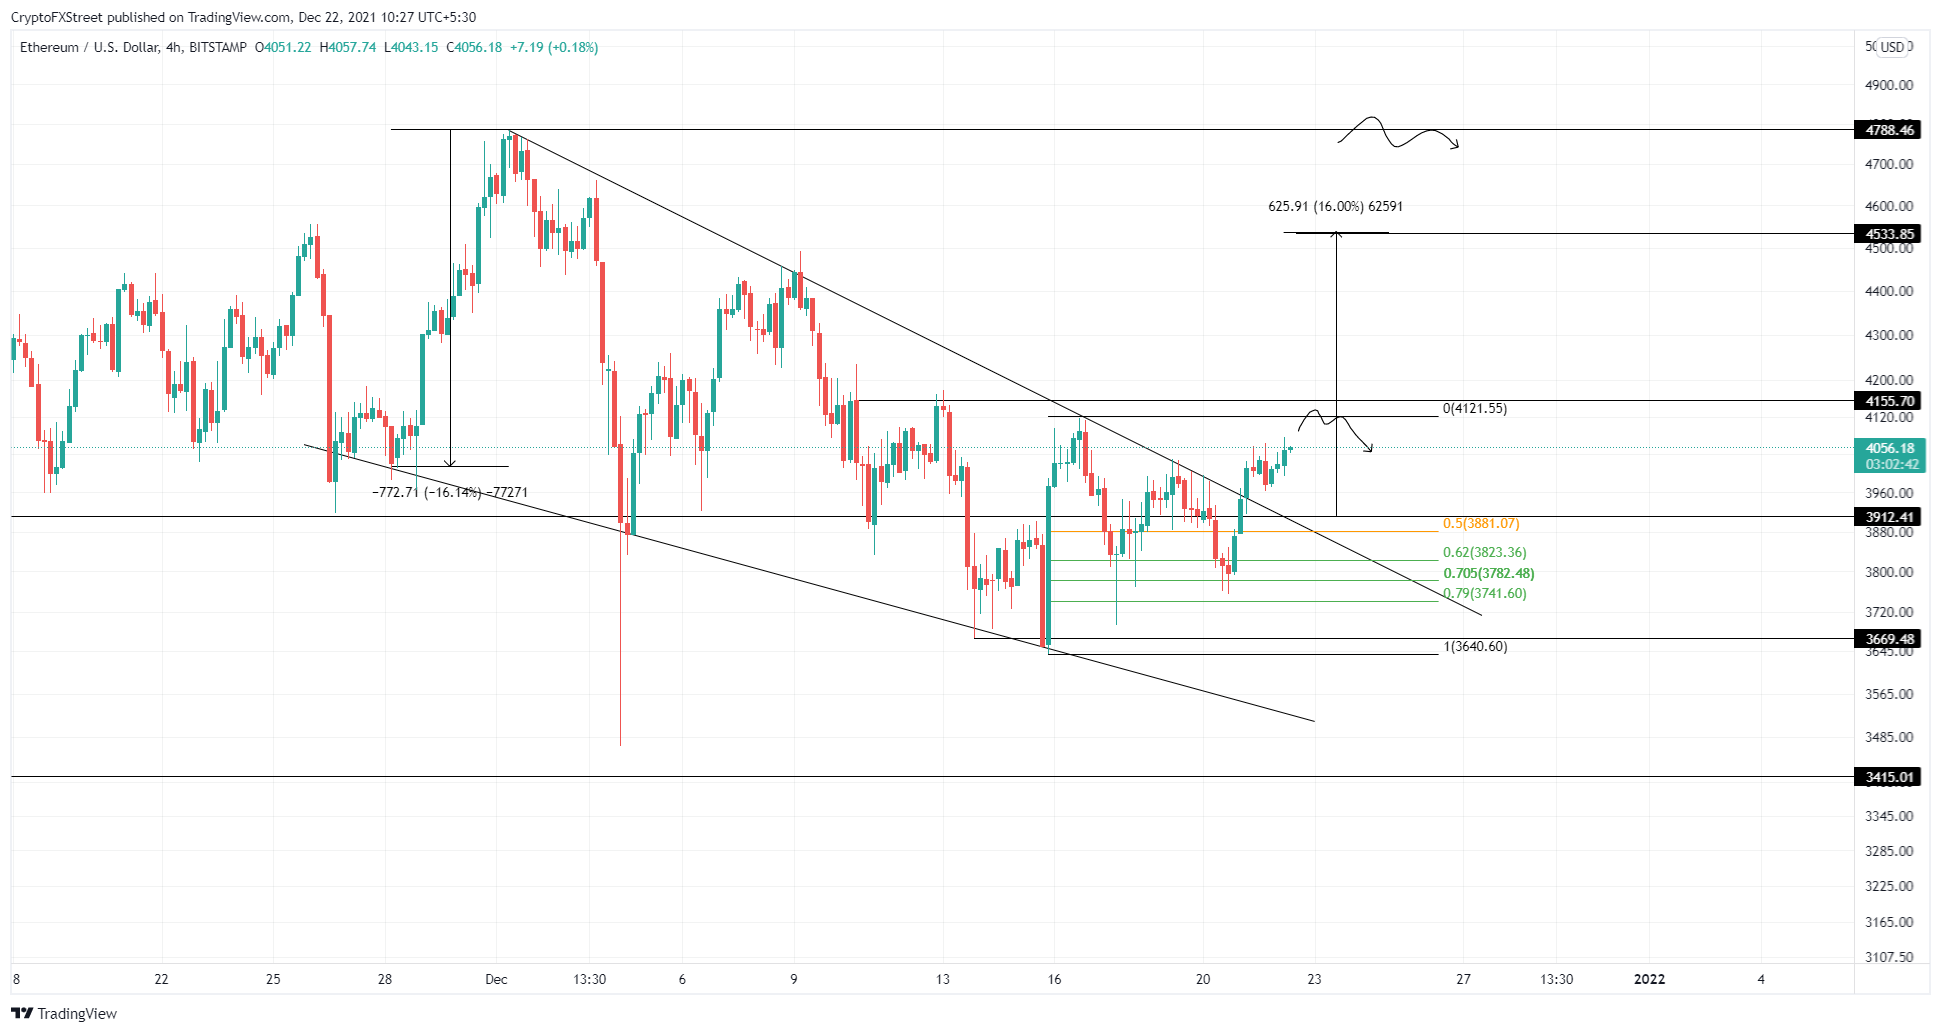
ETH/USD 4-hour chart
Regardless of the bullish pattern, if Ethereum price produces a lower low below $3,669, coinciding with the low of the trading range, it will invalidate the bullish thesis. In this case, ETH could revisit the $3,415 support floor.
Ripple price remains strong
Ripple price pierced through the declining trend line on December 18 and has rallied 19% to set up a swing high at $0.971. This run-up, while impressive, could extend to retest the $1.015 resistance level.
In a bullish case, the XRP price could tag the $1.102 hurdle and collect the liquidity resting above it. However, it is unlikely that the remittance token will continue this ascent, especially since BTC might undergo a minor retracement.
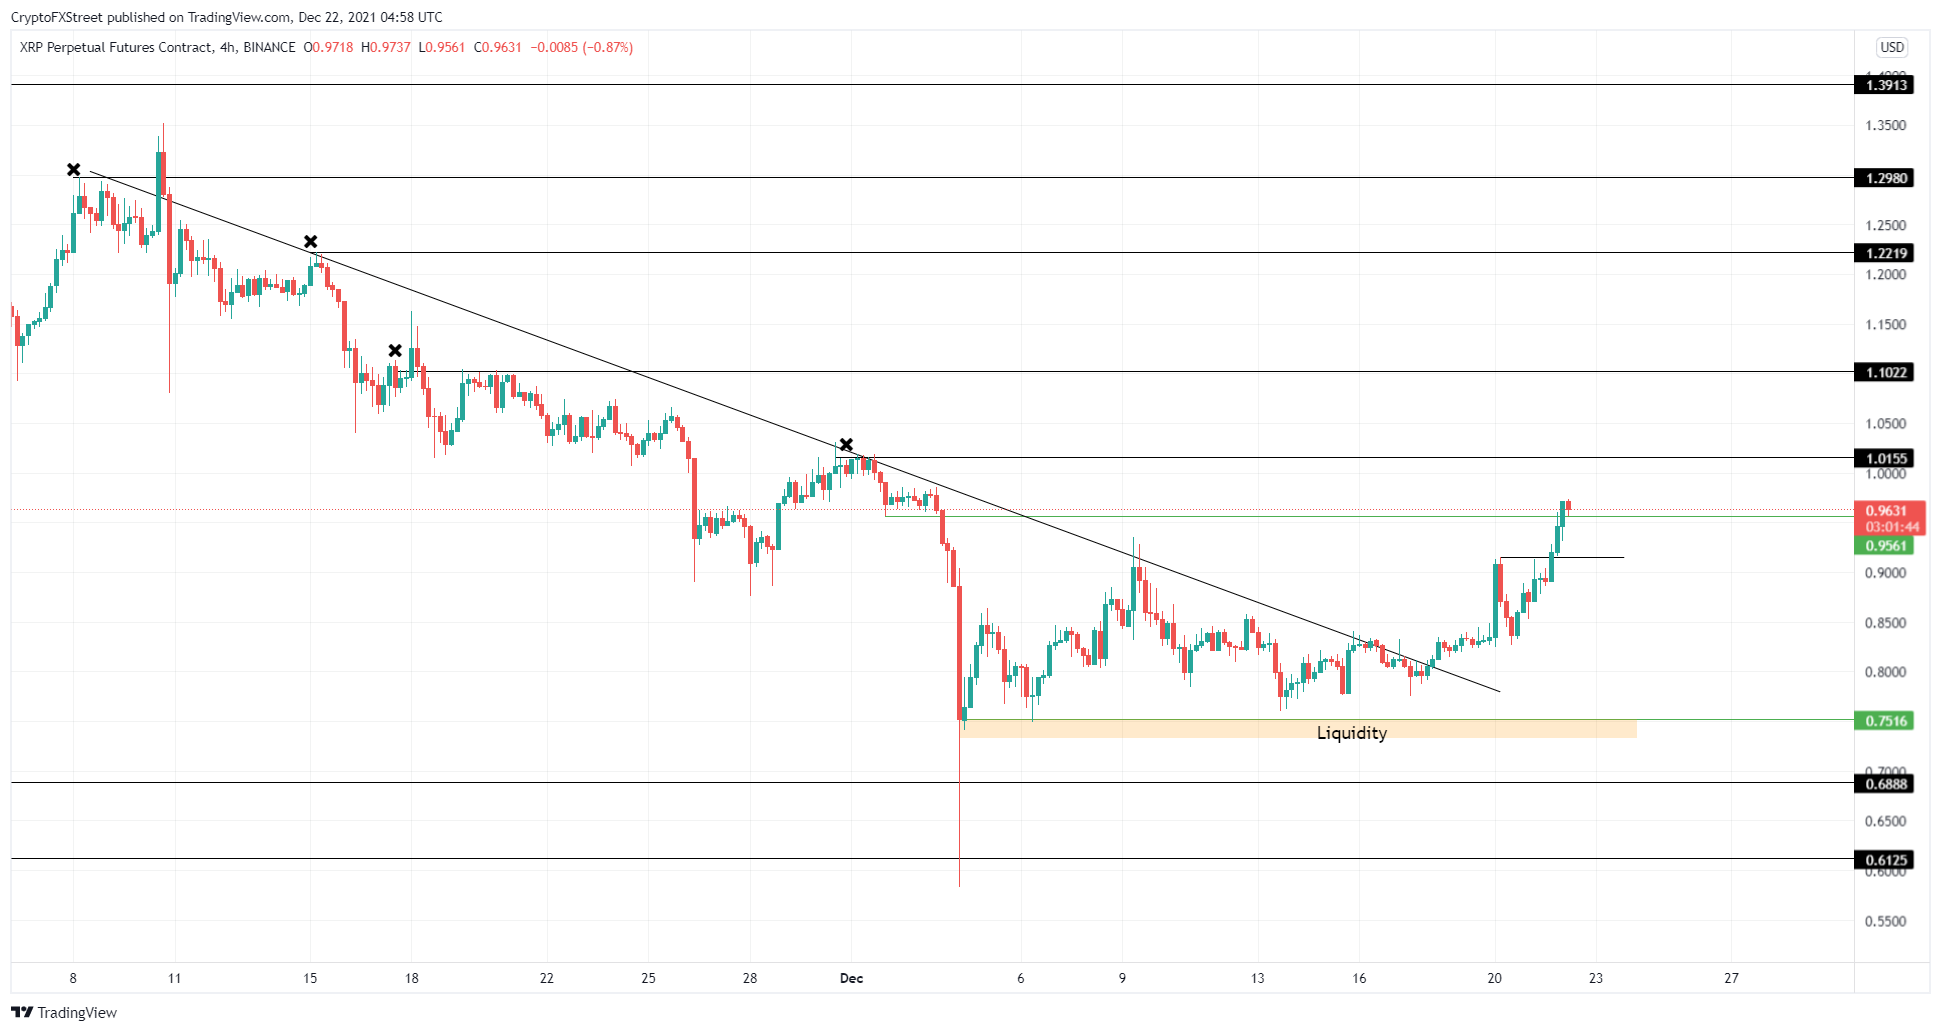
XRP/USD 4-hour chart
Due to the correlation between the two, XRP price might follow the big crypto and undergo a correction. Moreover, the 19% ascent seen so far has collected the liquidity in its immediate vicinity and is likely to undergo a minor retracement.
If this downswing pushes Ripple price below $0.688, it will create a lower low, invalidating the bullish thesis.
Author

Akash Girimath
FXStreet
Akash Girimath is a Mechanical Engineer interested in the chaos of the financial markets. Trying to make sense of this convoluted yet fascinating space, he switched his engineering job to become a crypto reporter and analyst.


