Top 3 Price Prediction Bitcoin, Ethereum, Ripple: Crypto markets in limbo without BTC’s discernible clues
- Bitcoin price faces rejection at $25,200, which is the confluence of multiple resistance levels.
- Ethereum price follows the big crypto’s short-term outlook and has slid 4.00% in the last 24 hours.
- Ripple price faces a massive sell-off after attempting to overcome the $0.400 hurdle.

Bitcoin price shows a lack of bullish momentum as it approaches a key confluence that is prominent on multiple timeframes. The influence of BTC can clearly be seen on Ethereum, Ripple and other altcoins, which are in limbo.
Bitcoin price goes the other way around
Bitcoin price consolidation in the form of an ascending triangle ended as BTC breached the triangle’s base on February 21. Since then, BTC has shed 1.50% and is yet to formalize the second four-hour candlestick close below it.
If this trend continues, and it most likely will, Bitcoin price could revisit the daily support level at roughly $22,800. If the sellers continue to have their way despite this retracement, BTC might revisit the twelve-hour and four-hour support confluence level at roughly $21,000.
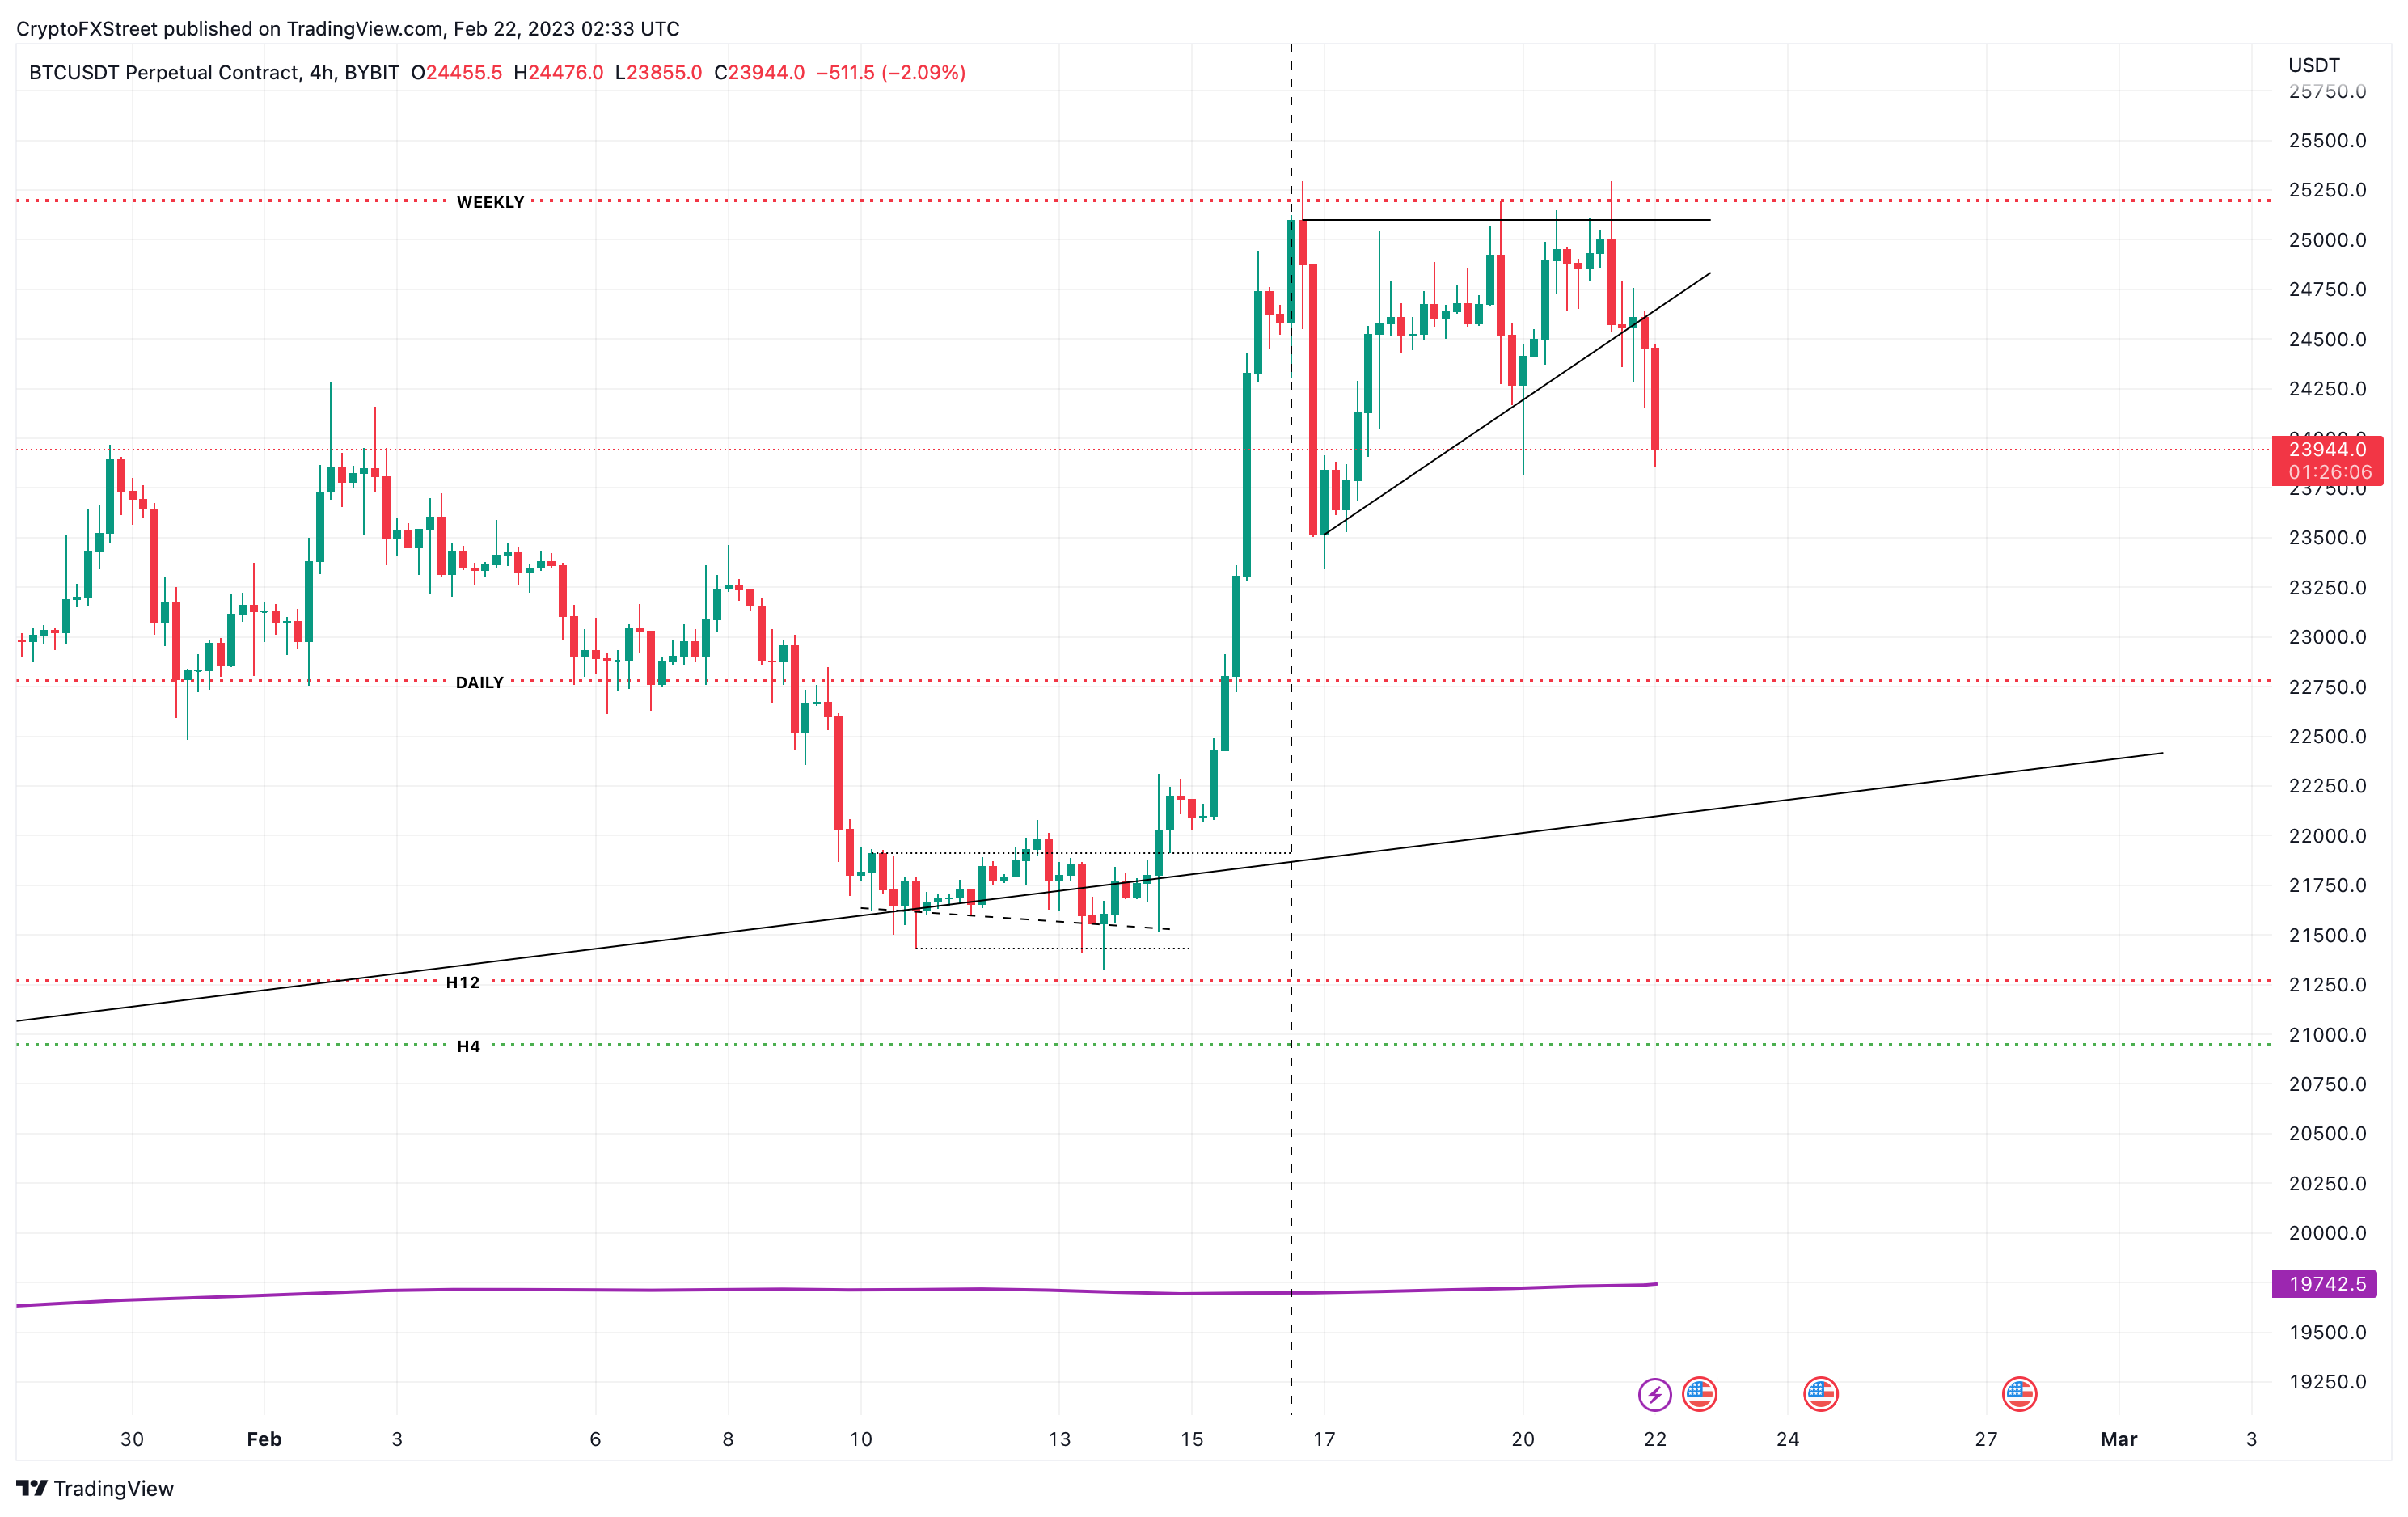
BTC/USD 4-hour chart
On the other hand, if Bitcoin price flips the $25,200 hurdle into a support level on higher time frames, like the daily or weekly, it will invalidate the bearish thesis. Such a development could trigger a surge in buying activity and propel BTC to $30,000 or higher.
Ethereum price fails to follow through
Ethereum price showed a bullish pennant up to February 20. But the selling pressure on February 21 invalidated this thesis as ETH produced a four-hour candlestick close below the pennant.
As a result of the ongoing order flow, which is largely bearish, things are on the fence for ETH since it shadows BTC. Due to the presence of inefficiencies to the downside, investors should expect Ethereum price to slide as low as $1,554 in the coming days.
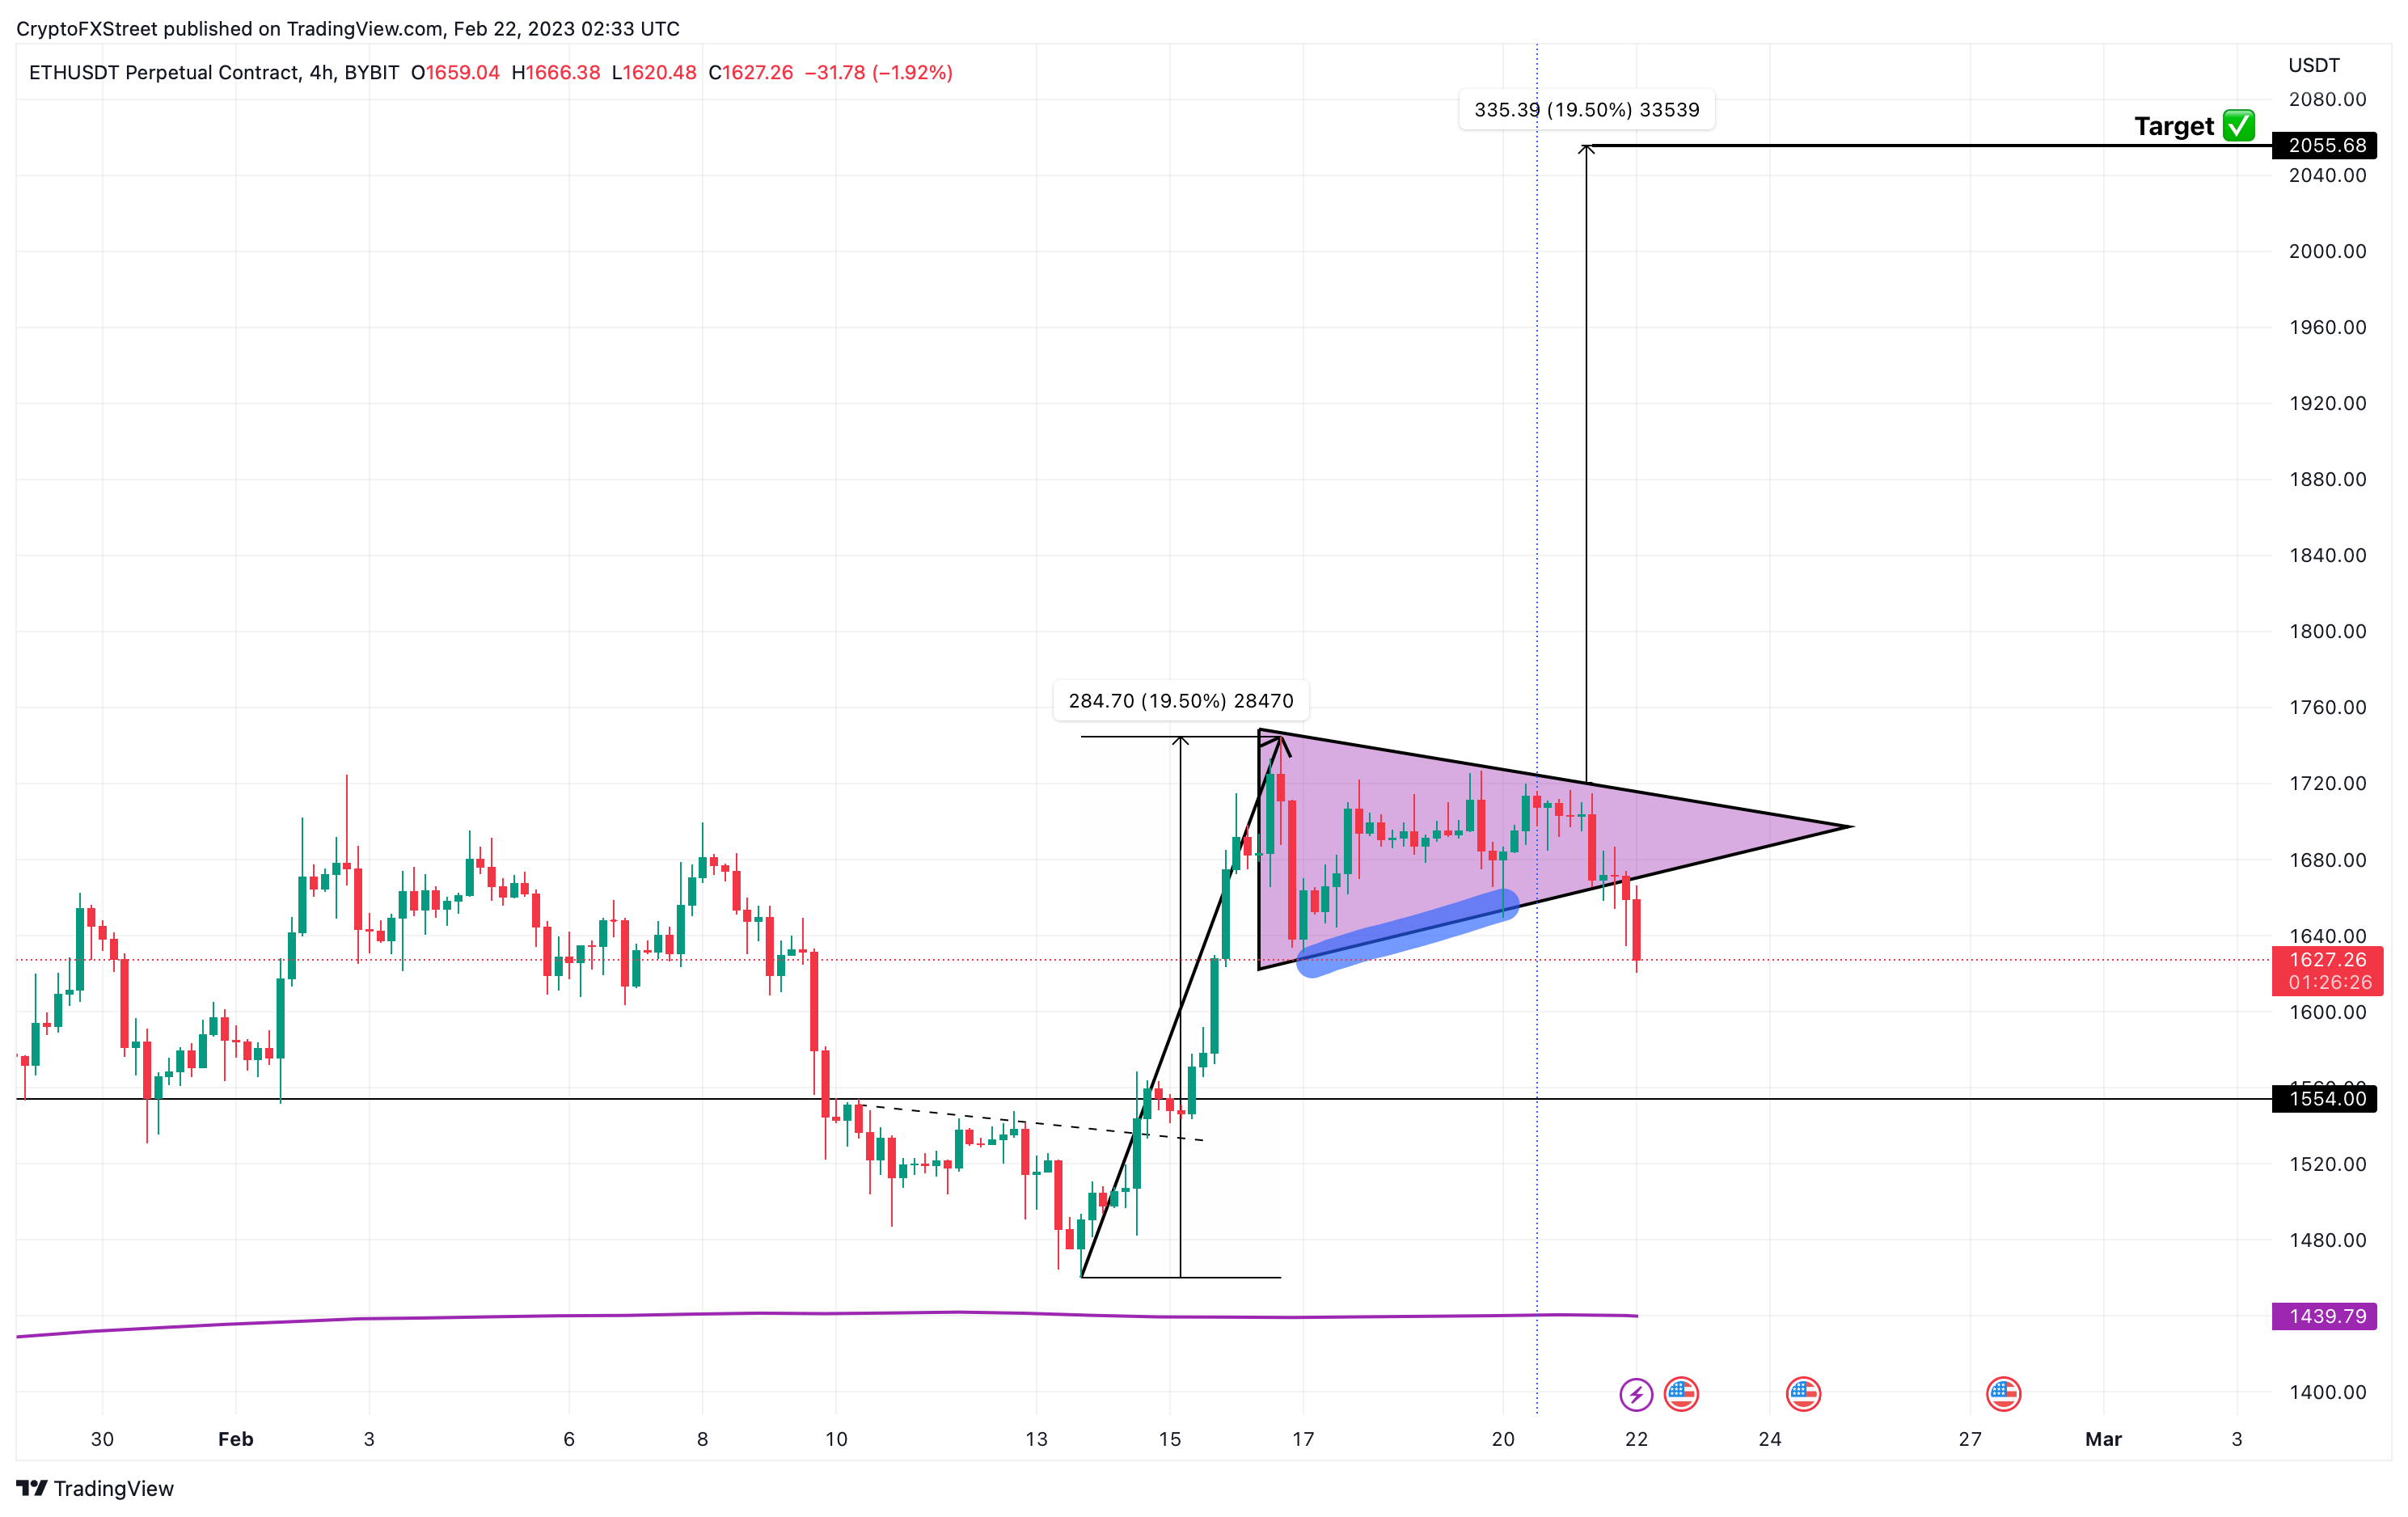
ETH/USD 4-hour chart
While the bearish outlook for Ethereum price makes sense, a sudden spike in buying pressure that produces a higher high above $1,750 would invalidate the bearish thesis. In such a case, ETH could attempt an uptrend to tag the $2,000 psychological level.
Ripple price attempts to escape, but fails again
Ripple price produced a decisive daily candlestick close below the $0.400 support level on February 5. This move flipped the barrier into a resistance level and XRP bulls have been struggling ever since.
The most recent attempt to flip this hurdle was on February 20, which ended up a failure. As a result, XRP price slid 3.59% since yesterday’s daily candlestick open. Going forward, Ripple price could revisit the $0.367 support level if the sellers continue to run free.
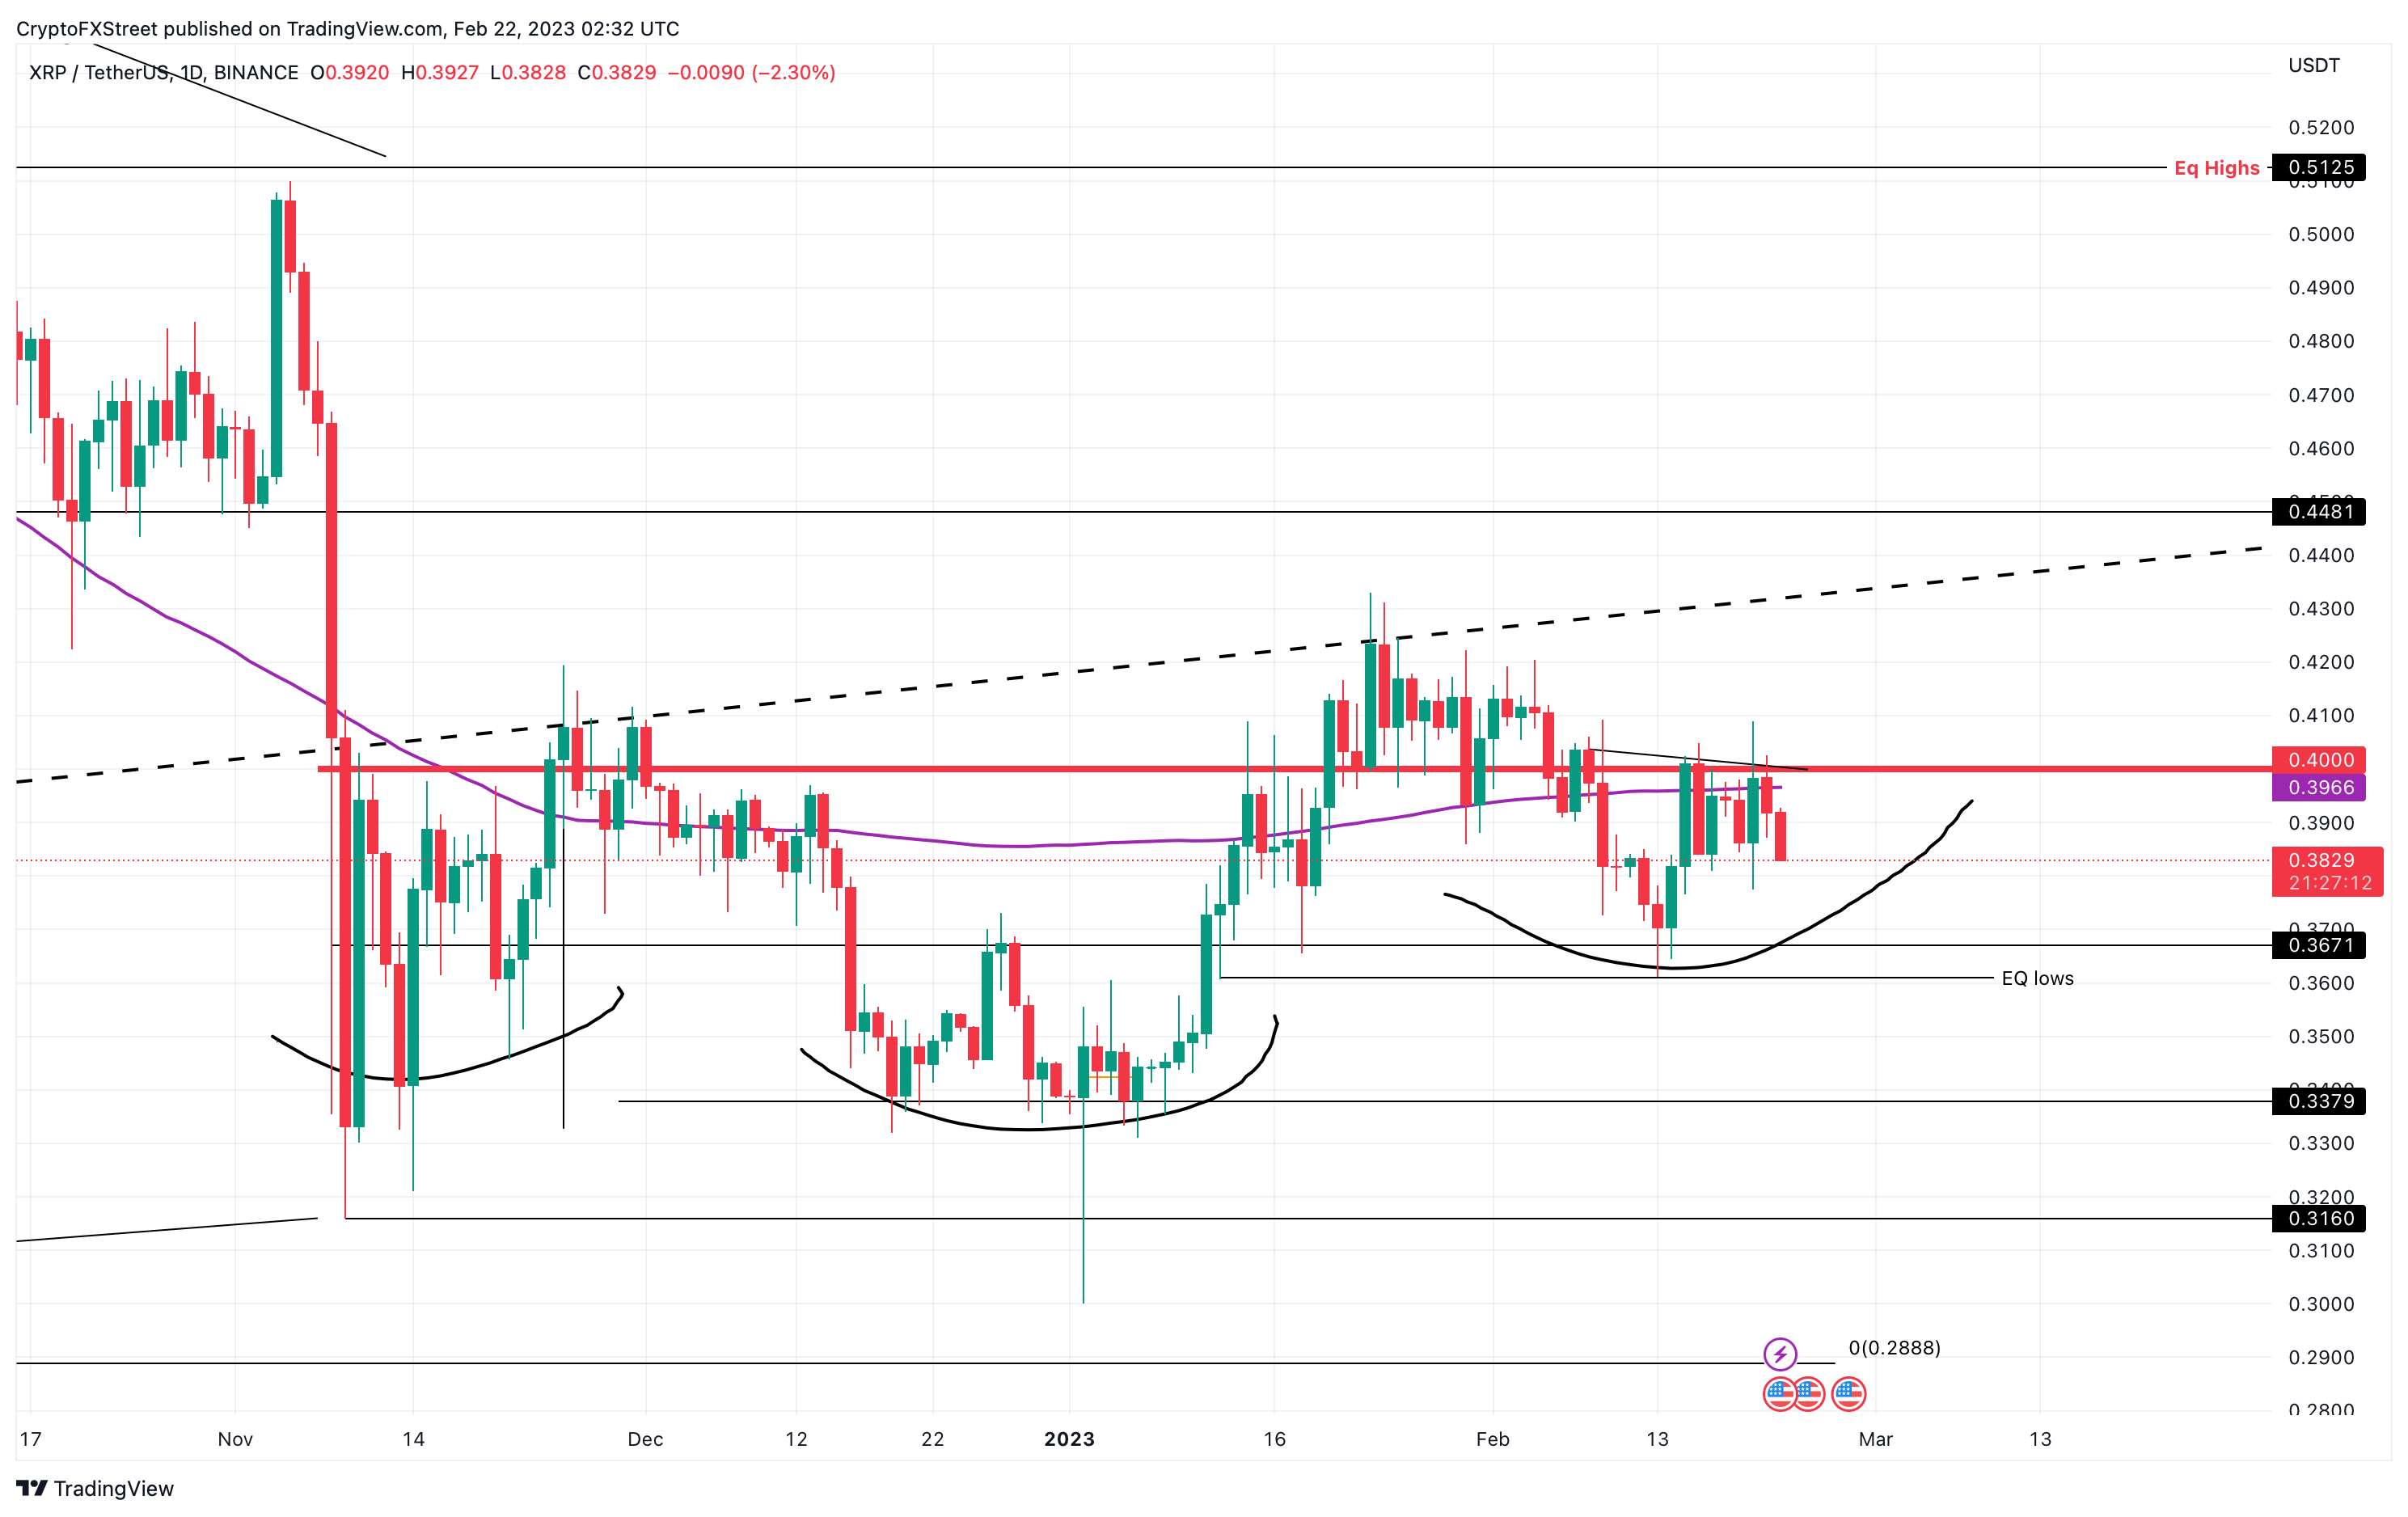
XRP/USD 1-day chart
Regardless of the bearish outlook, Ripple price needs to flip the $0.400 hurdle to invalidate this pessimistic outlook. If successful, XRP price could then target the $0.448 and $0.512 hurdles.
Author

Akash Girimath
FXStreet
Akash Girimath is a Mechanical Engineer interested in the chaos of the financial markets. Trying to make sense of this convoluted yet fascinating space, he switched his engineering job to become a crypto reporter and analyst.


