Top 3 Price Prediction Bitcoin, Ethereum, Ripple: Crypto markets coil up for an explosive move
- Bitcoin price correction seems to be holding above $60,000, but fear of an extended pullback persists.
- Ethereum price coils up between $3,900 and $4,200, preventing a retracement.
- Ripple price consolidates in a bullish pennant, suggesting a 26% ascent is likely.

Bitcoin price has been due for a retracement after rallying for three straight weeks in October. This came on October 21, when BTC began a correction that is now holding up pretty well above a psychological barrier. While a deeper correction seems likely, Ethereum, Ripple and altcoins are looking good and ready to pop higher.
Bitcoin price makes a shaky comeback
Bitcoin price dropped 11% over two days starting October 22 as it retested the $60,000 psychological level. Now buyers seem to have stepped in, however, signaling a makeshift albeit temporary bottom.
If BTC manages to produce a daily close above the October 21 open at $66,027, it will suggest a continuation of the uptrend. Failing to do so, however, will result in consolidation above $60,000. In the case that Bitcoin price shatters the said psychological level, investors can expect it to head toward the liquidity zone, ranging from $52,956 to $56,004.
A dip into this area will rid the Bitcoin market of short-term sellers as they exit the market booking profits. This will then allow the long-term rally to continue. In this situation, Bitcoin price will likely make a run at the $65,000 resistance barrier, a clearance of which will kick-start a run-up to new highs.
The 161.8% trend-based Fibonacci extension level at $77,525 will be the next high bulls target.
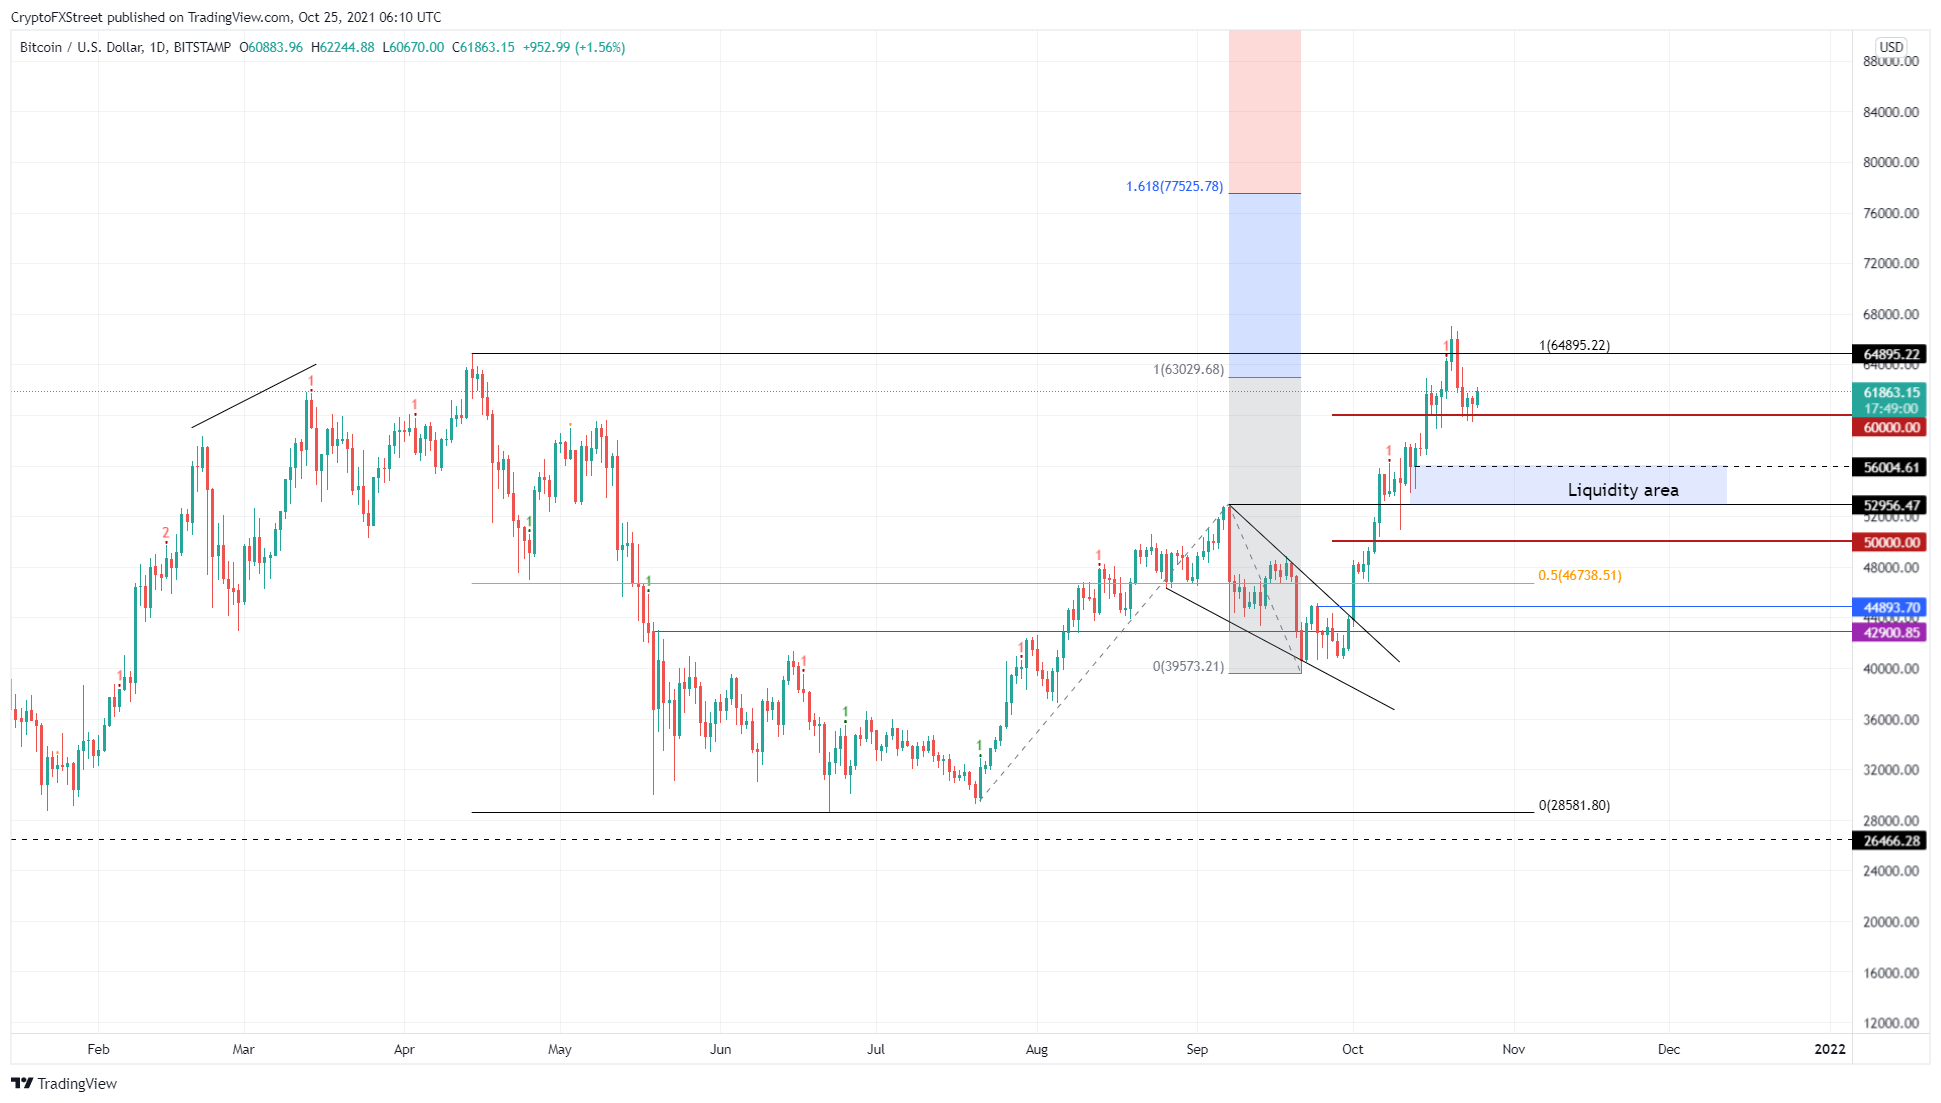
BTC/USD 1-day chart
On the other hand, if Bitcoin price breaches the $52,956 support floor, it will head toward the $50,000 psychological level, which may provide a level from which the uptrend could start again.
Ethereum price looks for an opening
Ethereum price looks ready for a run-up to contest its previous highs at $4,172 as it is consolidating between the $3,900 and $4,200 barriers. Like Bitcoin price, ETH has corrected 11% from its swing high at $4,380.
As long as the $3,900 support floor holds, Ethereum price will probably make a run up to new all-time highs. If the said support barrier gives way, however, investors can expect ETH to retrace to the $3,619 demand barrier. In a highly bearish case, the Ethereum price might revisit the $3,202 support level before restarting the bull rally.
A decisive daily candlestick close above $4,380 will confirm the uptrend and propel ETH to $4,957, coinciding with the 100% trend-based Fibonacci extension level – perhaps even making it to the $5,000 psychological level.
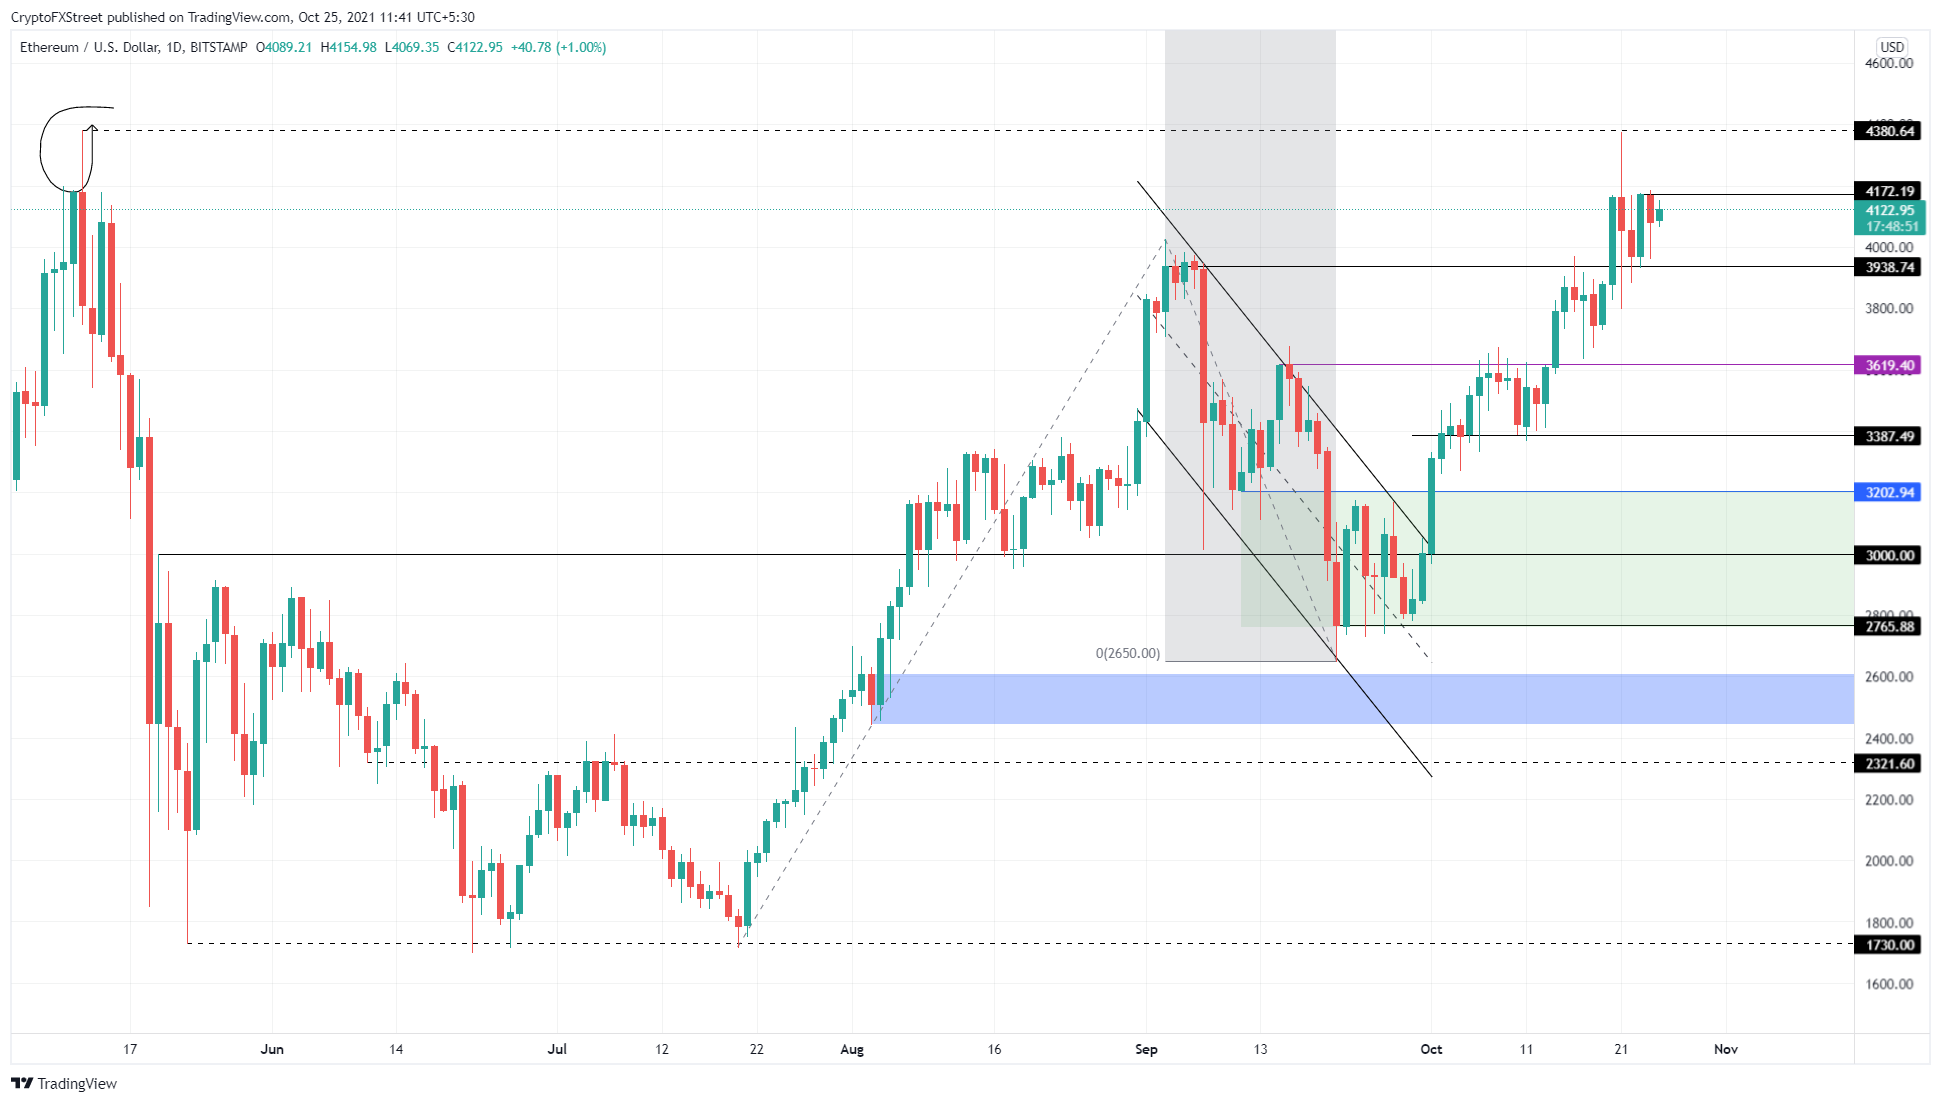
ETH/USD 1-day chart
On the flip side, if Ethereum price shatters the $3,200 barrier, it will dip into a stable support zone, extending from $2,765 to $3,202. This area has seen massive consolidation and will absorb the selling pressure, giving ETH price another chance to trigger a bull run.
Ripple price coils up for an explosive rally
Ripple price is consolidating inside a bullish pennant pattern, suggesting a massive move around the corner. From September 29 to October 10, XRP price rose 38%, creating the ‘flag pole’ section of the pennant pattern. This move was followed by a tight ranged movement that led to the formation of lower highs and higher lows, resulting in a pennant.
This technical setup forecasts a 26% ascent to $1.43, determined by adding the flag pole height to the breakout point at $1.14.
A decisive close above this level will indicate the start of a new uptrend. The ascent will face resistance at $1.24, but clearing this will open the path to $1.43. In some cases, Ripple price could extend this climb and retest $1.67 or $1.84, constituting a 67% gain.
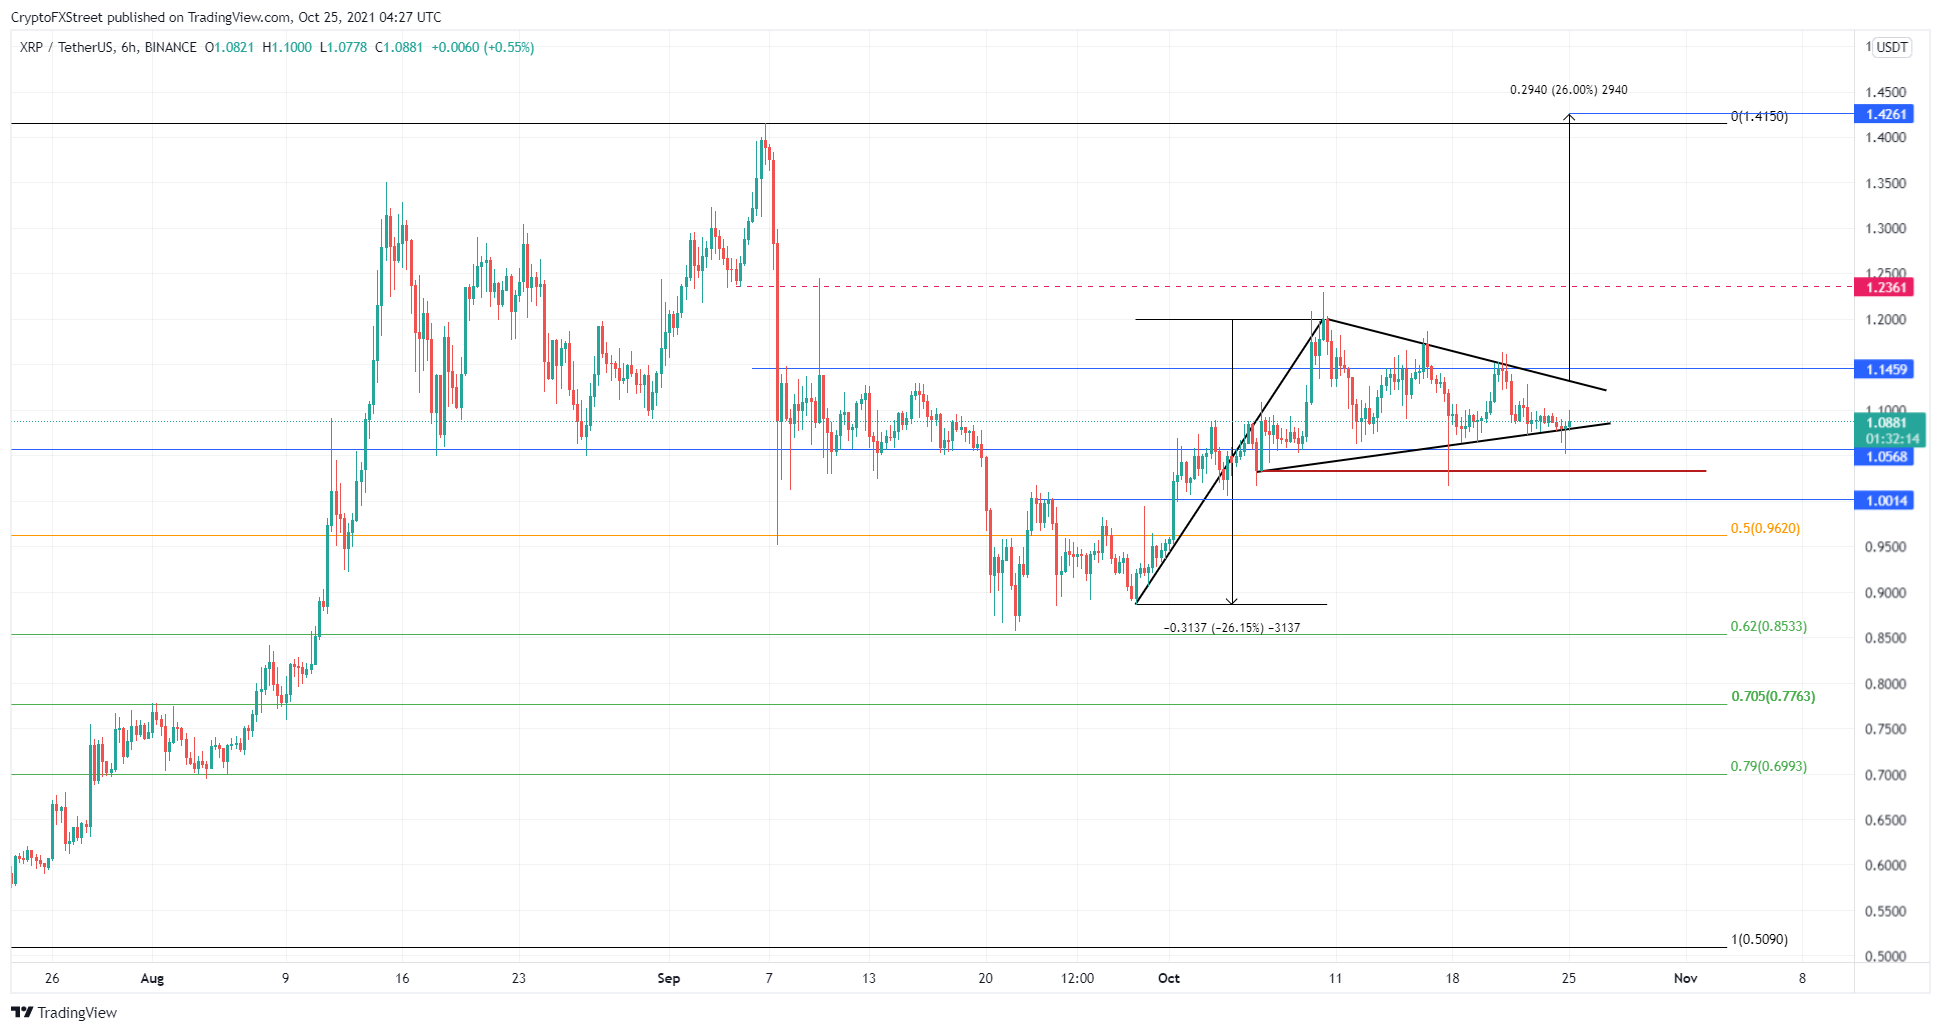
XRP/USD 1-day chart
While things are looking up for Ripple price, a breakdown of the pennant’s lower trend line at $1.05 will invalidate this setup. In this situation, XRP price might revisit the $1 psychological level, which might provide support for buyers to launch a comeback.
Author

Akash Girimath
FXStreet
Akash Girimath is a Mechanical Engineer interested in the chaos of the financial markets. Trying to make sense of this convoluted yet fascinating space, he switched his engineering job to become a crypto reporter and analyst.