Top 3 Price Prediction Bitcoin, Ethereum, Ripple: Crypto market unloads ballast in pivoting areas
- Bithumb legal problems activate necessary sales in the face of accumulated overbought.
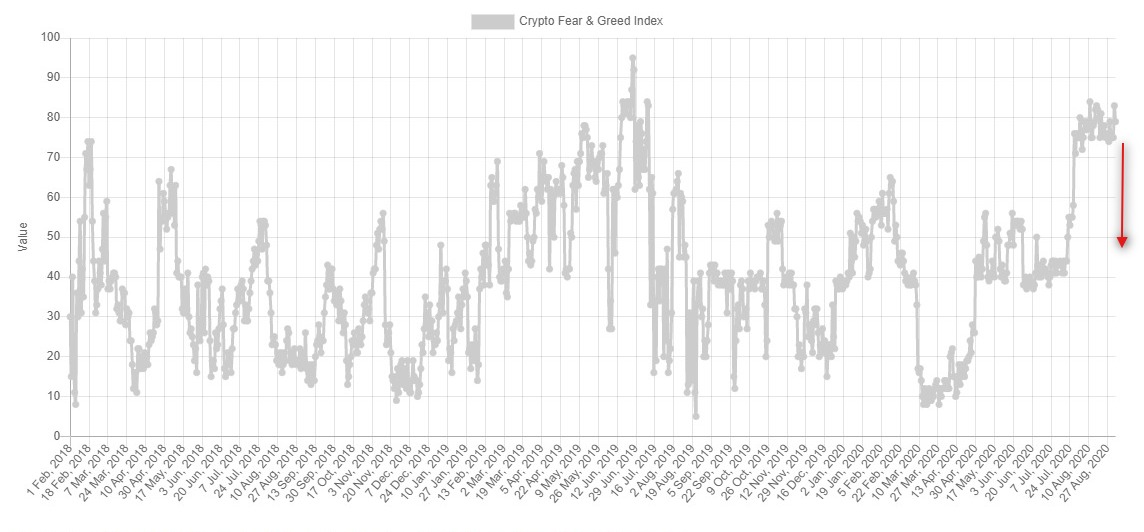
- Market sentiment remains high and is on a downward path.
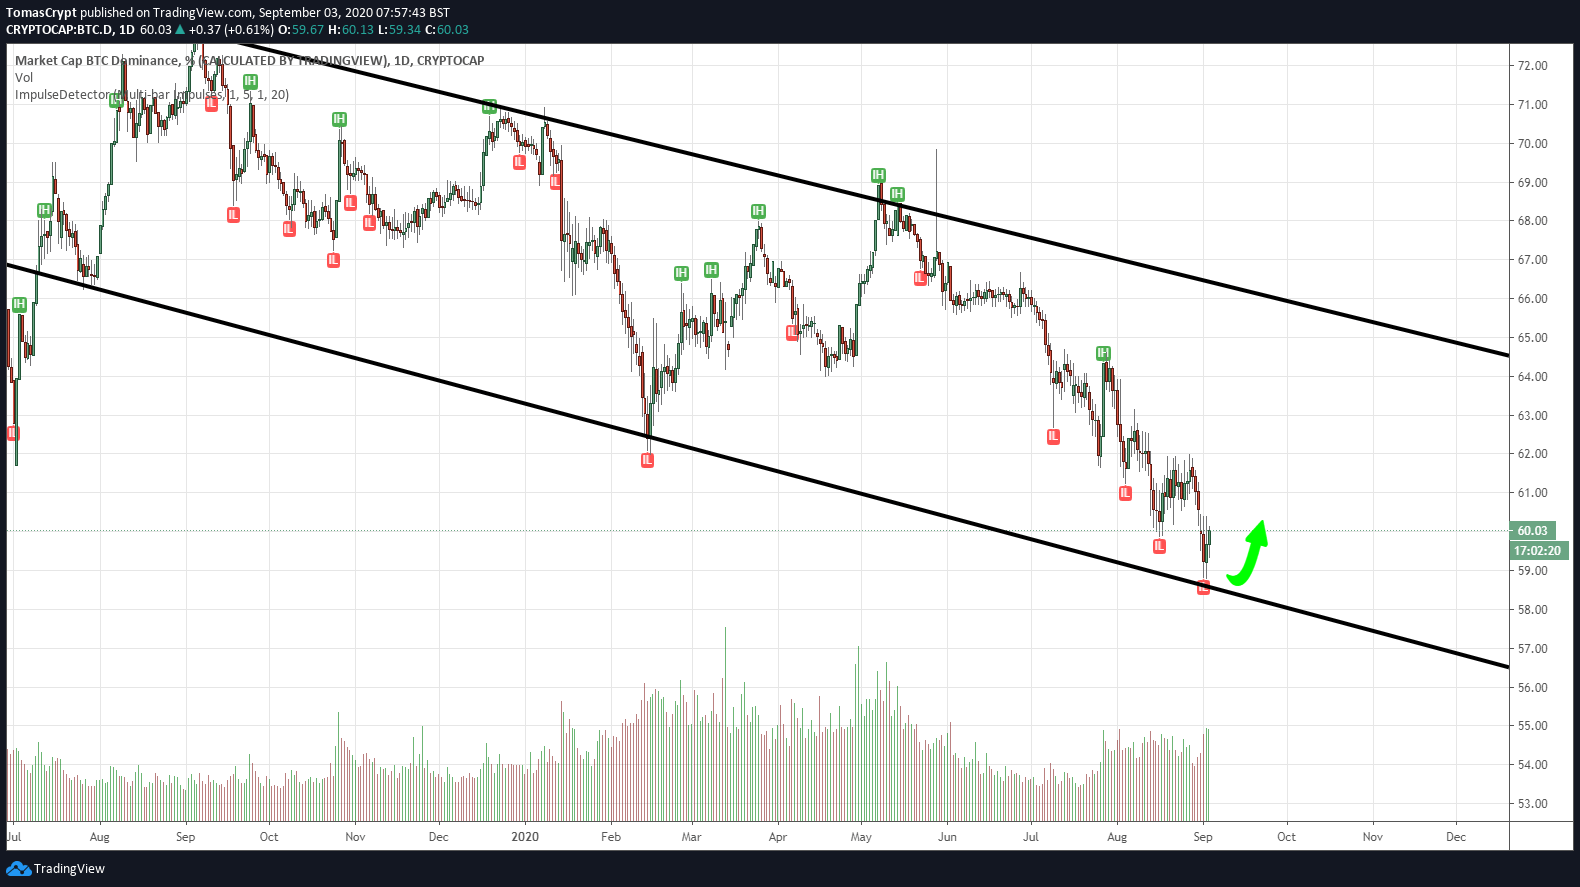
- Bitcoin's dominance chart suggests an increase in BTC's market share in the mid-term.

The crypto board goes red after the news of the accusation of fraud to the Korean exchange Bithumb by the police of the Asian country.
Such news was the remaining ingredient for the crypto market to back down from the doubts raised by Ethereum's solo race to the top.
Bitcoin was unable to break out of the $12000 resistance zone, and sentiment levels were once again extremely positive, a set that has made it impossible for Ethereum's upward movement to succeed.
From a market fundamentals point of view, the Bitcoin dominance chart reaches the floor of the bearish channel. Bitcoin's market share has increased in the last two days, but in the next few days, it may build a technical floor in the current area.
Today, the sentiment level drops along with the market and is at level 79. Despite the drop, the sentiment level is still high and has not just broken down, helping to relax excessive optimism on the part of market participants. A fall to less extreme areas, around level 60, would be very healthy for the medium term.
ETH/BTC Daily Chart
The ETH/BTC pair is currently trading at the price level of 0.0380 and is moving away from the price congestion resistance level.
Above the current price, the first resistance level is at 0.040, then the second at 0.042 and the third one at 0.0456.
Below the current price, the first support level is at 0.0372, then the second at 0.0347 and the third one at 0.0328.
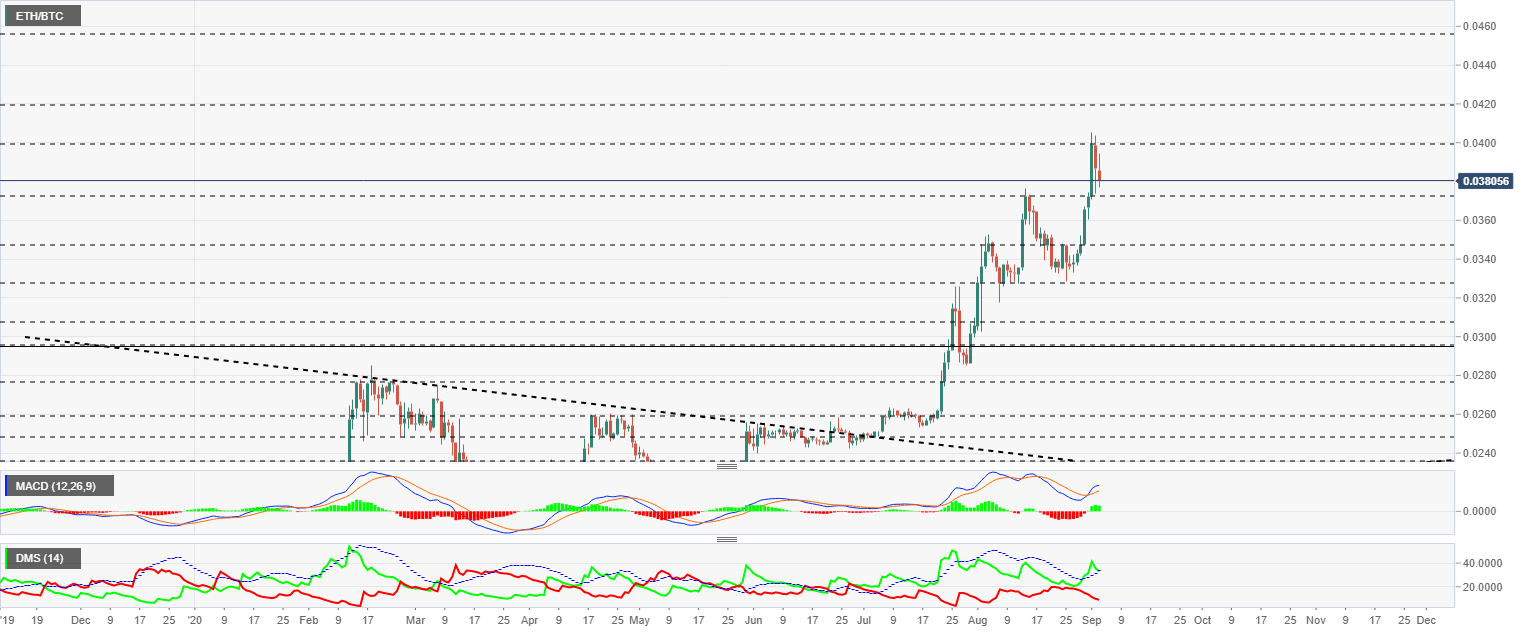
The MACD on the daily chart is still up but has lost the bullish profile. The moving averages have the margin to fall without undoing the bullish cross, so for the moment, we cannot confirm a change of direction in the medium term for the ETH/BTC pair.
The DMI on the daily chart shows the bulls leaning on the ADX line and here if it is in a critical position, as crossing the ADX line downwards would disable the bullish pattern.
BTC/USD Daily Chart
The BTC/USD pair is currently trading at the price level of $11340 and is attacking the price congestion support level at $11300.
BTC/USD is having severe problems moving forward in this area because it needs to build up congestion zones that will give solidity to future increases. Past moves above $12000 were always violent and did not build up substantial support/resistance, which would now allow for a rally. The BTC/USD pair must build these structures, and that is what they are doing.
Above the current price, the first resistance level is at $12850, then the second at $13500 and the third one at $14000.
Below the current price, the first level of support is at $11300, then the second at $10450 and the third one at $9500.
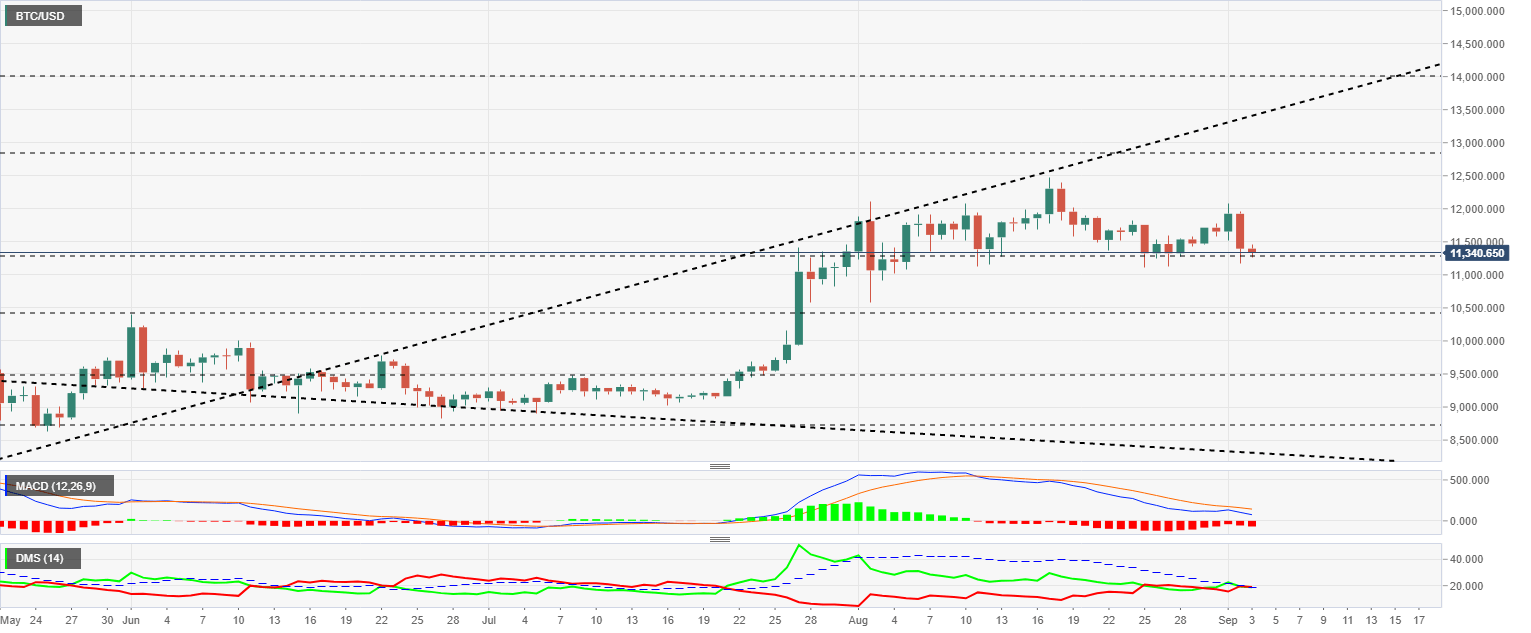
The MACD on the daily chart is moving downward after being rejected in the bullish cross attempt. Now the moving averages will look for support at the 0 levels of the indicator.
The DMI on the daily chart shows the bulls and bears tied as both sides are above the ADX line. By not having the resistance that the ADX indicator exerts, the side of the market that takes advantage can quickly gain momentum.
ETH/USD Daily Chart
The ETH/USD pair is currently trading at the price level of $433.9 after the quick trip to the mythical $500 zone. At the moment the price drop is within the normal range as seen by the way the last few sessions have gone up.
Above the current price, the first resistance level is at $490, then the second at $535 and the third one at $575.
Below the current price, the first support level is at $420, then the second at $360 and the third one at $320.
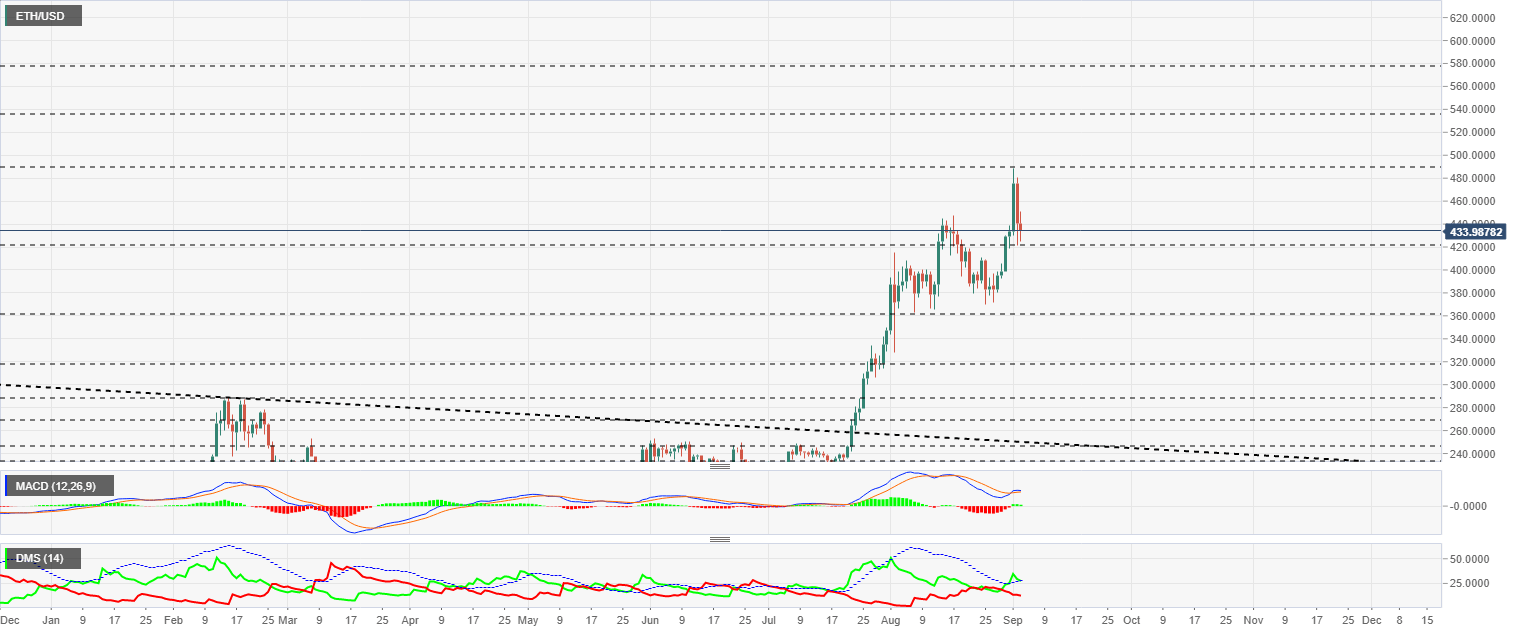
The MACD on the daily chart shows a profile on the way to undo the bullish cross and look for support in the neutral zone of the indicator. The current position also allows for a bullish rebound, although this does not seem to be the most likely scenario.
The DMI on the daily chart shows the bulls looking for support on the ADX line. If the buy-side crosses the downward sloping indicator, the previous bullish pattern will be deactivated.
XRP/USD Daily Chart
The XRP/USD pair is currently trading at $0.2716 and continues to move lower, accumulating more than two weeks of weakness in the Ripple market.
Above the current price, the first resistance level is at $0.285, then the second at $0.295 and the third one at $0.31.
Below the current price, the first support level is at $0.265, then the second at $0.245 and the third one at $0.235.
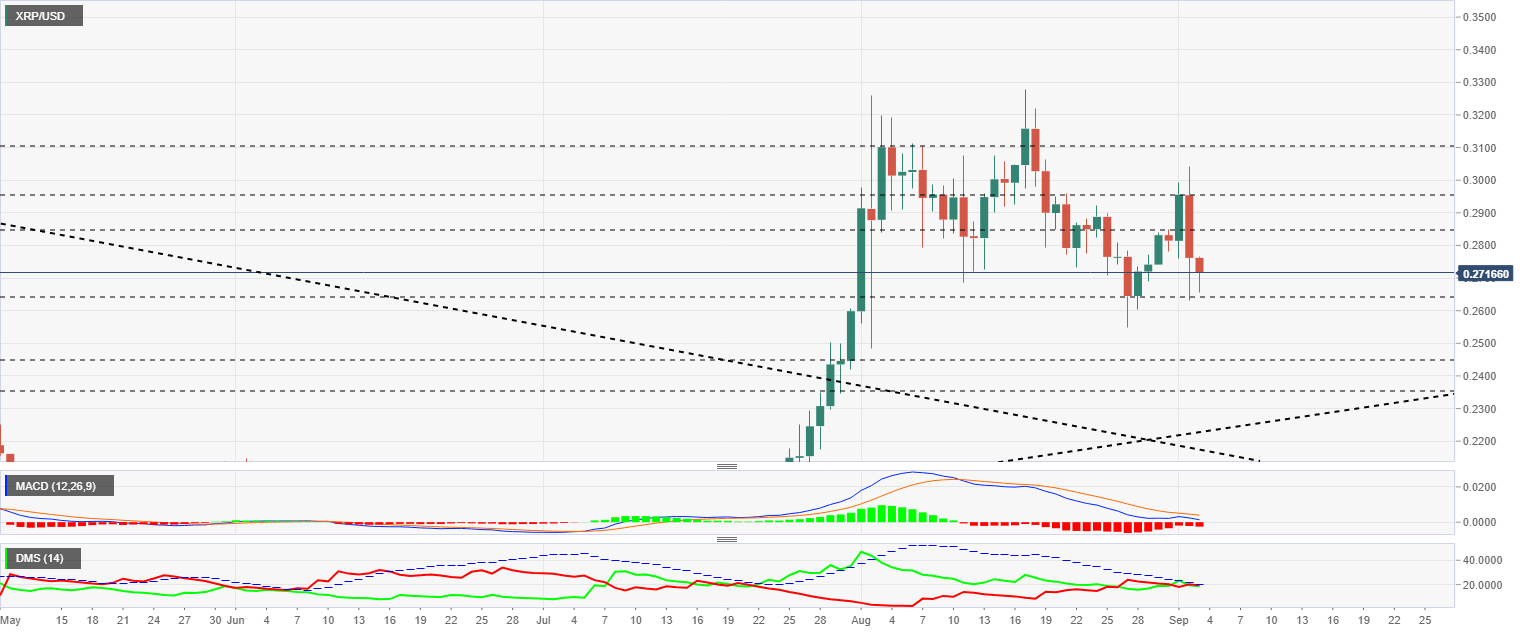
The MACD on the daily chart is heading towards the zero levels of the indicator. The MACD on the daily chart is heading towards the indicator's zero levels.
The DMI on the daily chart shows bulls and bears at similar levels, although unlike BTC/USD here both sides of the market are below the ADX line.
Author

Tomas Salles
FXStreet
Tomàs Sallés was born in Barcelona in 1972, he is a certified technical analyst after having completing specialized courses in Spain and Switzerland. He expanded his technical training following the guidance of great experts on the financial markets.


