Top 3 Price Prediction Bitcoin Ethereum Ripple: Crypto market bound for a brief correction
- Bitcoin price shows signs of profit-taking and a mean reversion trade towards the Tenkan-Sen, a -13% drop towards the Kijun-Sen is on deck.
- Ethereum price prepares to slide below Kumo Twist, causing a swift move lower to $3,100.
- XRP, like Ethereum, trades near its Kumo Twist and could accelerate a move towards $0.92.

Bitcoin price fills the extended gap between its close and the Tenkan-Sen, but the slope of the rise may indicate a deeper move south is likely. Ethereum price moved below its Tenkan-Sen and is near the weakest part of the Cloud – the Kumo Twist. Finally, Ripple price is the only cryptocurrency out of the three reviewed in this article that may show some contrarian price action and may move higher rather than lower.
Bitcoin price swing high arrives near a Kumo Twist date, lower prices expected
Bitcoin price has been at the center of financial market news over the past two months. While most indexes around the globe have suffered intense selling pressure, the primary risk-on market – cryptocurrencies – have experienced strong appreciation in prices. Bitcoin has been the leader of that move but looks to give back some of those gains.
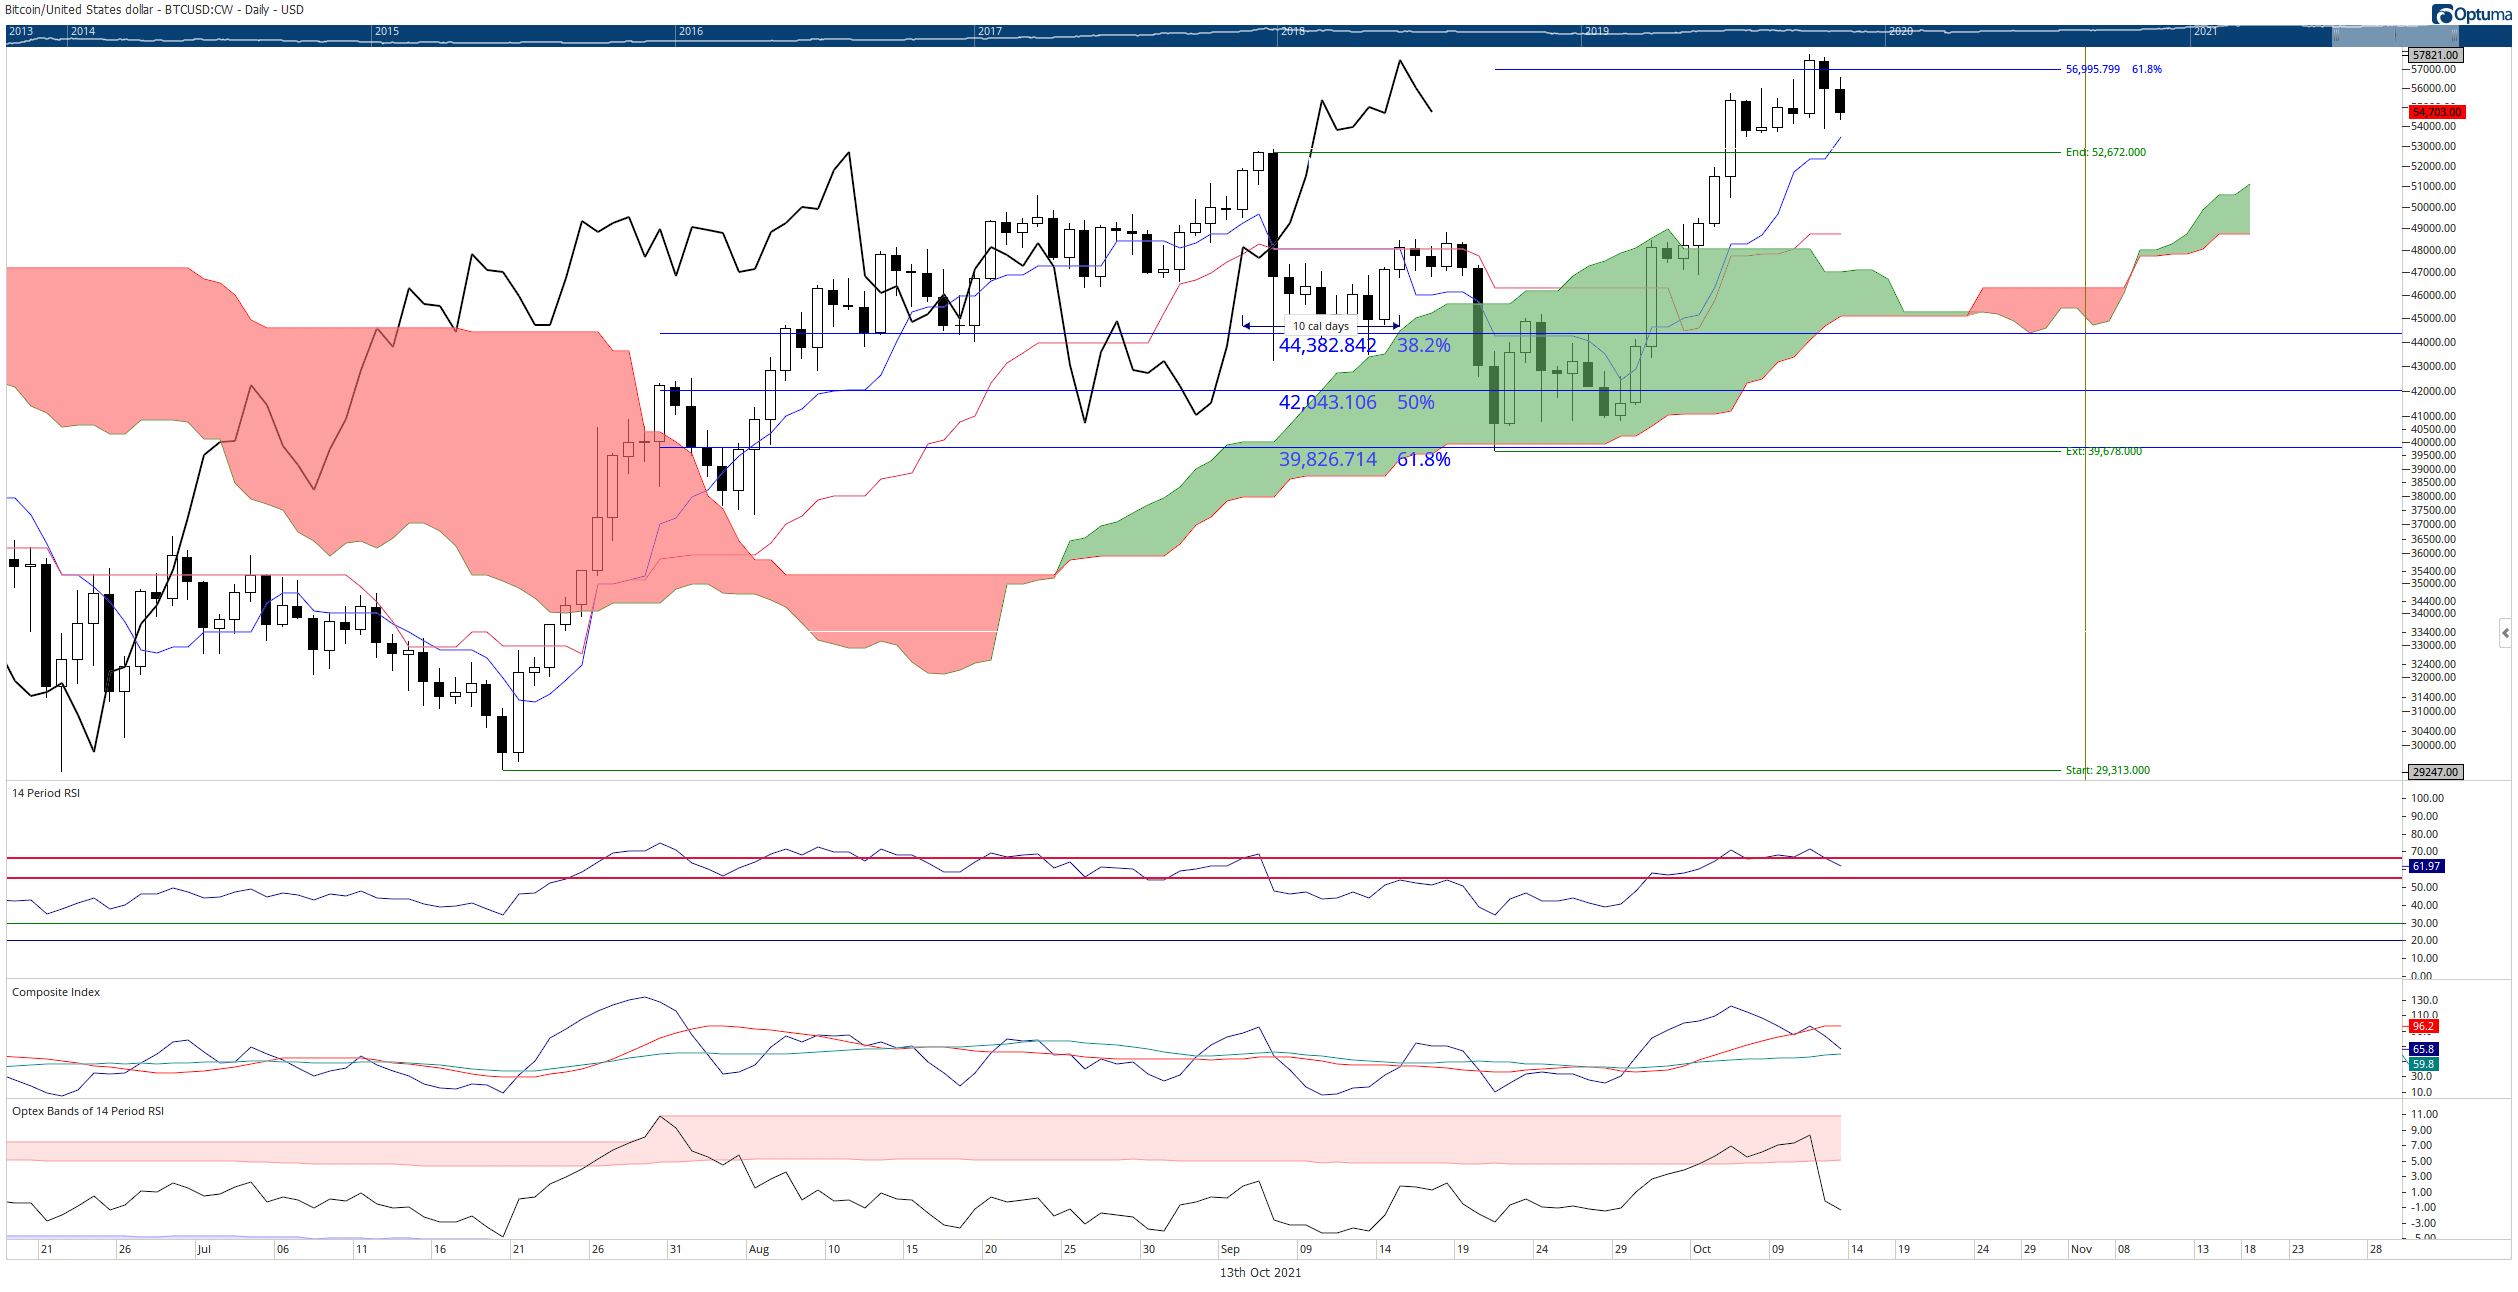
BTC/USD Daily Ichimoku Chart
The Kumo Twist that occurs on October 14th arrives as Bitcoin has made new multi-month highs. This means there is a likelihood of a corrective move. An anticipated retracement to the Kijun-Sen at $48,750 is likely, but it could extend lower to test Senkou Span B at $47,000.
Ethereum price eyes return to $3,100 but could extend deeper towards $2,400
Ethereum price has a very bearish setup on its daily chart. A rounded top pattern shows signs of a breakdown right at the point of a Kumo Twist in the Ichimoku Kinko Hyo system. The expected behavior of price, when it moves through a Kumo Twist, is rapid and robust. The Kumo Twist acts as a kind of accelerant or propellant that pushes price through ease and force. The first support zone is the Kijun-Sen at $3,100. However, given the current swing structure, a return to the 50% Fibonacci retracement and 100% Fibonacci expansion at $2,400 is the next primary support zone.
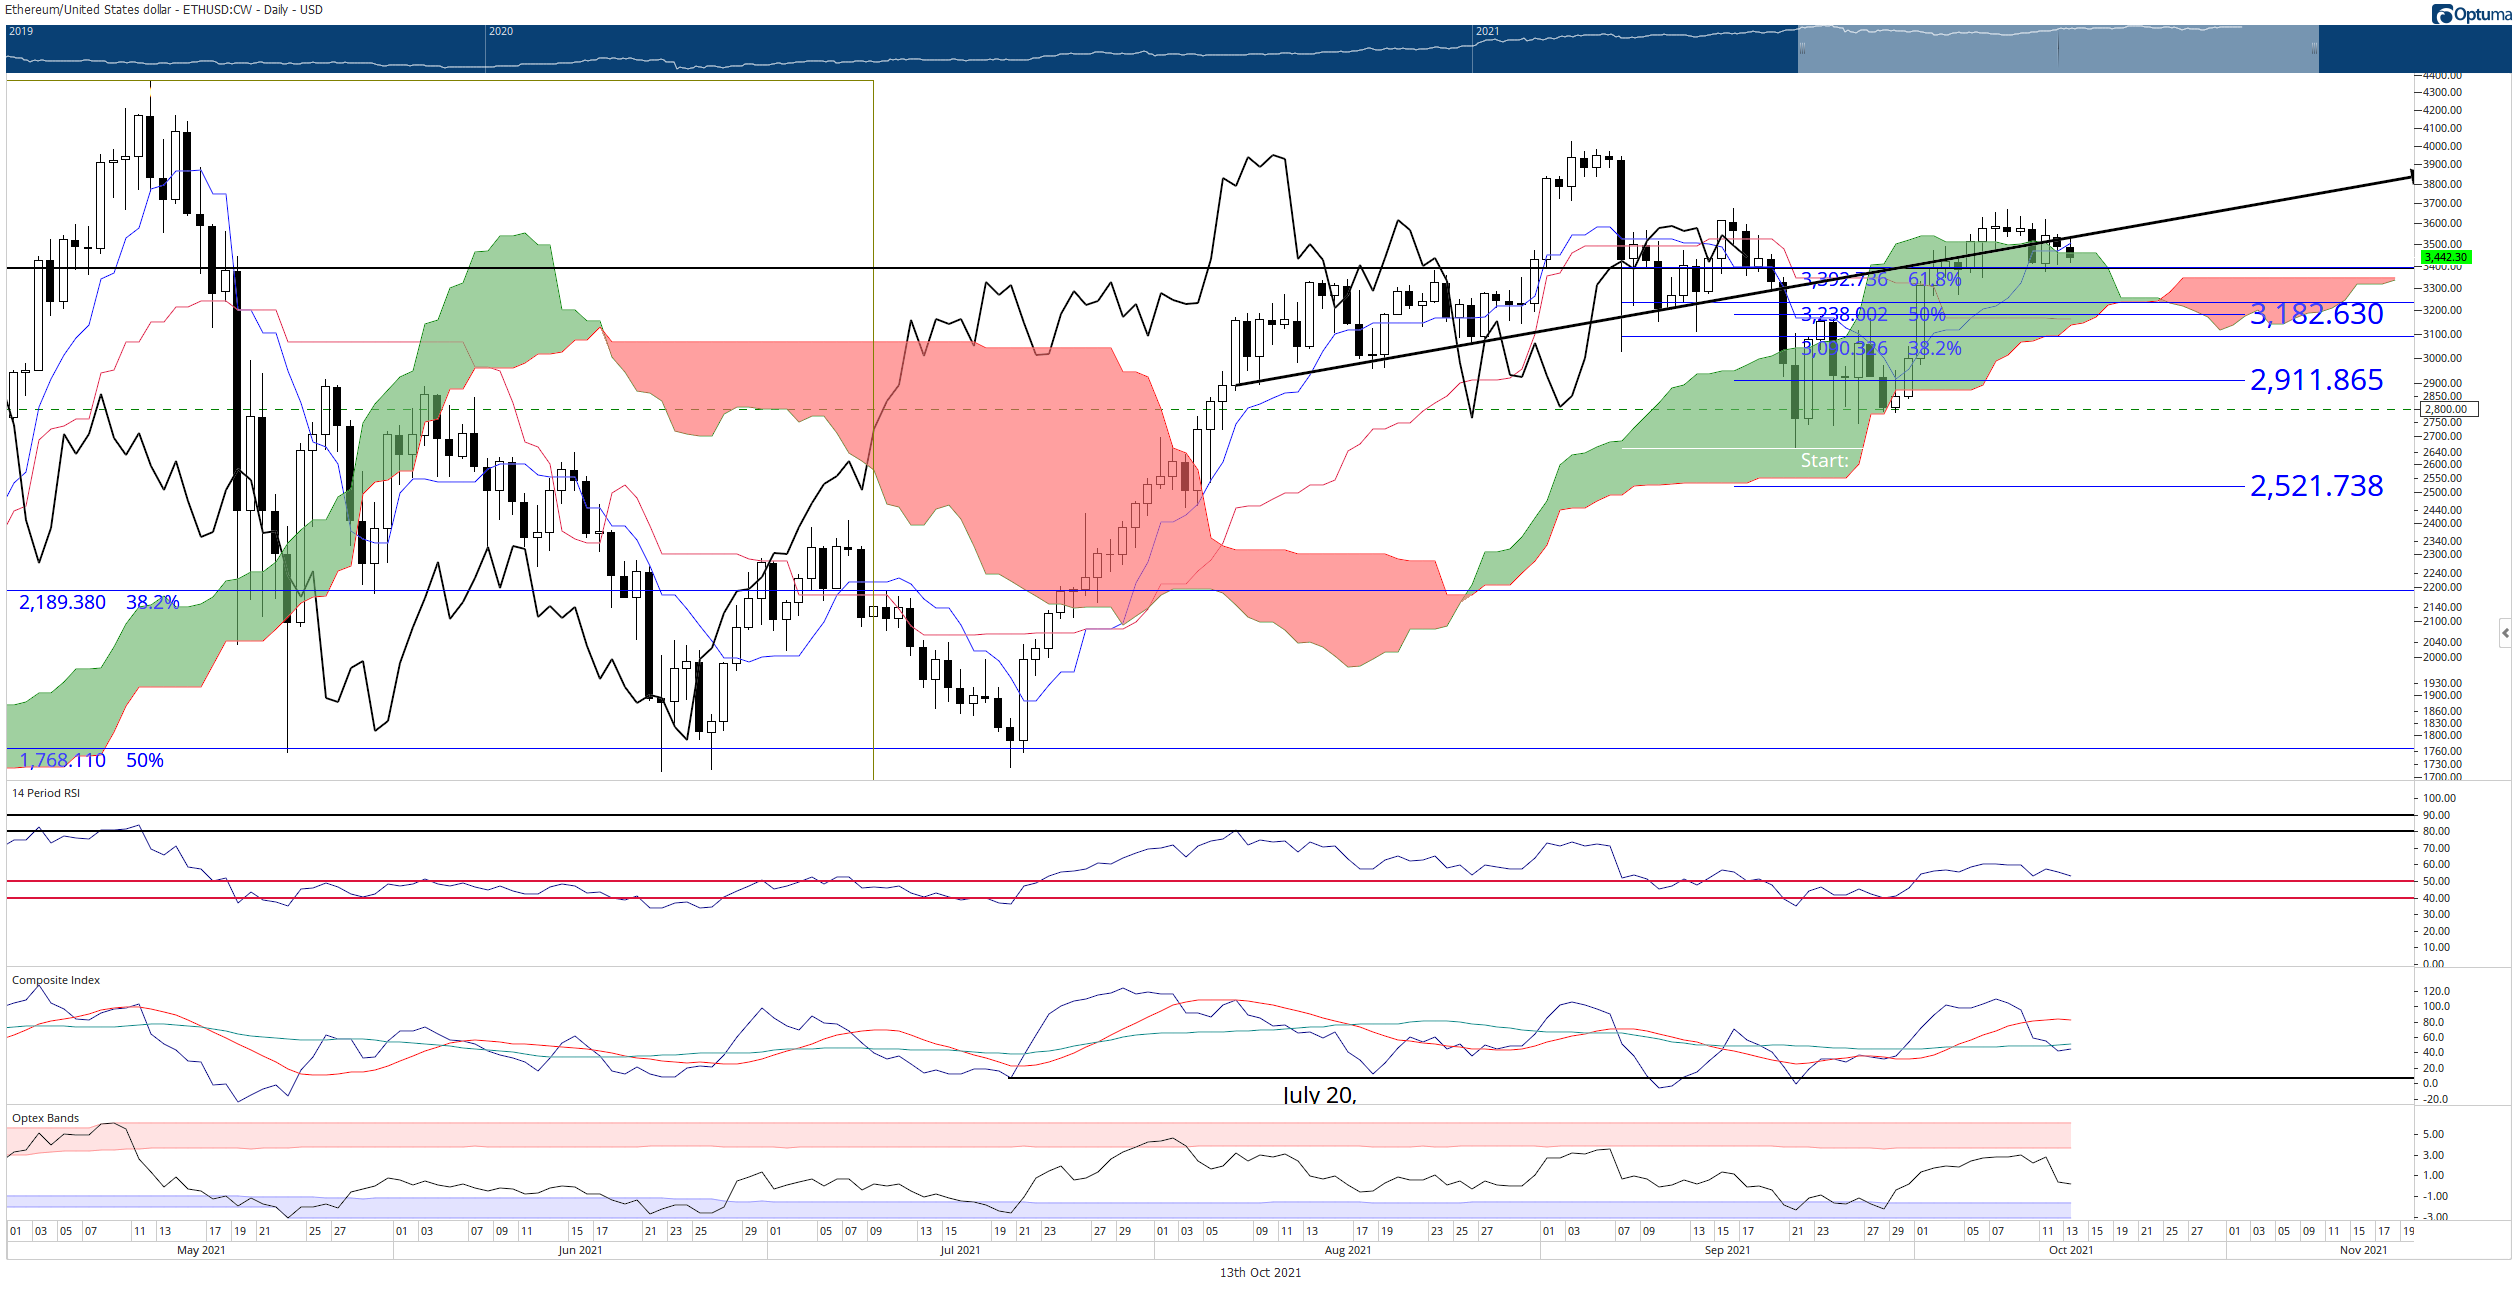
ETH/USD Daily Ichimoku Chart
If bulls can support Ethereum price above the Cloud, then the bearish outlook will likely be invalidated. There is only one condition missing for Ethereum price to achieve a robust bullish breakout on its Ichimoku chart: the Chikou Span closing above the candlesticks and in ‘open space.’ A daily close above $3,350 would fulfill that bullish breakout setup.
XRP risks return to $0.92
XRP price continues to trade in the frustrating conditions that one would associate with any instrument inside the Cloud. As Ripple nears its Kumo Twist, buyers and sellers will watch with interest on the direction of the move. Strong near-term support for XRP exists with the Kijun-Sen and Senkou Span B sharing the same support level – the combination of those two Ichimoku levels is one of the most potent support combos in the Ichimoku system. A break below the final support at $1.04 could see a test of the bottom of the bear flag at $0.92. Below that, nothing is stopping Ripple from moving lower by nearly -50% towards the $0.50 value area.
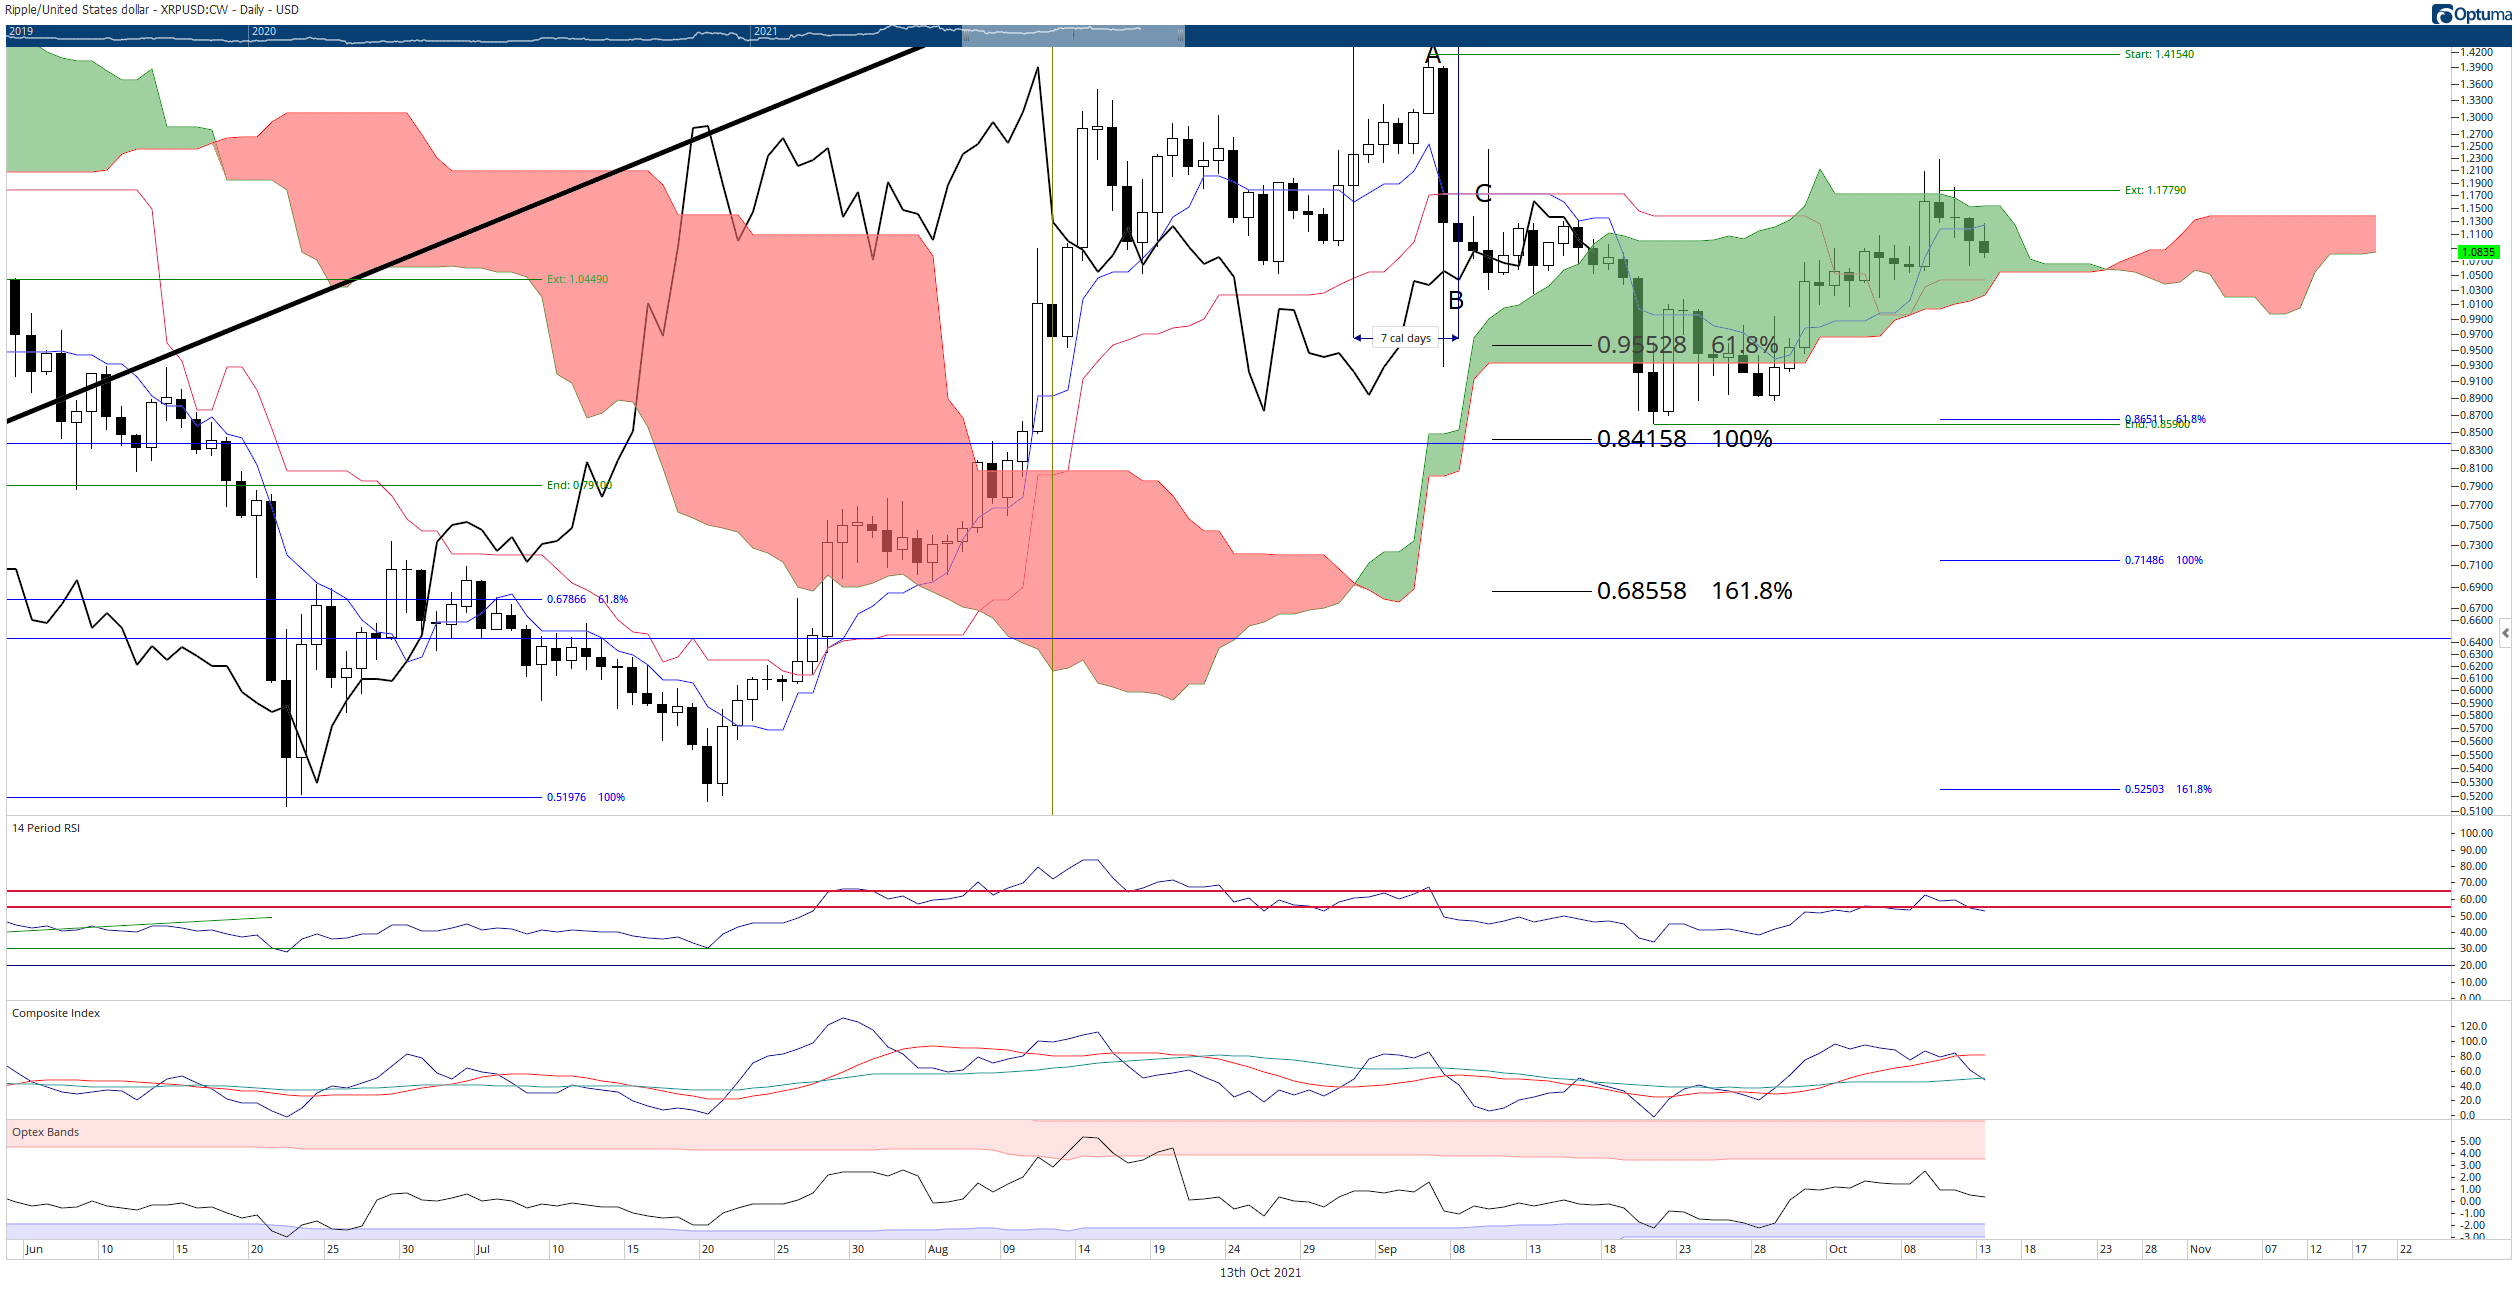
XRP/USD Daily Ichimoku Chart
Invalidation of any bearish sentiment should not be difficult for XRP. The level that Ripple price must close at to confirm a bullish breakout is closer than the levels needed to confirm a bearish breakout. A daily close at $1.20 would fulfill all requirements for a bullish breakout and resumption of the prior bull market.
Author

Jonathan Morgan
Independent Analyst
Jonathan has been working as an Independent future, forex, and cryptocurrency trader and analyst for 8 years. He also has been writing for the past 5 years.



