Top 3 Price Prediction Bitcoin, Ethereum, Ripple: Crypto liquidations hit $311 million, what’s next?
- Bitcoin price liquidations cross $100 million after the SEC’s recent lawsuit against Binance.
- Ethereum price could retest the $2,000 psychological level if sidelined buyers join the fray.
- Ripple price to get boring for a few days before XRP reveals its directional bias.

Bitcoin (BTC) price has suffered a fatal setback after the recent lawsuit that the Securities and Exchange Commission (SEC) filed against Binance and its founder, Changpeng “CZ” Zhao. The suit caused the markets to cascade, triggering a massive sell-off and causing roughly $311 million in liquidations across the entire crypto landscape.
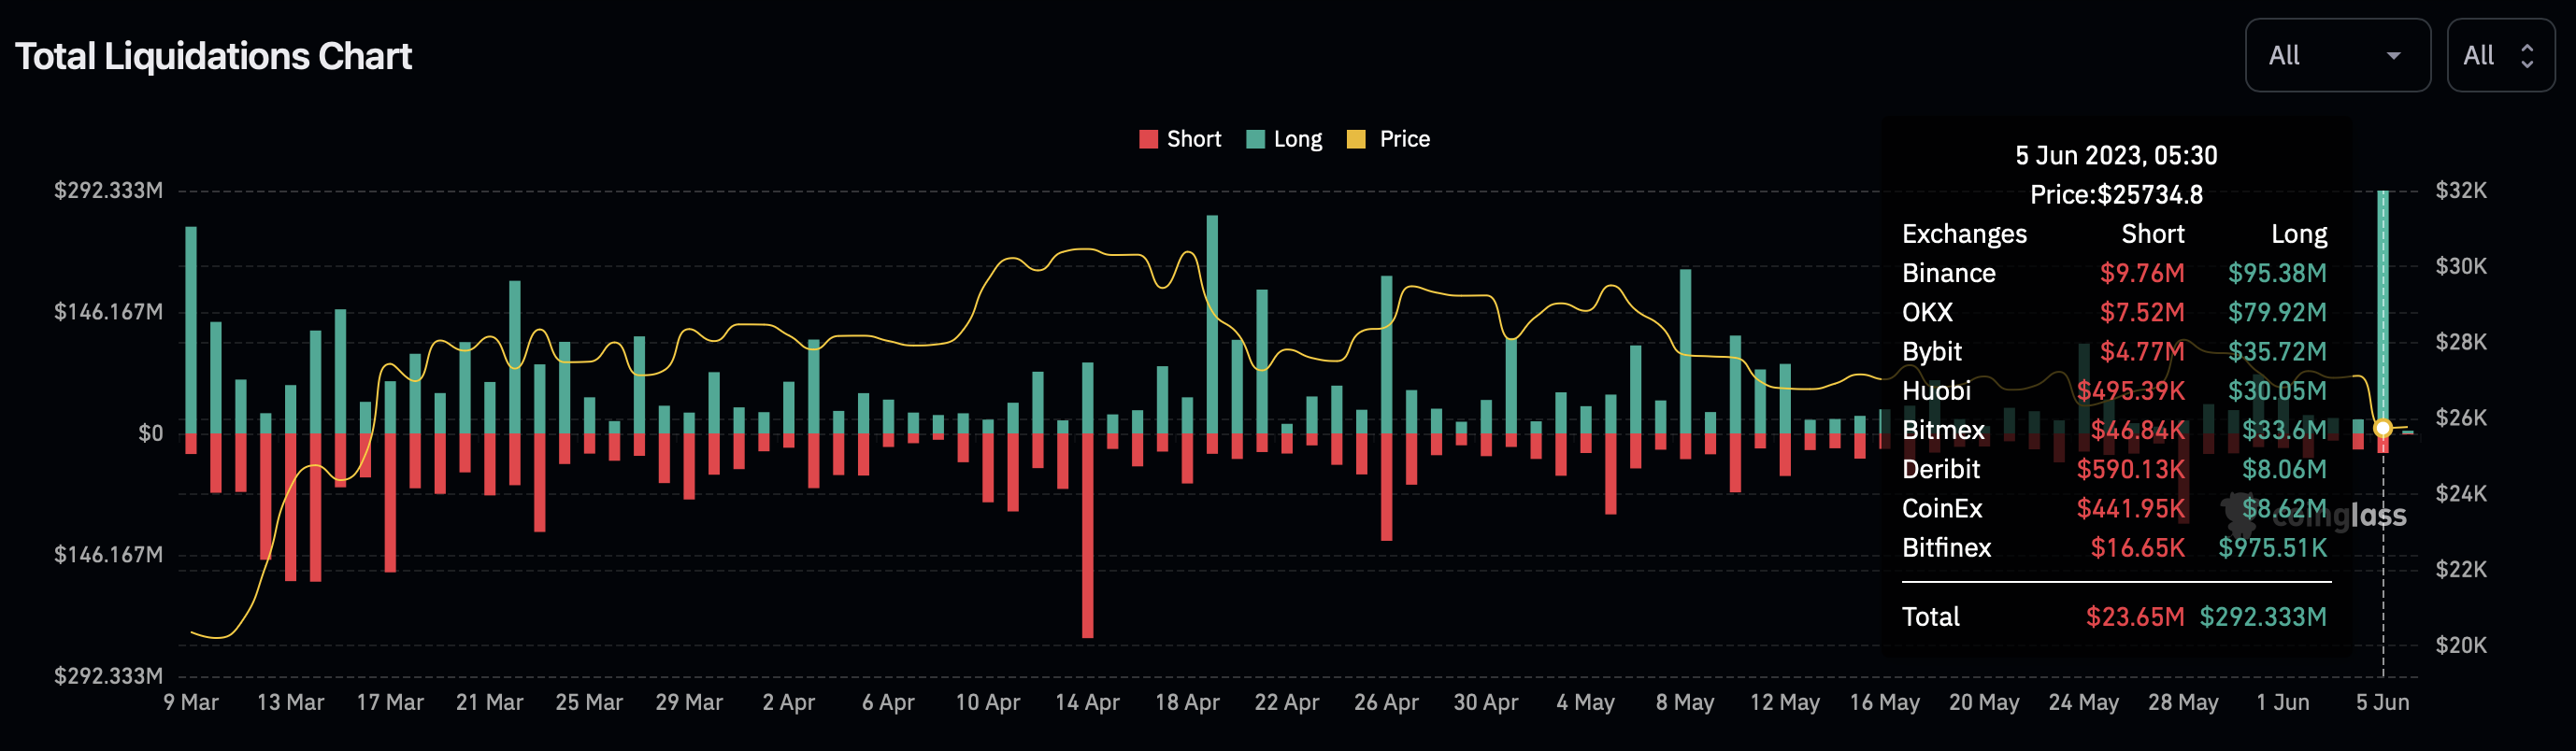
BTC Liquidations
Out of the $311 million in liquidations, BTC takes the largest share with $112.27 million in liquidations, Ethereum (ETH) sits at $37.92 million and Ripple (XRP) at $6.72 million. Other altcoins make up roughly $50.16 million.
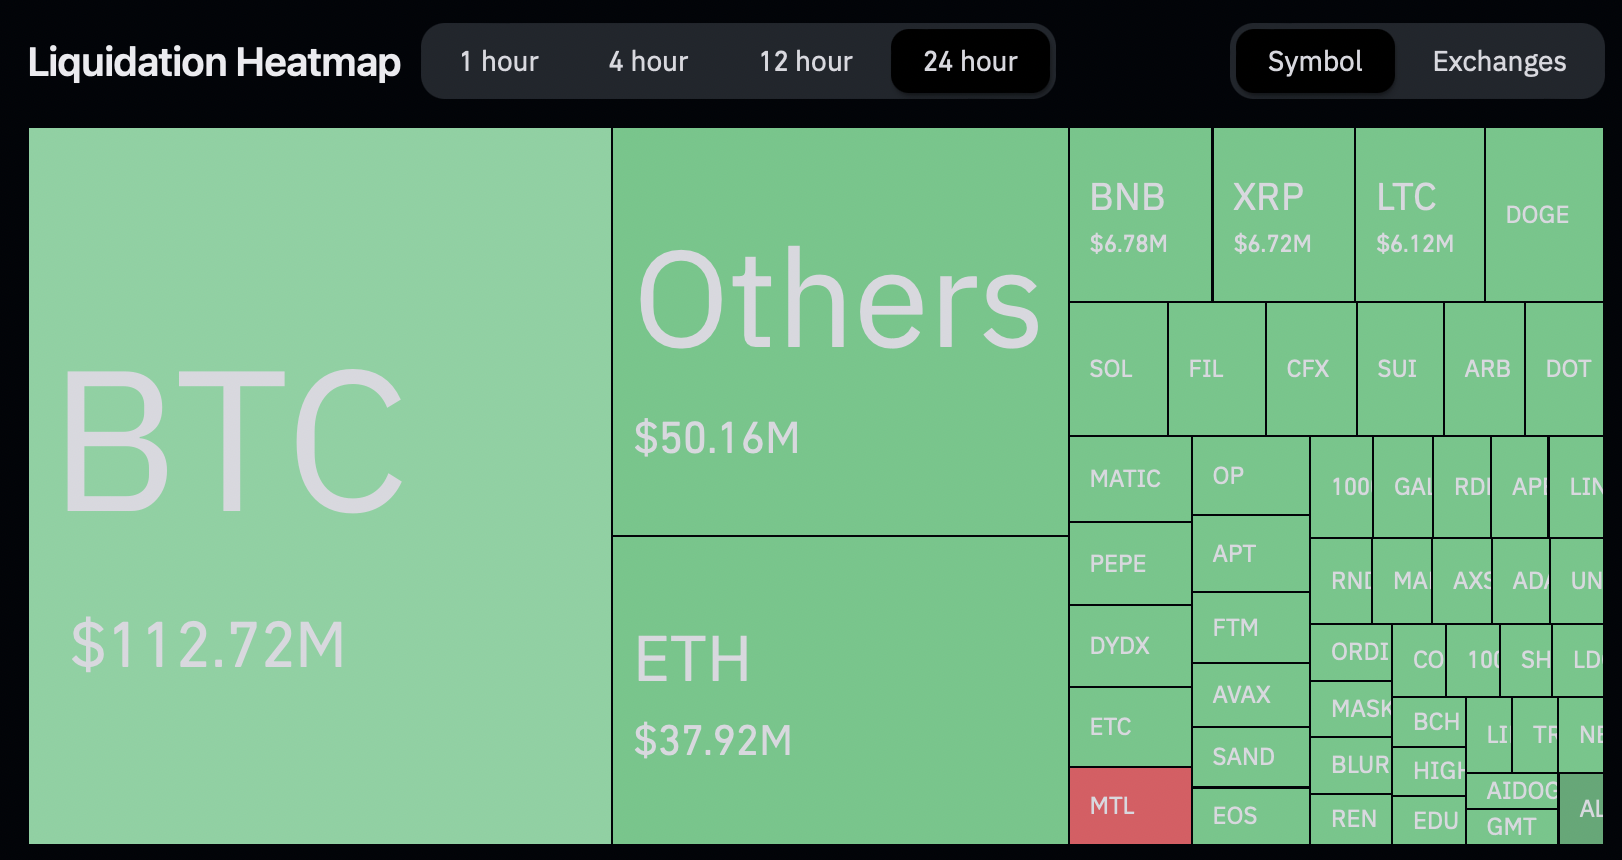
Liquidations heatmap
Also read: Binance responds to SEC claims, plans to defend the platform vigorously
Bitcoin price remains rational
Bitcoin (BTC) price action over the last 50 days has set up four distinctive lower highs and lower lows. Connecting these swing points using trend lines reveals a falling wedge formation. This technical formation is a bullish setup, but considering BTC has breached the lower trend line, investors need to wait for more information.
Additionally, Bitcoin price has come close to retesting $25,290, which is the midpoint of the 59% rally witnessed between March 10 and March 27. Hence, the likely direction Bitcoin price will head next is south to find a stable support level. The $25,290 barrier will likely provide some respite from bears.
A recovery inside the falling wedge could see Bitcoin price try and retest the upper limit of the wedge at roughly $27,395. A flip of this hurdle into a support floor could trigger a swift move to $30,048. This uptick is likely going to target the buy-side liquidity resting above this level.
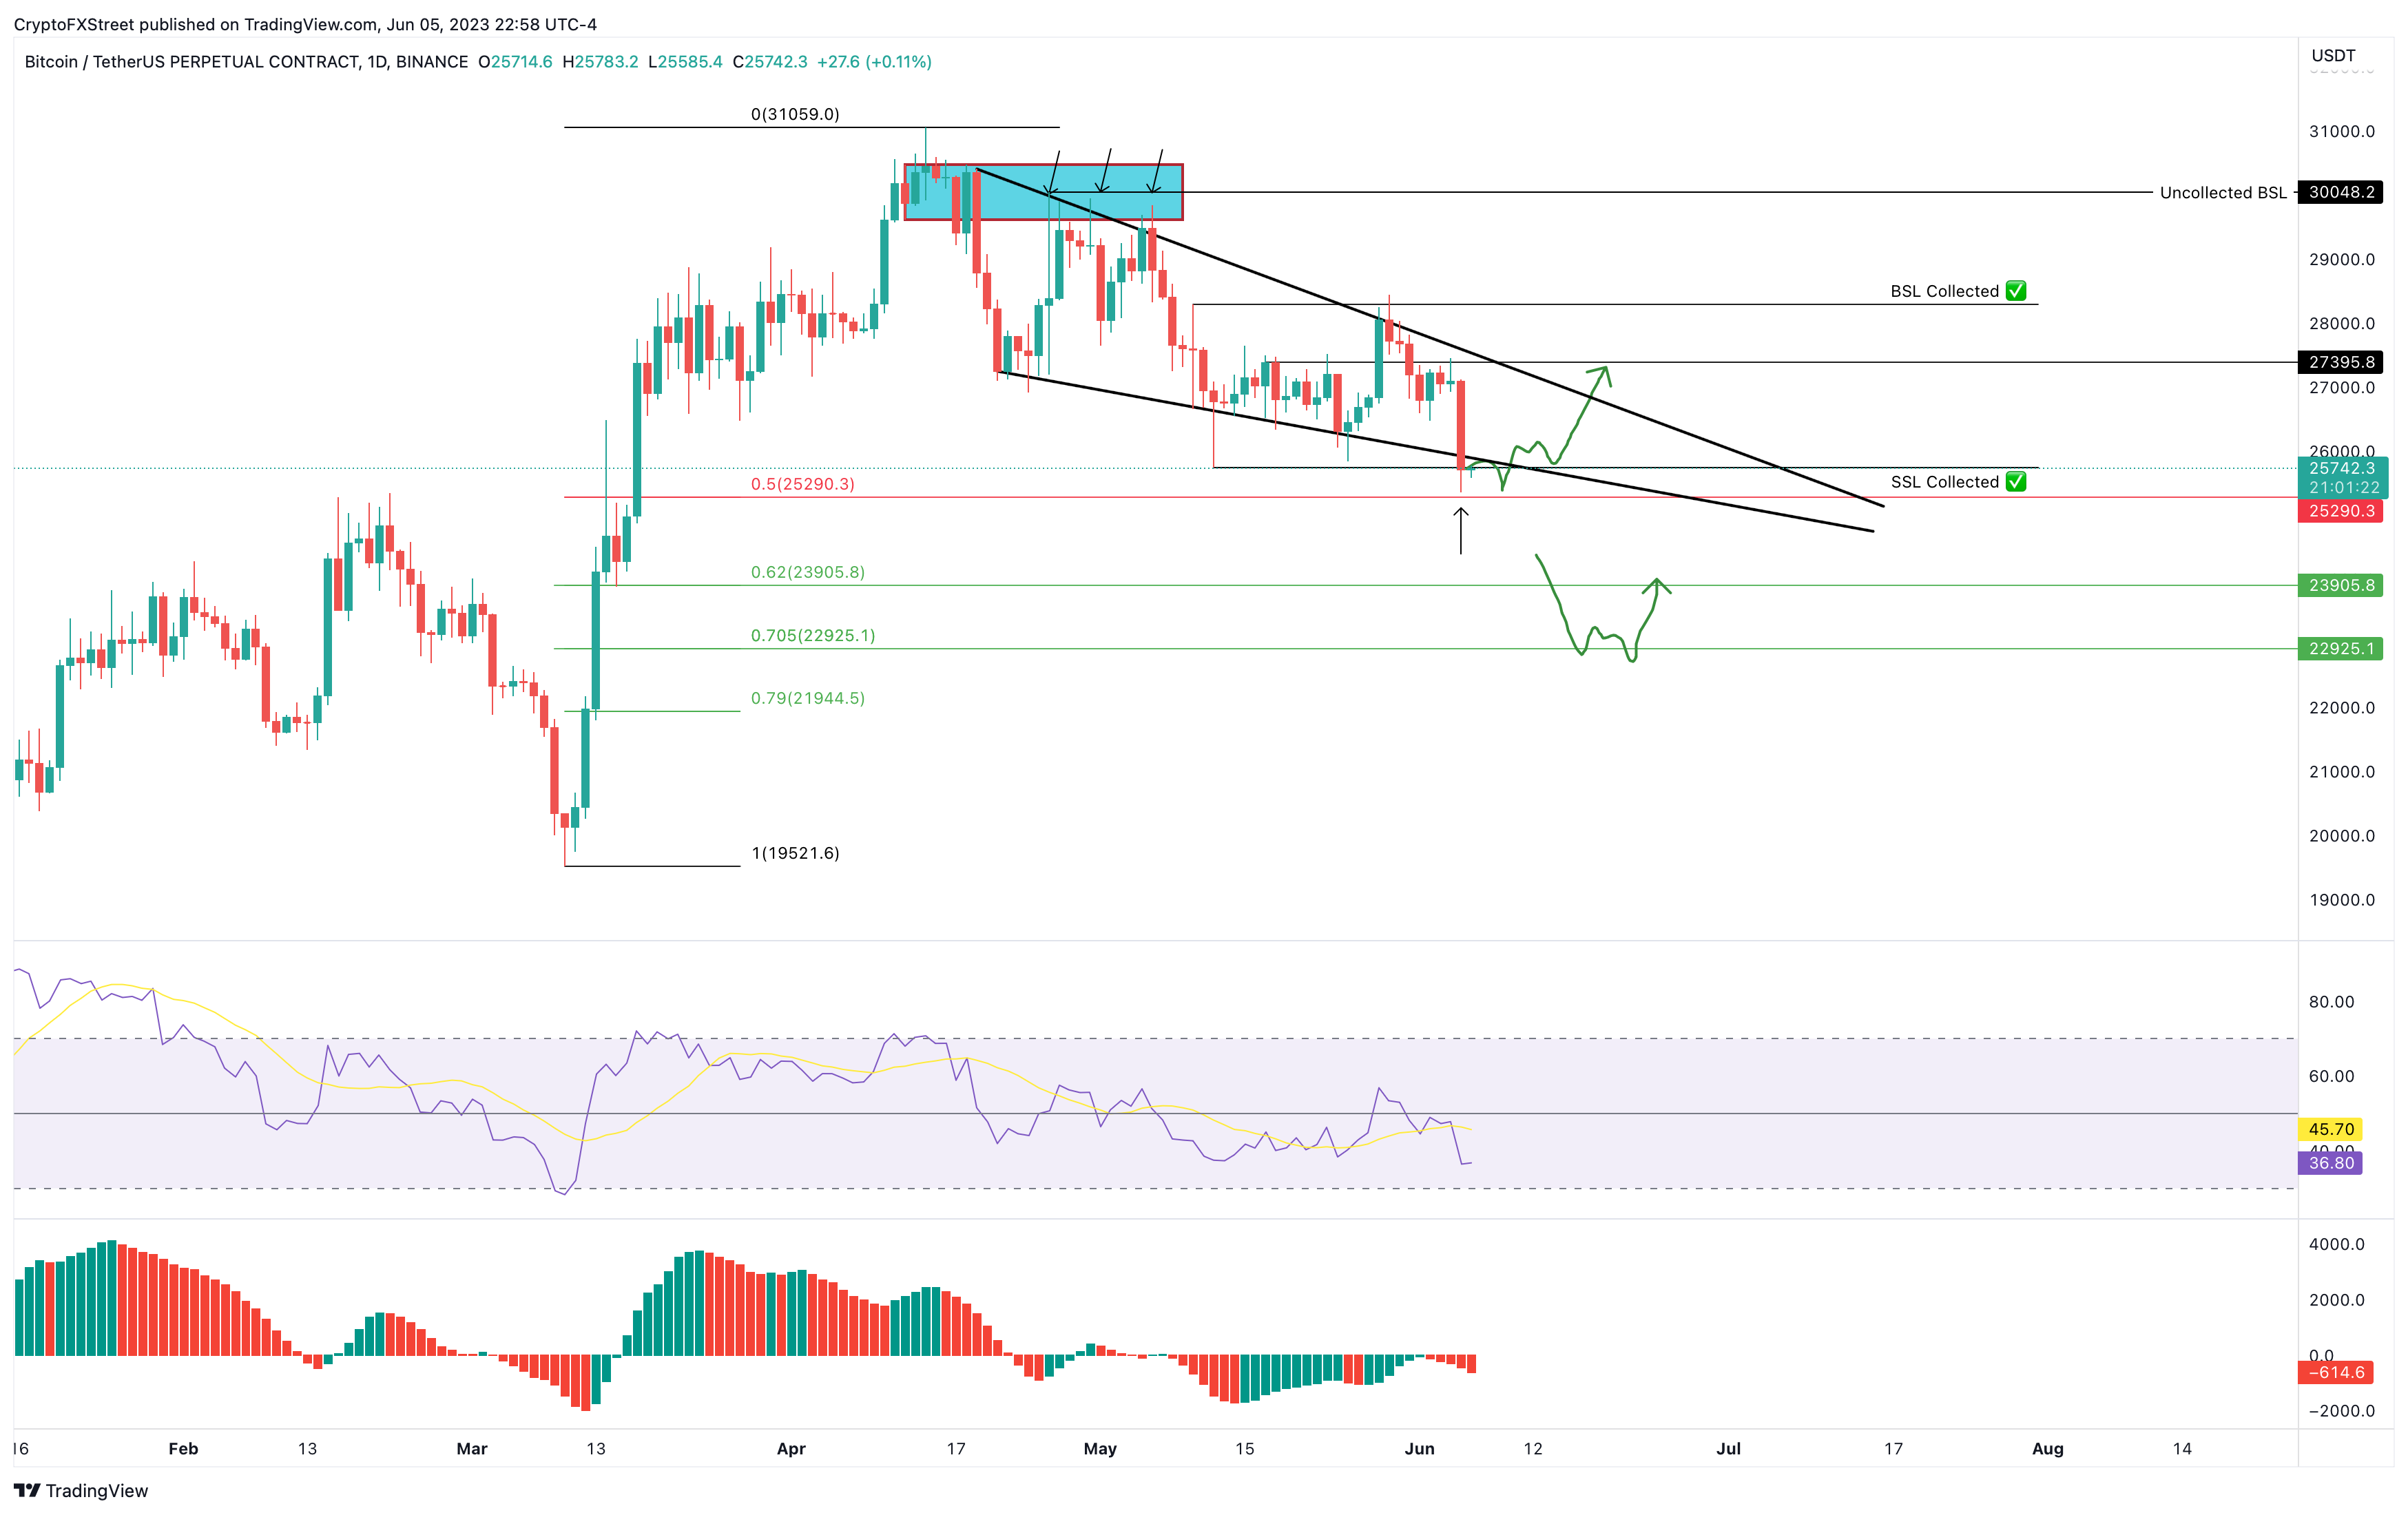
BTC/USD 1-day chart
A bearish case scenario for Bitcoin (BTC) price will include BTC sliding lower to retest the 62% and 70.5% retracement levels of the 59% rally at $23,905 and $22,925, respectively. While in the short-term, this move might seem bearish, a revisit to these levels will be an opportunity for long-term holders to accumulate BTC.
Read more: Bitcoin Weekly Forecast: BTC delays inevitable crash to $25,000
Ethereum price could dip lower before a bounce
Ethereum (ETH) price currently sits below a critical support level at $1,817, leaving investors guessing where it will head next. A recovery of ETH above the aforementioned level, combined with Bitcoin’s bounce, sounds plausible and could trigger a rebound rally for Ether.
If successful, Ethereum price could continue its ascent and target the $2,028 hurdle.
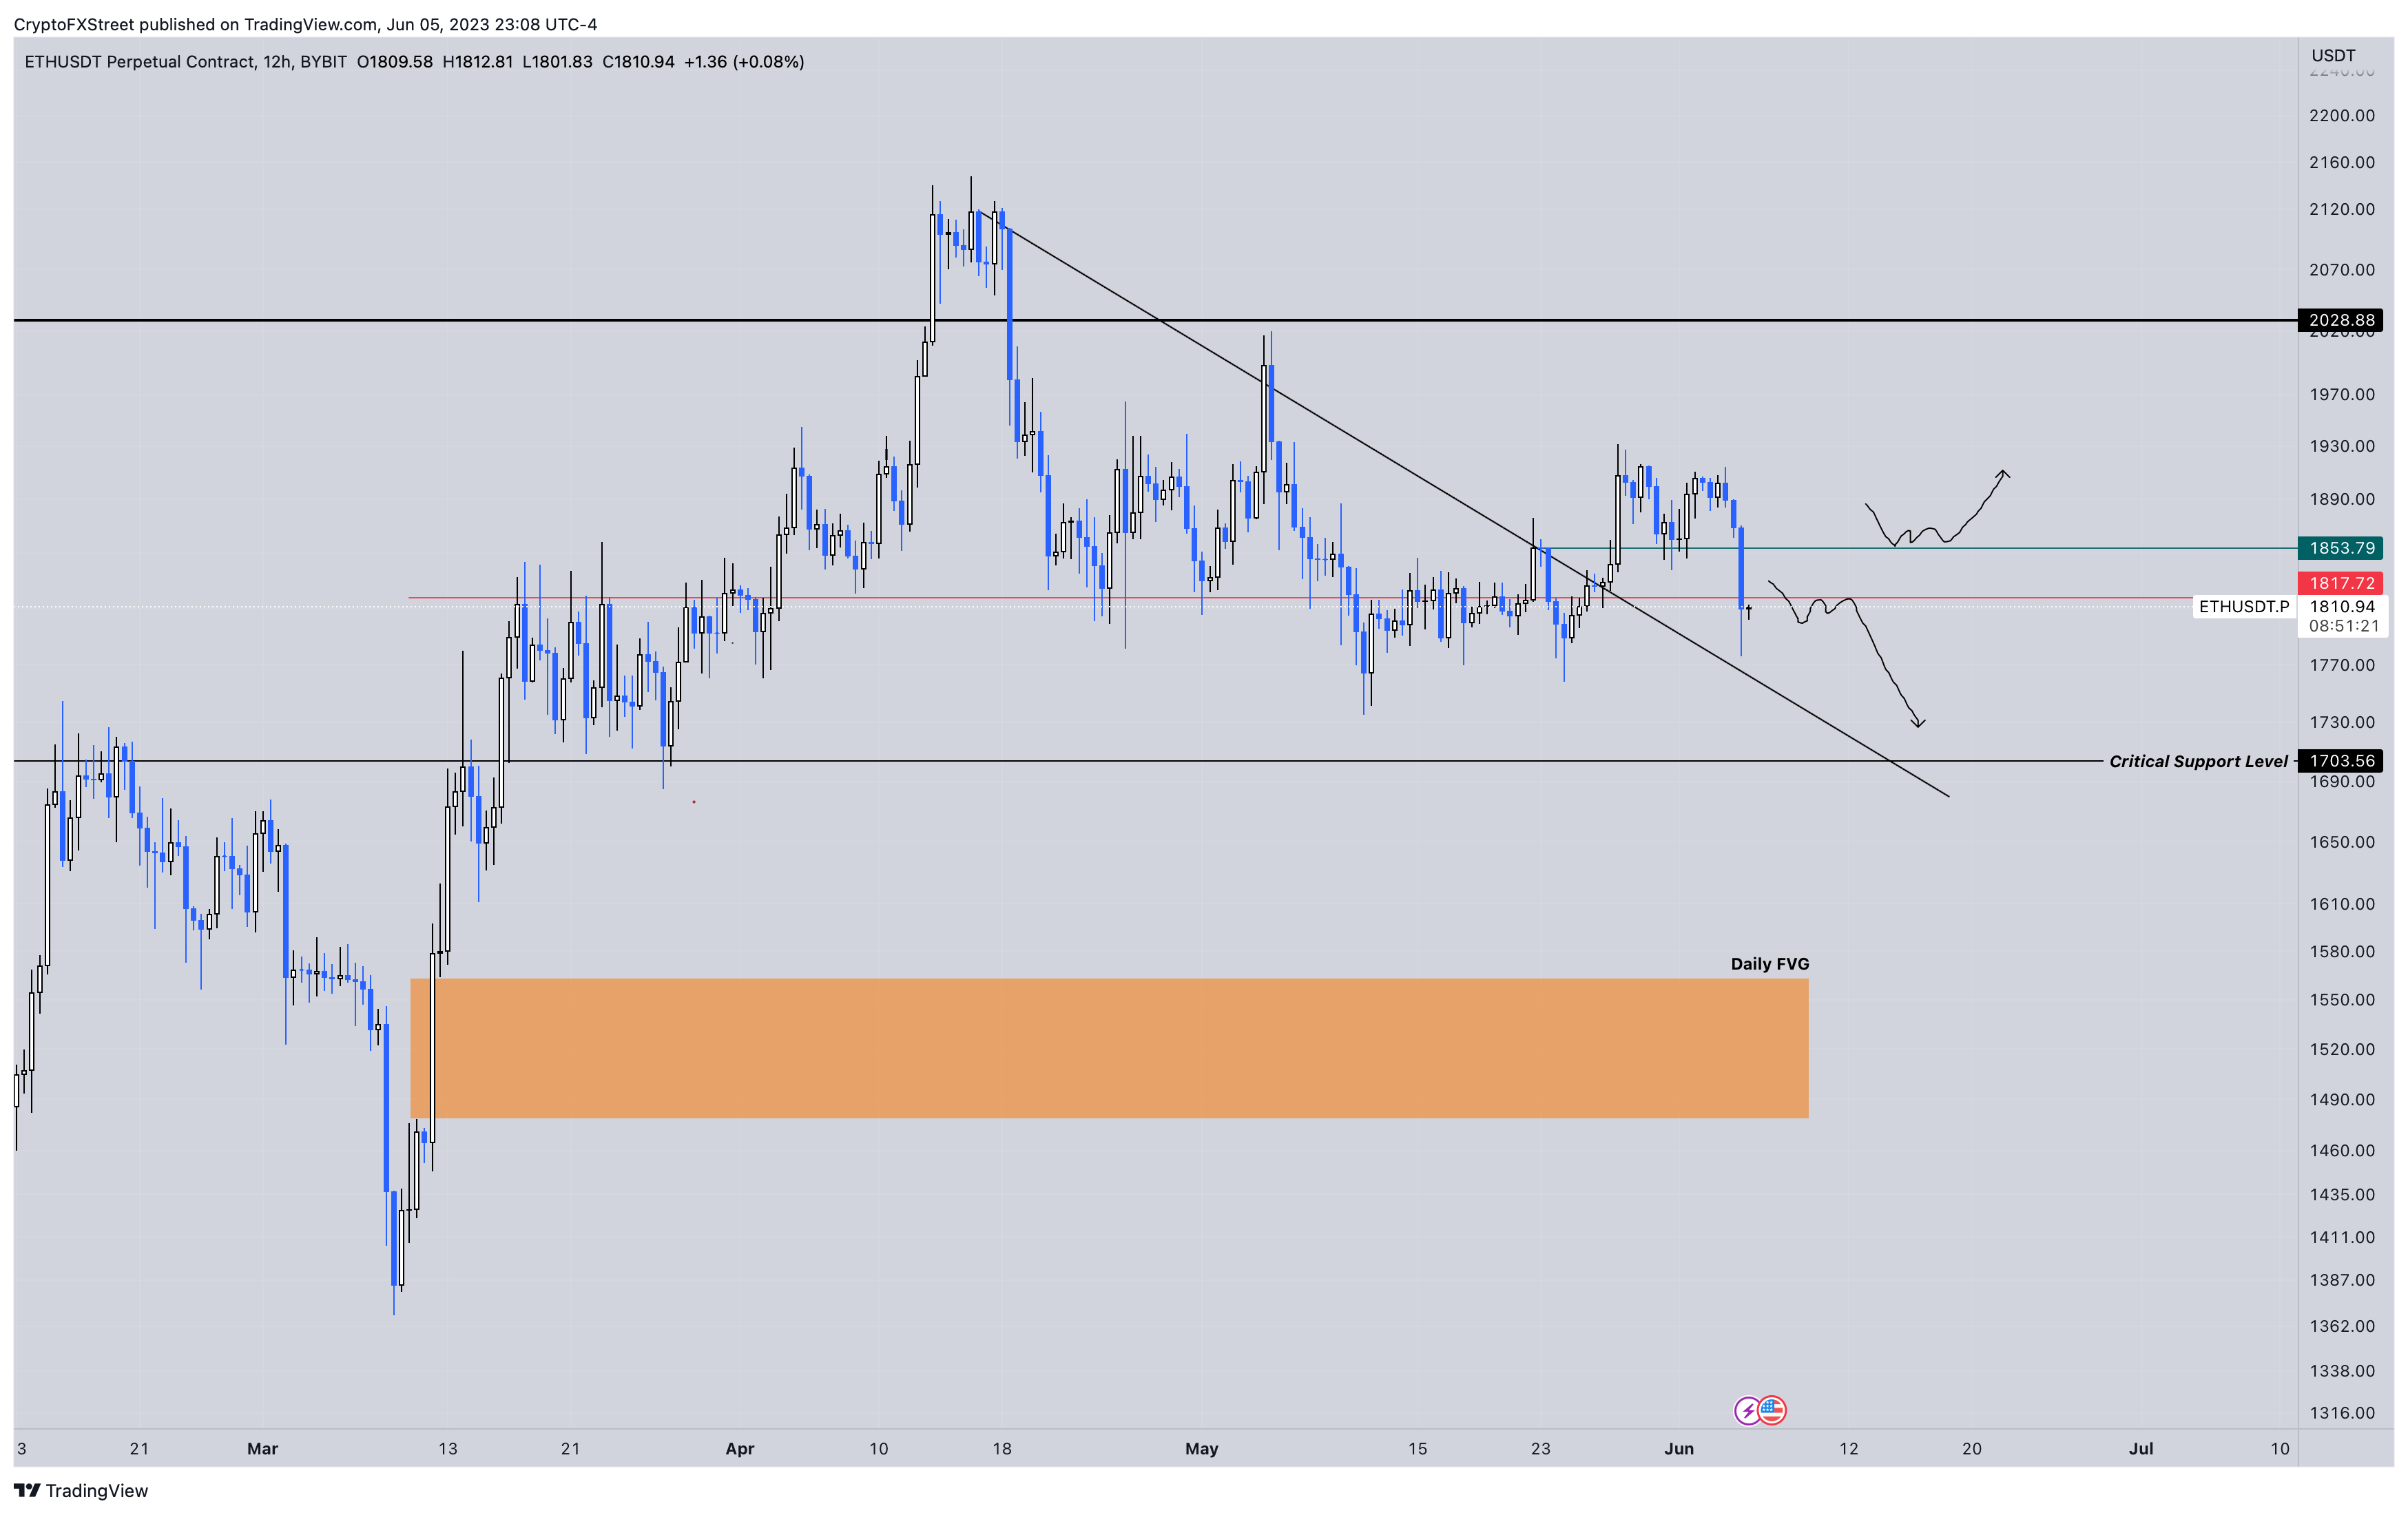
ETH/USD 12-hour chart
If the after-effects of the recent sell-off continue to impact the crypto markets, Ethereum (ETH) price could slide lower. In such a case, a retest of the $1,703 support level seems likely. The aforementioned level and the zone, extending from $1,563 to $1,478, are places where long-term holders are likely to accumulate ETH.
Read more: Ethereum exchange supply hits multi-year lows, VanEck analysts predict a rally to $11,800
Ripple price to move sideways before revealing its move
Ripple (XRP) price has successfully hit targets of the inverse head-and-shoulders, as forecasted in previous publications. The recent sell-off pushed the XRP price into an inefficiency above the $0.483 support level.
Going forward, Ripple price is likely to consolidate between the $0.483 and $0.515 support levels before making a move to the upside. A successful flip of the $0.515 hurdle is likely to trigger a sweep of the $0.548 hurdle to collect the buy-side liquidity.
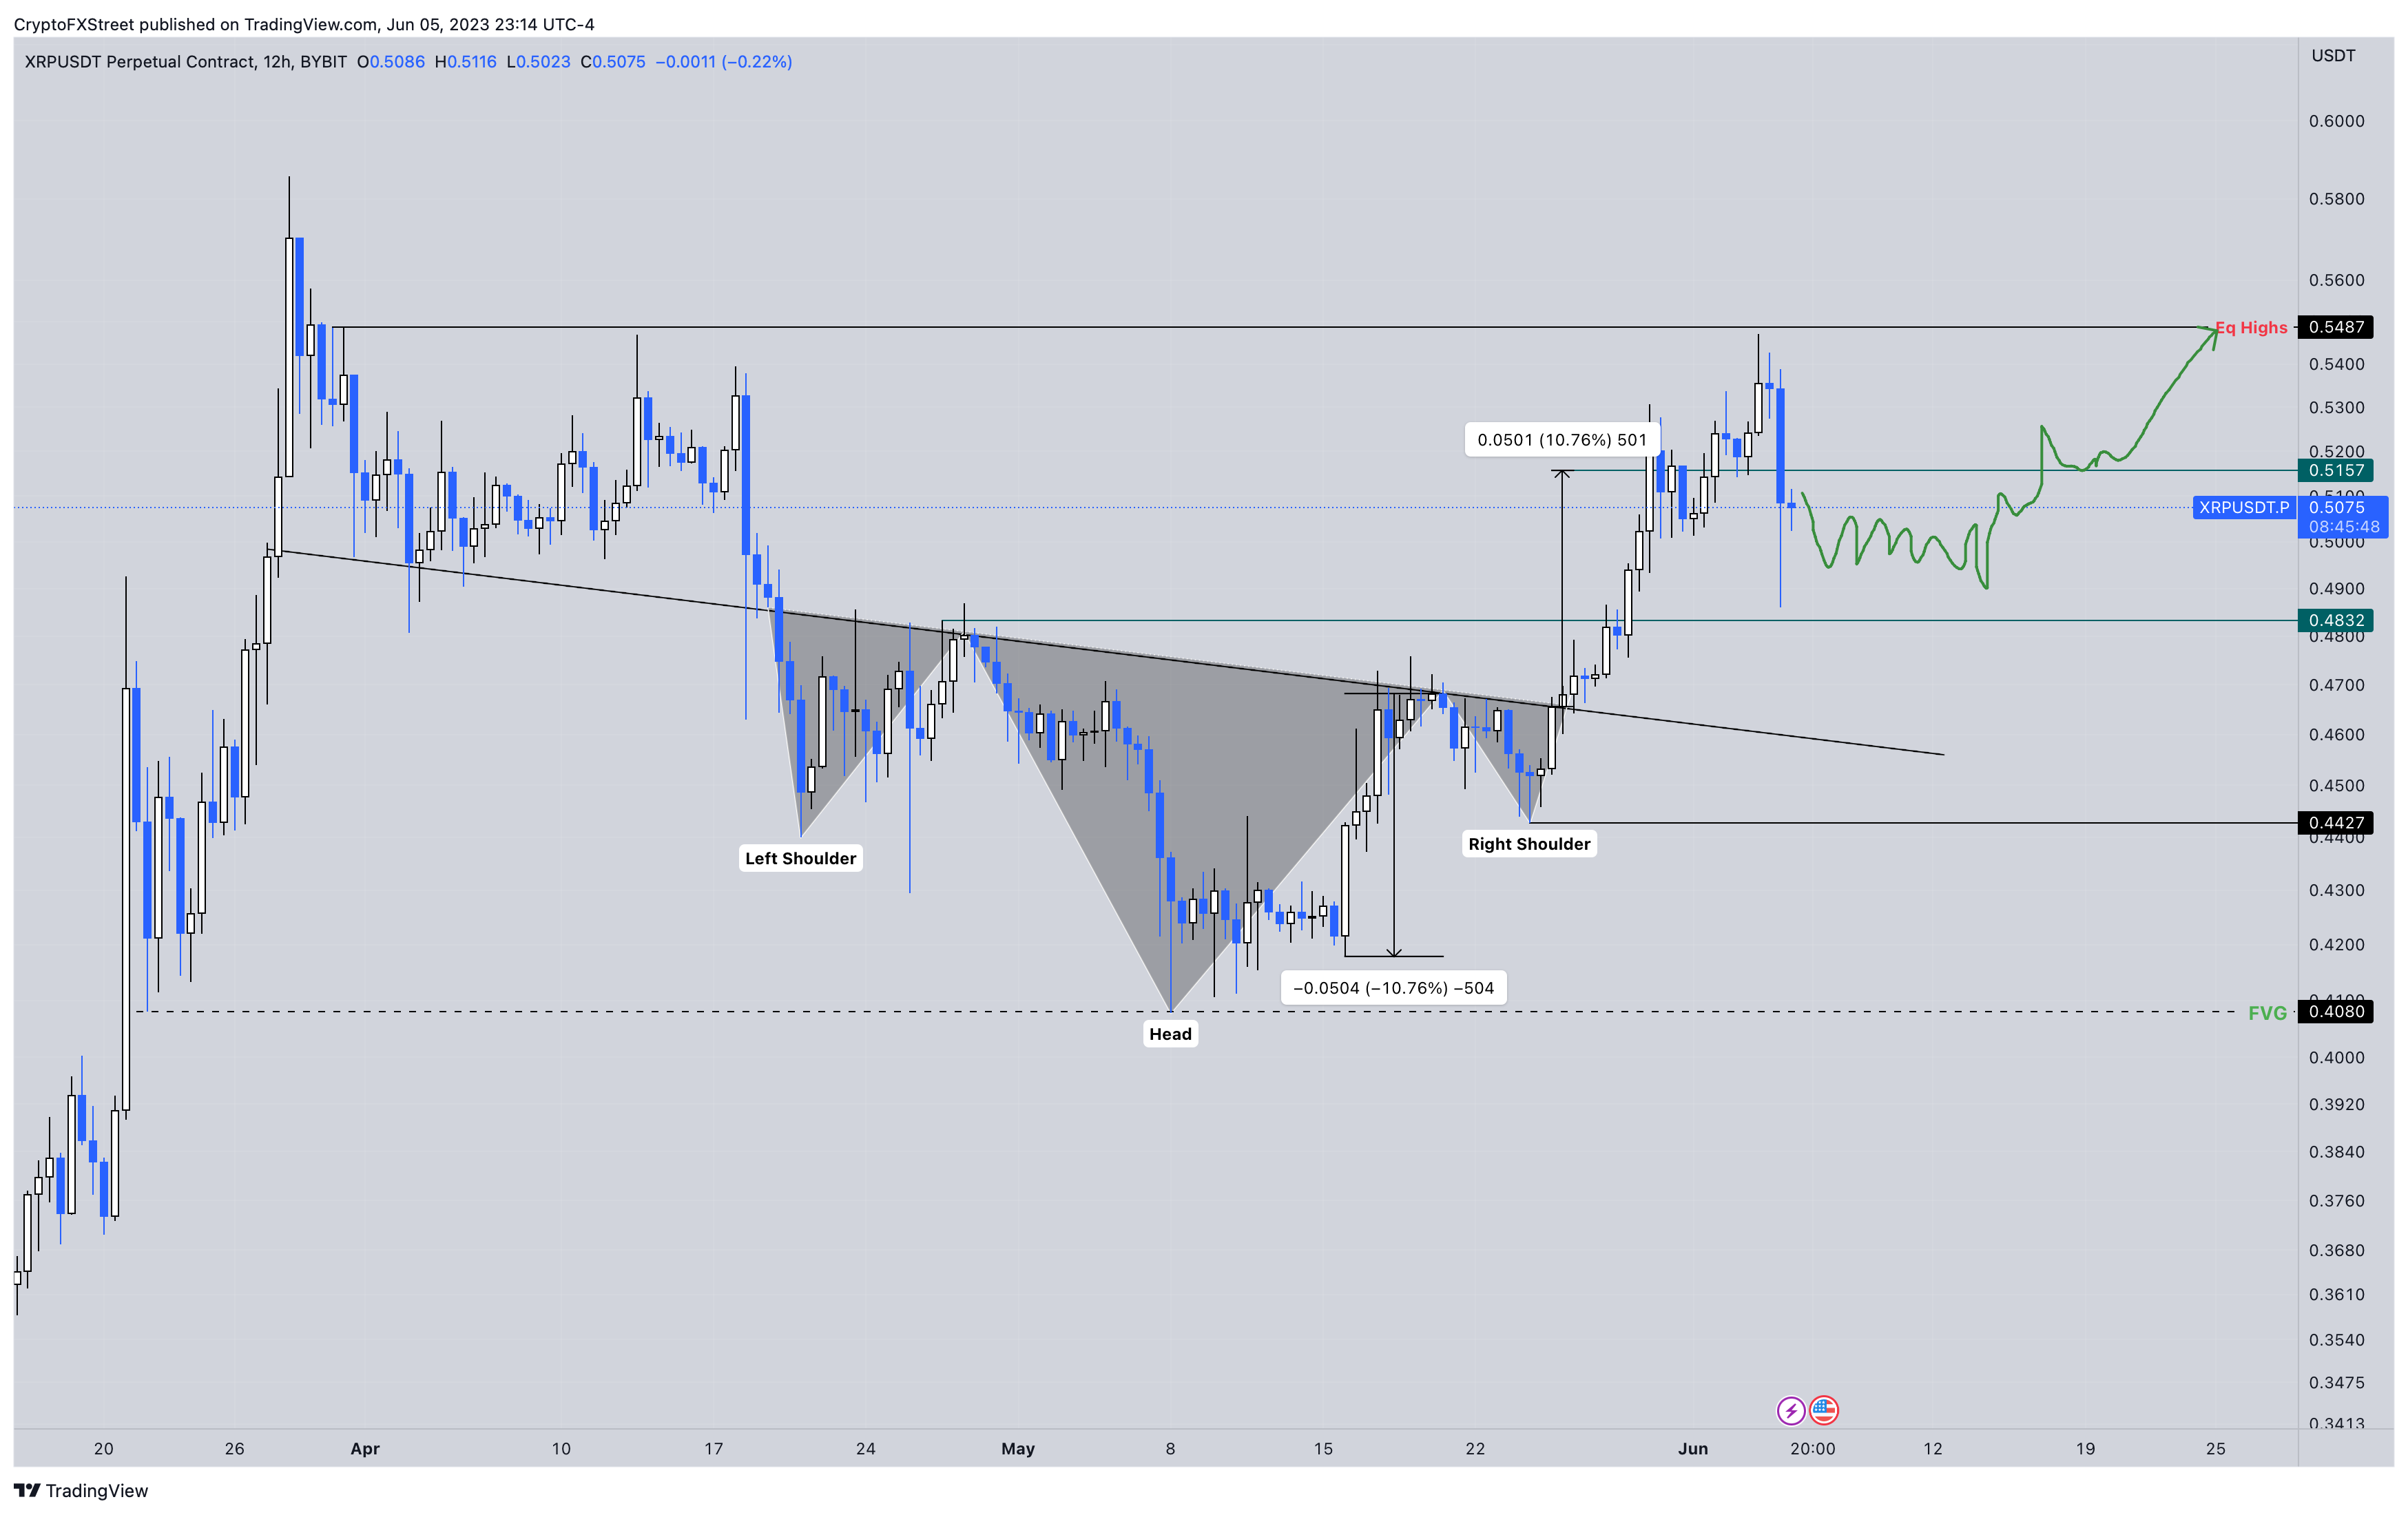
XRP/USD 12-hour chart
A failure to move higher after consolidation will signal a waning bullish momentum for Ripple (XRP) price. In such a case, a breakdown of the $0.483 support floor will be the obvious outcome. A further spike in selling pressure could send XRP down to retest the $0.466 barrier.
Author

Akash Girimath
FXStreet
Akash Girimath is a Mechanical Engineer interested in the chaos of the financial markets. Trying to make sense of this convoluted yet fascinating space, he switched his engineering job to become a crypto reporter and analyst.


