Top 3 Price Prediction: Bitcoin, Ethereum, Ripple in the green despite US CPI announcement

Update: US inflation rate hit 9.1% and despite bearish sentiments in the financial markets, Bitcoin, Ethereum and Ripple prices are in the green. CPI data is key to the cryptocurrency market as the Fed is battling hard inflation with heavy interest rate hikes, and the risk of recession is growing, in turn damaging capital inflow to crypto assets. Both the S&P 500 and tech-heavy Nasdaq suffered a decline from the Federal Reserve’s monetary policy tightening and cryptocurrencies act in a similar way.
The cryptocurrency market recovered from the decline in market capitalization after rising 5% over the past 24 hours. Bitcoin price climbed to $19,880, recovering from its six month low at the $19,047 level.
If Bitcoin price flips $20,300, analysts have predicted a climb to the $21,600 level. Altcoin Sherpa, a leading crypto analyst notes that overall Bitcoin price action is choppy, a failure to cross $20,300 could result in a drop to the $17,000 level.
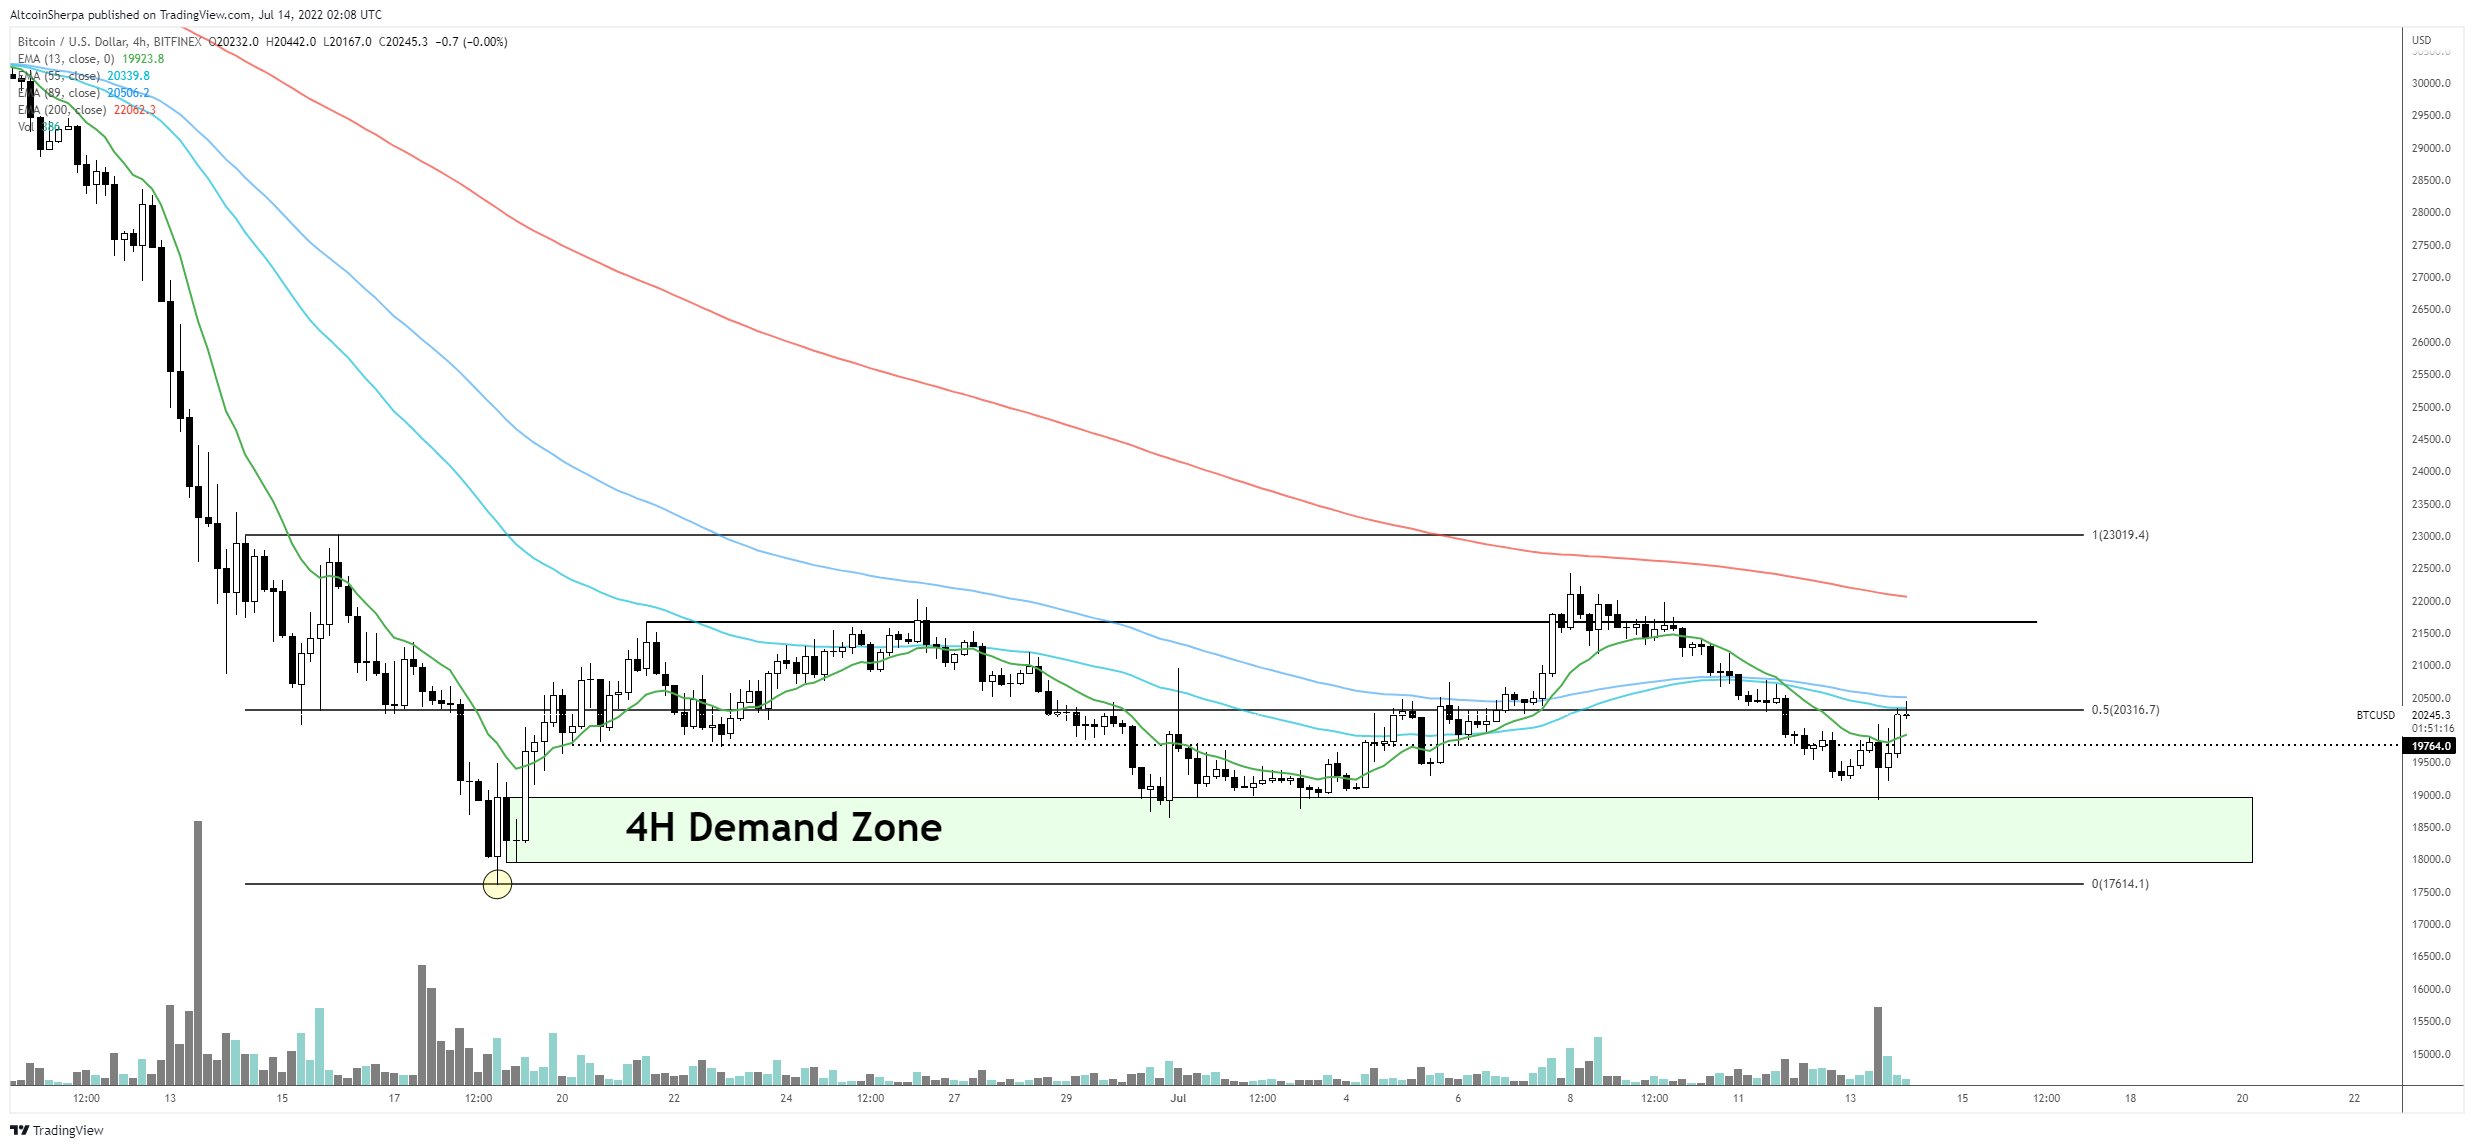
BTC-USD price chart
Ki Young Ju, CEO of CryptoQuant believes US CPI data is already reflected in Bitcoin price. The data release was therefore not an unpredicted black swan event, which typically result in mass inflow of Bitcoin to exchange wallets.
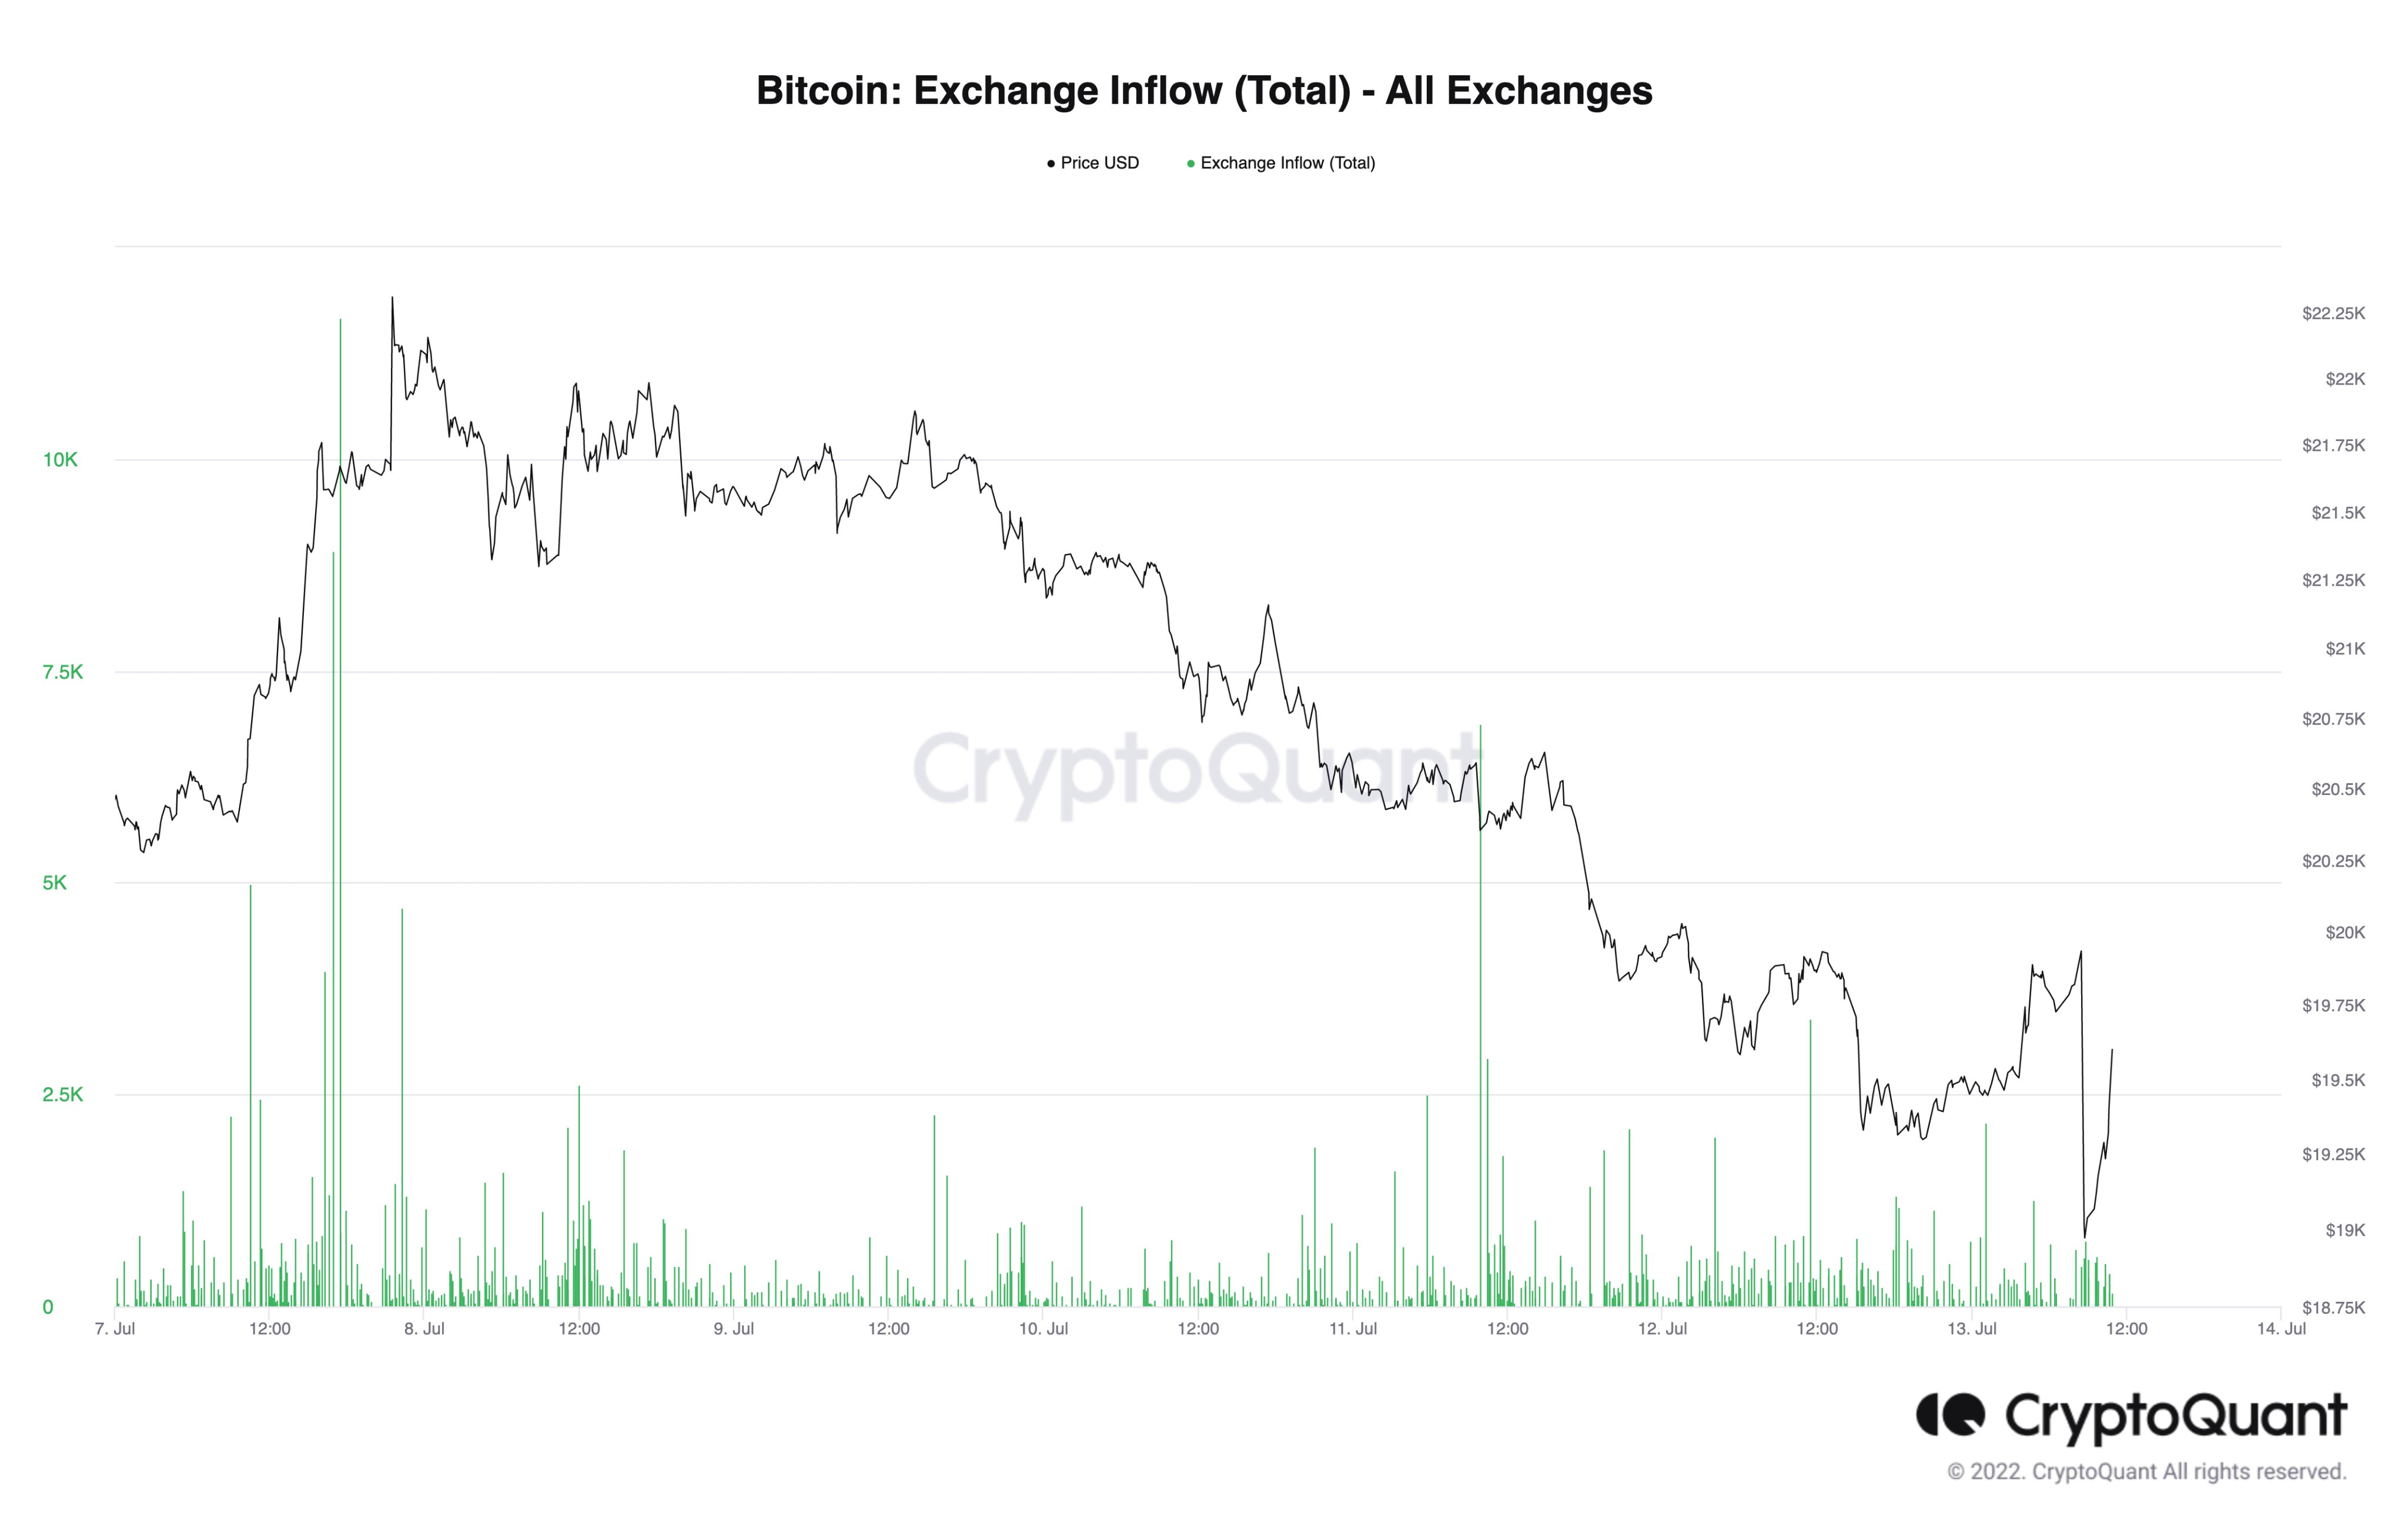
Bitcoin: Exchange Inflow (Total)
- Bitcoin price shows a bearish pennant breakout, hinting at a 42% crash to $11,202.
- Ethereum price looks to find a stable support floor to trigger a breakout of the $1,284 hurdle.
- Ripple price might revisit the four-hour demand zone, extending from $0.286 to $0.306, in an attempt to rally.
Bitcoin price has formed an extremely bearish setup that could trigger a sell-off not just for itself but the entire market as well. Adding credence to this outlook is the June month’s Consumer Price Index announcement that is scheduled to be released on Wednesday at 12.30 GMT.
The forecasts suggest that the CPI could be 8.8%. The last announcement was on June 10, when the actual CPI exceeded forecast, triggering a sell-off in Bitcoin price from roughly $30,000 to $17,600.
Hence, investors need to pay close attention to today’s announcement and how BTC could react to it.
Bitcoin price reveals a bearish outlook
Bitcoin price action between June 6 and July 13 seems to have formed a bearish pennant. This technical formation contains a flagpole and a pennant and is termed a continuation pattern.
The 42% sell-off between June 6 and June 18, which pushed BTC to form a swing low at $17,591, forms the flagpole. And the consolidation that followed in the form of lower highs and higher lows is termed a pennant.
This setup forecasts a 42% downswing to $11,202, obtained by adding the flagpole’s height to the breakout point at $19,623, which occurred on July 12. This development adds confirmation to the bearish future for BTC.
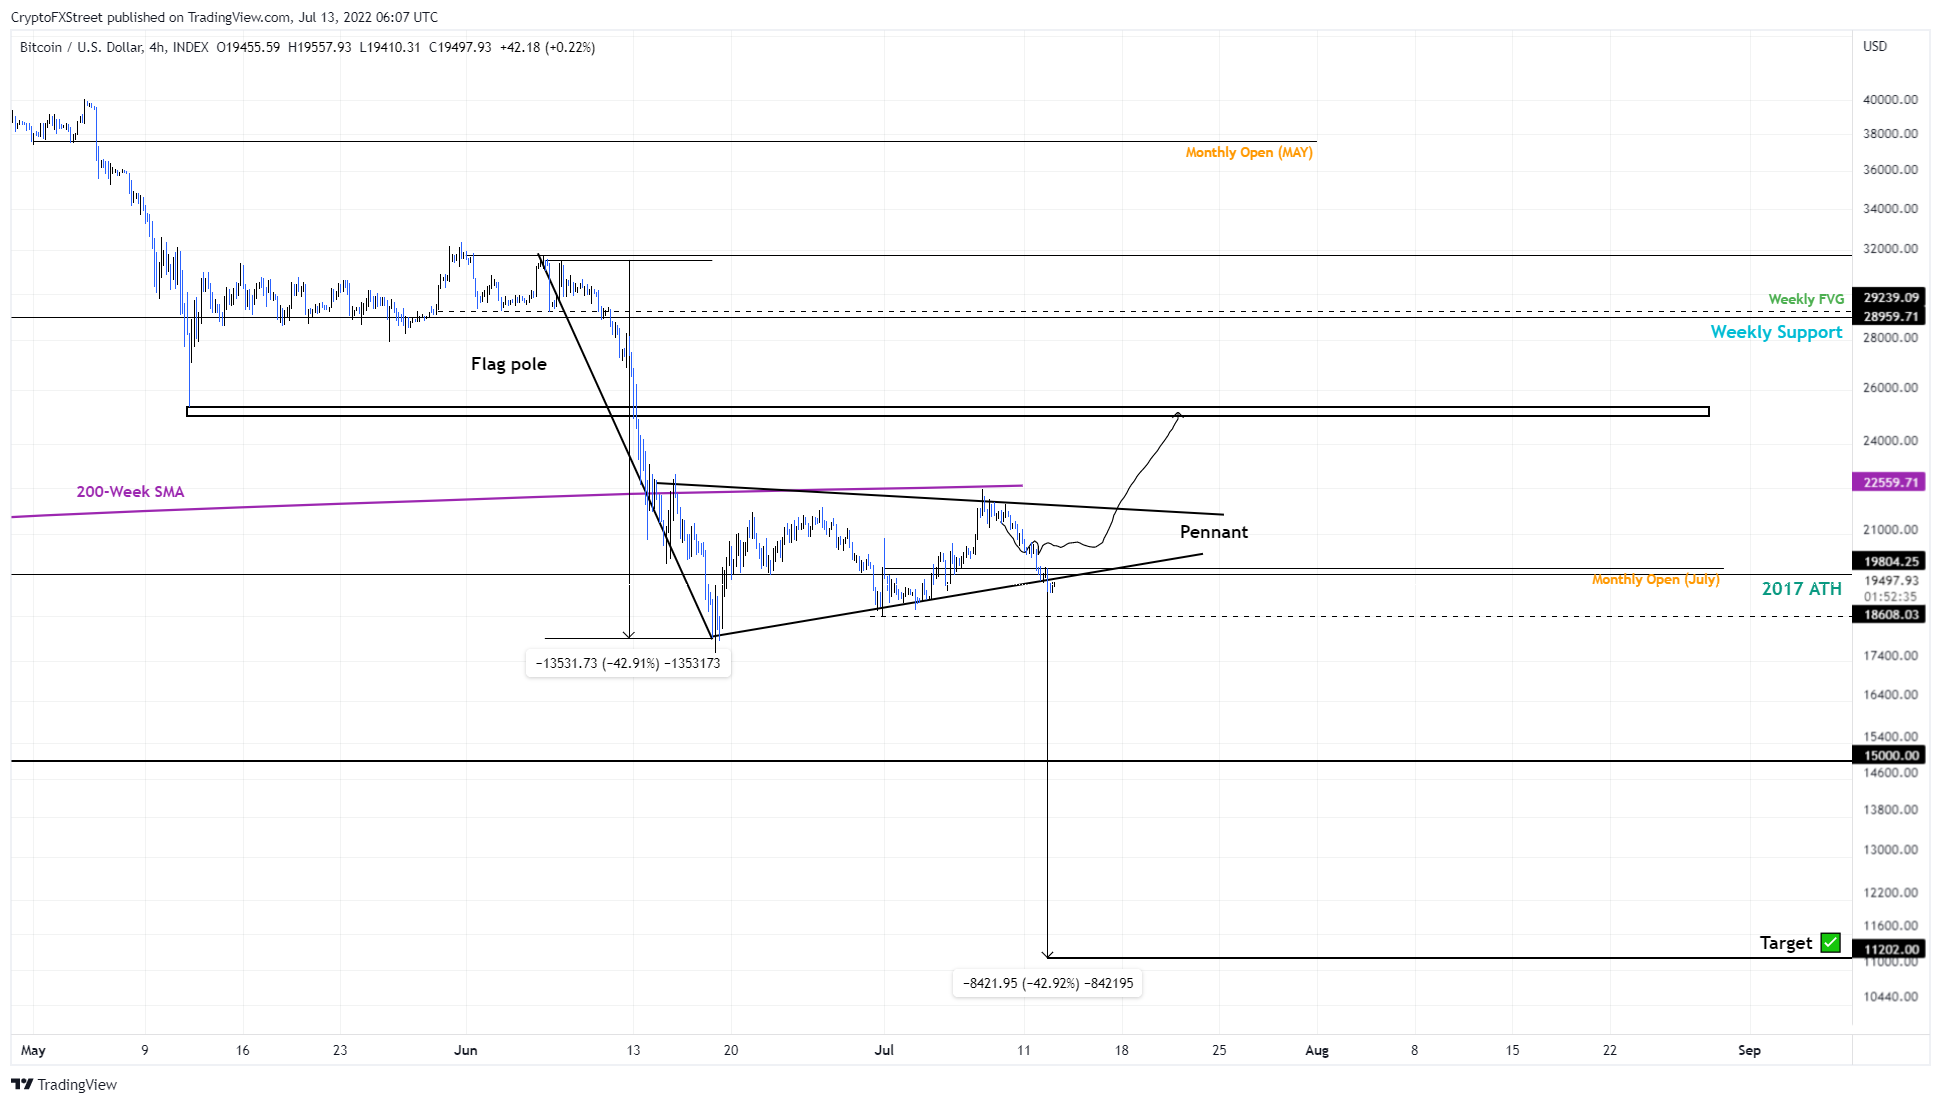
BTC/USD 1-day chart
While things are looking gloomy for Bitcoin price, a quick recovery above $22,559 – the 200-week Simple Moving Average (SMA) – will invalidate this bearish pennant formation. In such a case, investors can expect BTC to attempt a move to $25,000.
Ethereum price in search of stable floors
Ethereum price has crashed below the midpoint of the $878-to-1,284 range at $1,081. This move is the third rejection at the equal highs formed at $1,284. Interestingly, the third rejection was also due to the presence of the 200 four-hour SMA.
A recovery attempt above the midpoint seems like a plausible attempt from bulls. However, rejection appears to be more likely considering the way Bitcoin price is positioned.
In such a case, investors can expect ETH to revisit the range low at $878.
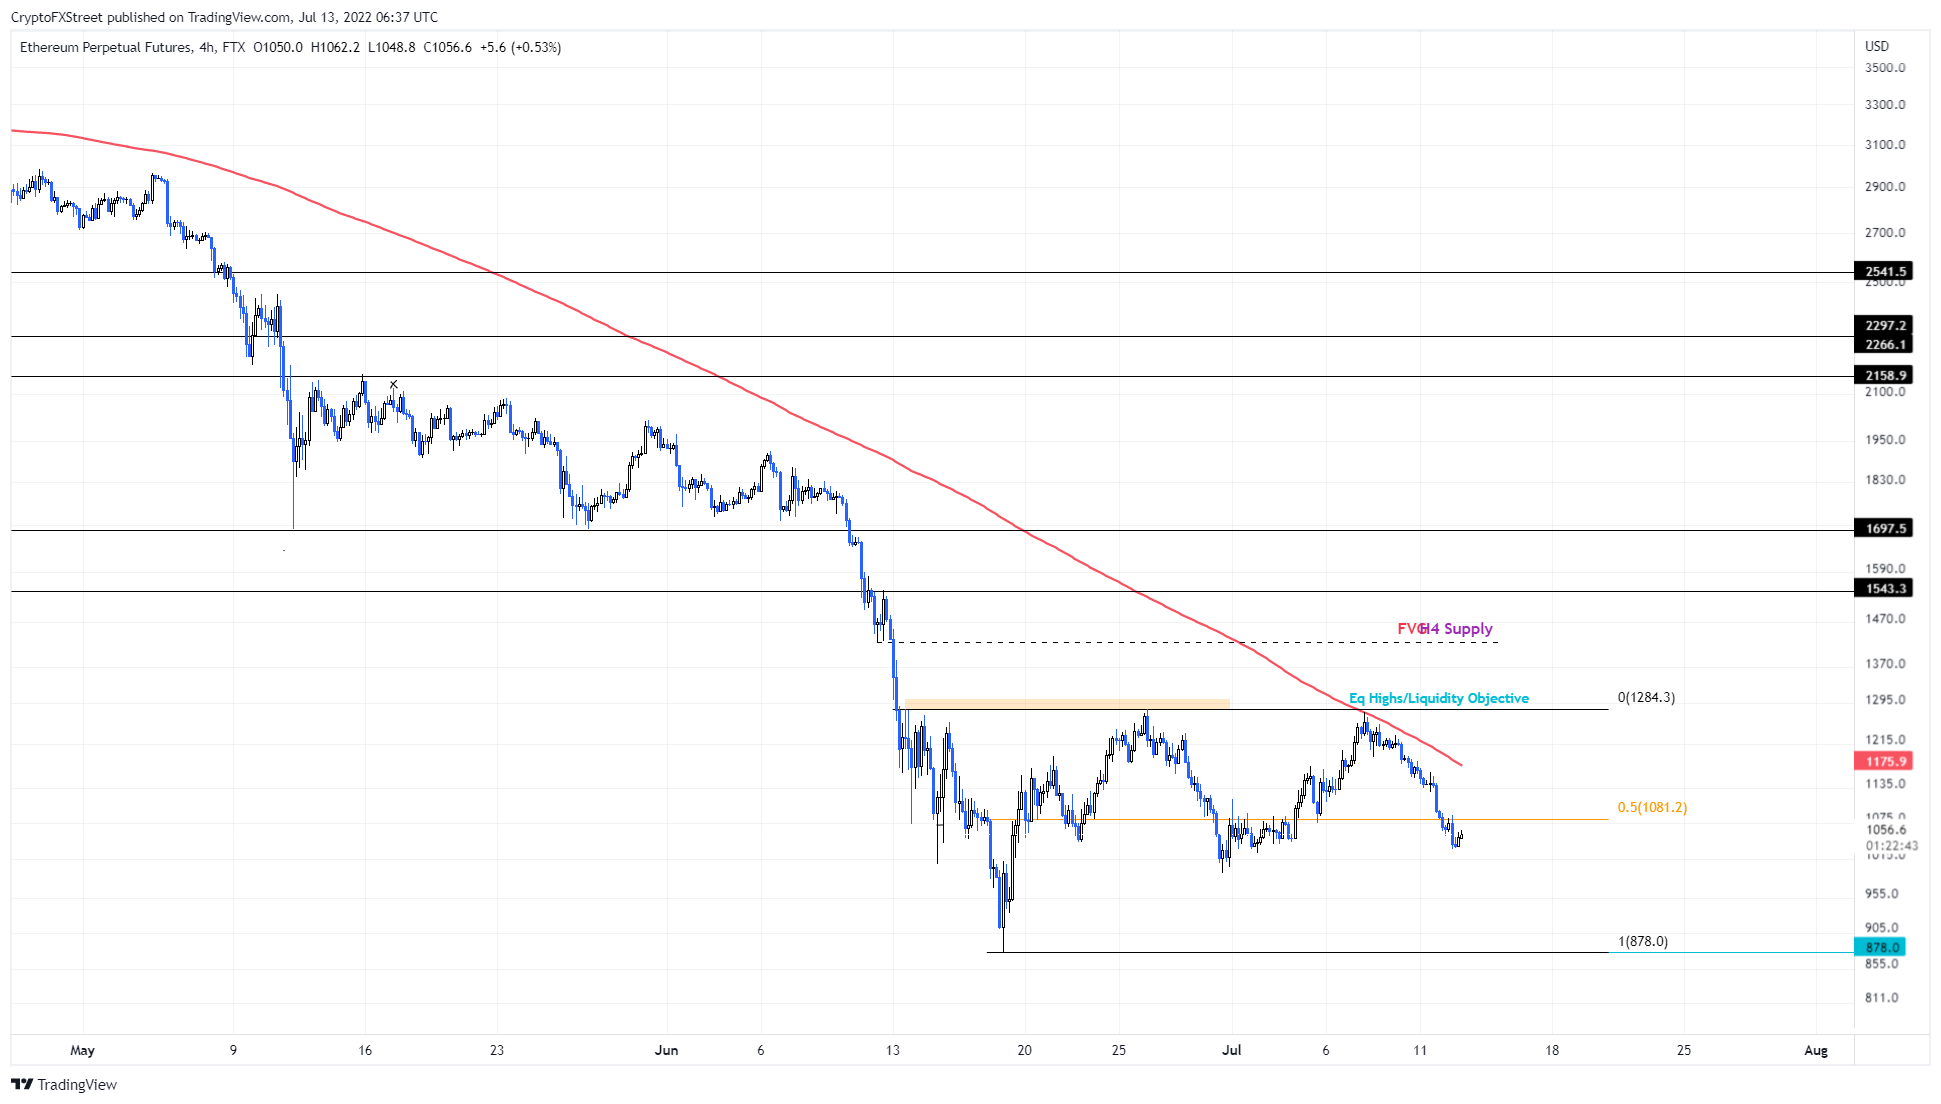
ETH/USD 1-day chart
Regardless of the pessimistic outlook, if Ethereum price produces a daily candlestick close above the range high of $1,284, it will invalidate the bearish outlook and trigger a potential ascent to $1,500 or higher.
Ripple price to continue within downtrend
Ripple price is hovering below the high-time-frame support level at $0.332, after weeks of consolidation. A confirmation of a flip of this foothold into a resistance barrier is most likely to trigger a 40% crash to the volume point of control (POC) at $0.187.
A POC is the highest-volume traded level; for Ripple, the volume profile extends from January 2017 to July 2022. Hence, a retest of the level should see some buyers come in and rescue the token.
However, a breakdown of said barrier could extend the sell-off to $0.134.
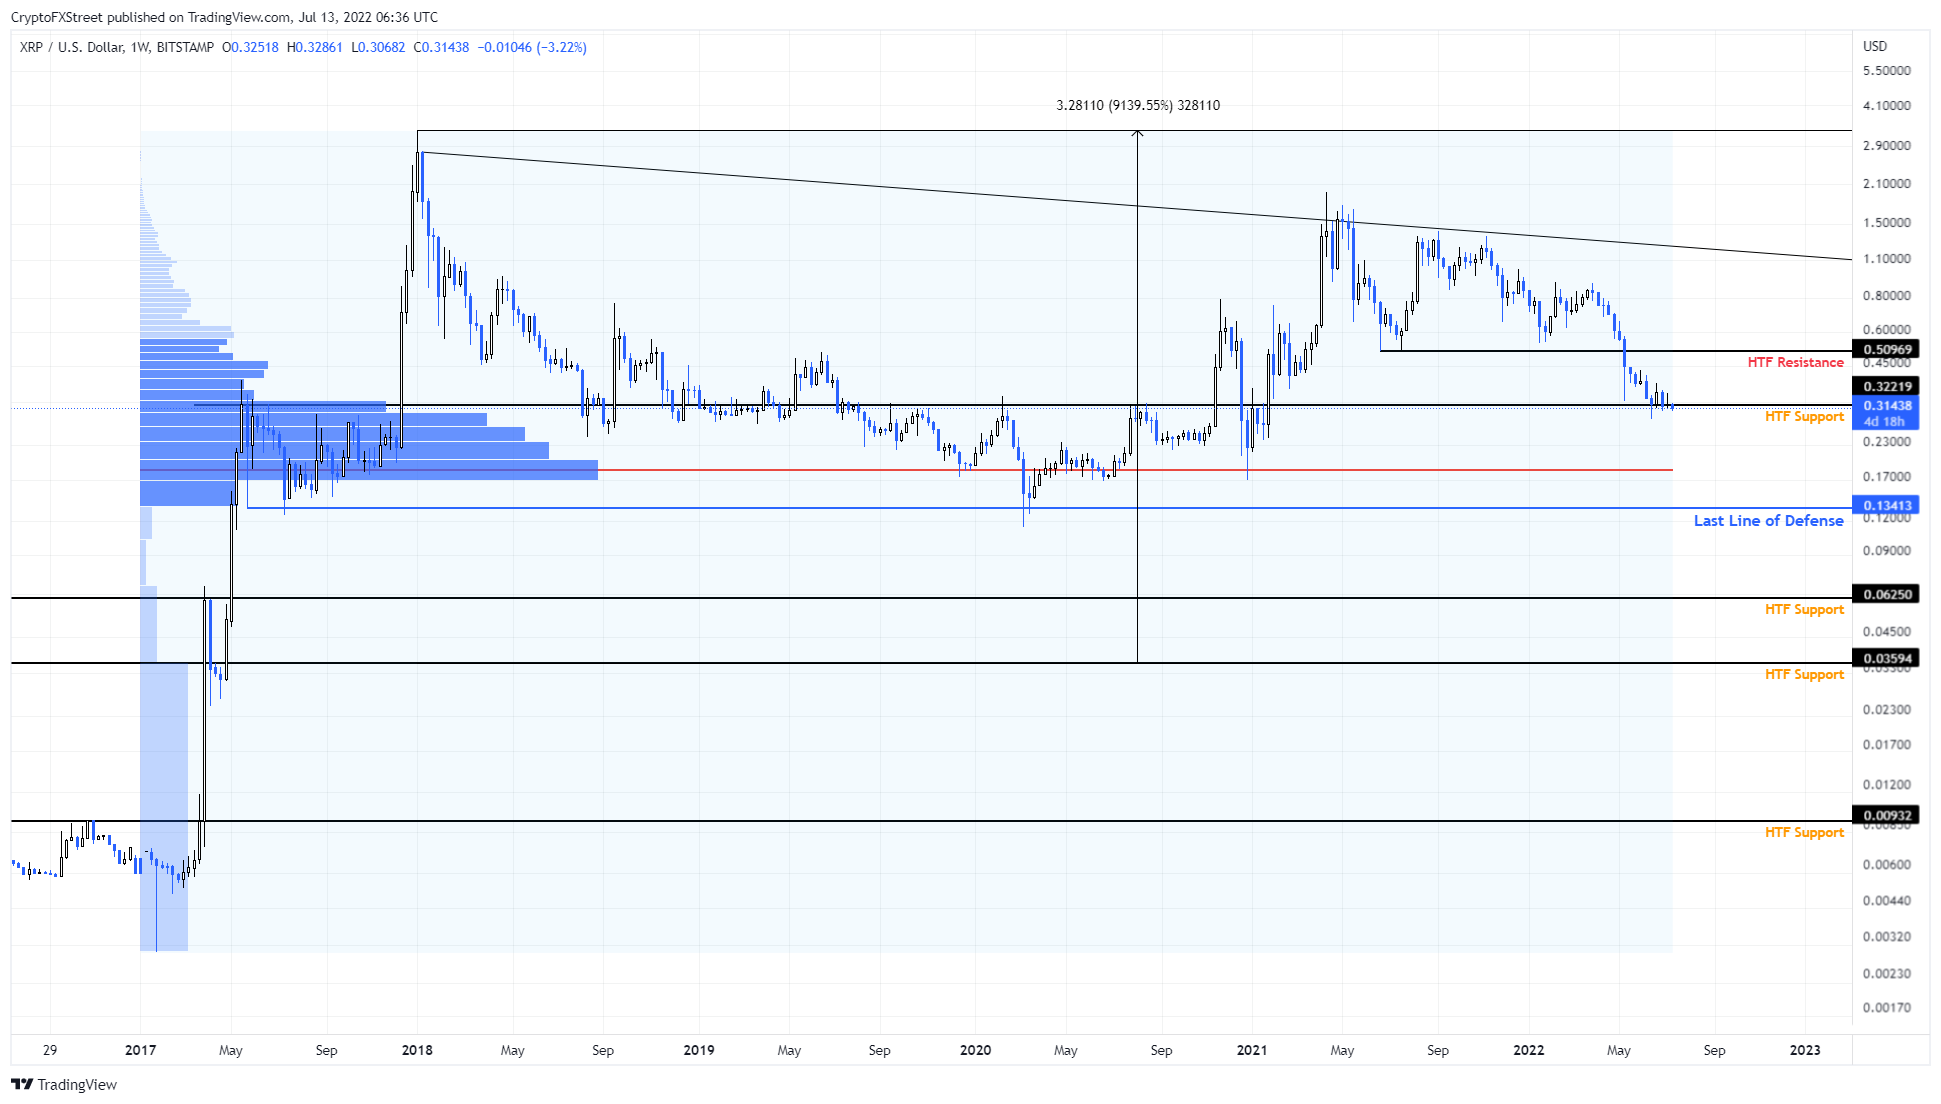
XRP/USD 1-day chart
On the other hand, if Ripple price produces a weekly candlestick close above $0.322, it will alleviate the bearish outlook. However, to invalidate this scenario, XRP price needs to flip the $0.509 hurdle into a support floor.
Author

Akash Girimath
FXStreet
Akash Girimath is a Mechanical Engineer interested in the chaos of the financial markets. Trying to make sense of this convoluted yet fascinating space, he switched his engineering job to become a crypto reporter and analyst.


