Top 3 Price Prediction Bitcoin, Ethereum, Ripple: BTC to 100k or pullback to 78k?
- Bitcoin price reaches a new all-time high of $93,265 on Wednesday and declines slightly.
- Ethereum's price is approaching its crucial support level of $3,000; a close below would cause a price decline further.
- Ripple price is nearing its key resistance level of $0.854; a rejection would lead to a decline.

Bitcoin (BTC) and Ethereum (ETH) showed a modest recovery on Friday following Thursday's downturn, yet momentum indicators suggest continuing the decline as signs of bull exhaustion emerge. Ripple (XRP) is approaching a key resistance level, with a potential rejection likely leading to a decline ahead.
Bitcoin bulls show signs of exhaustion
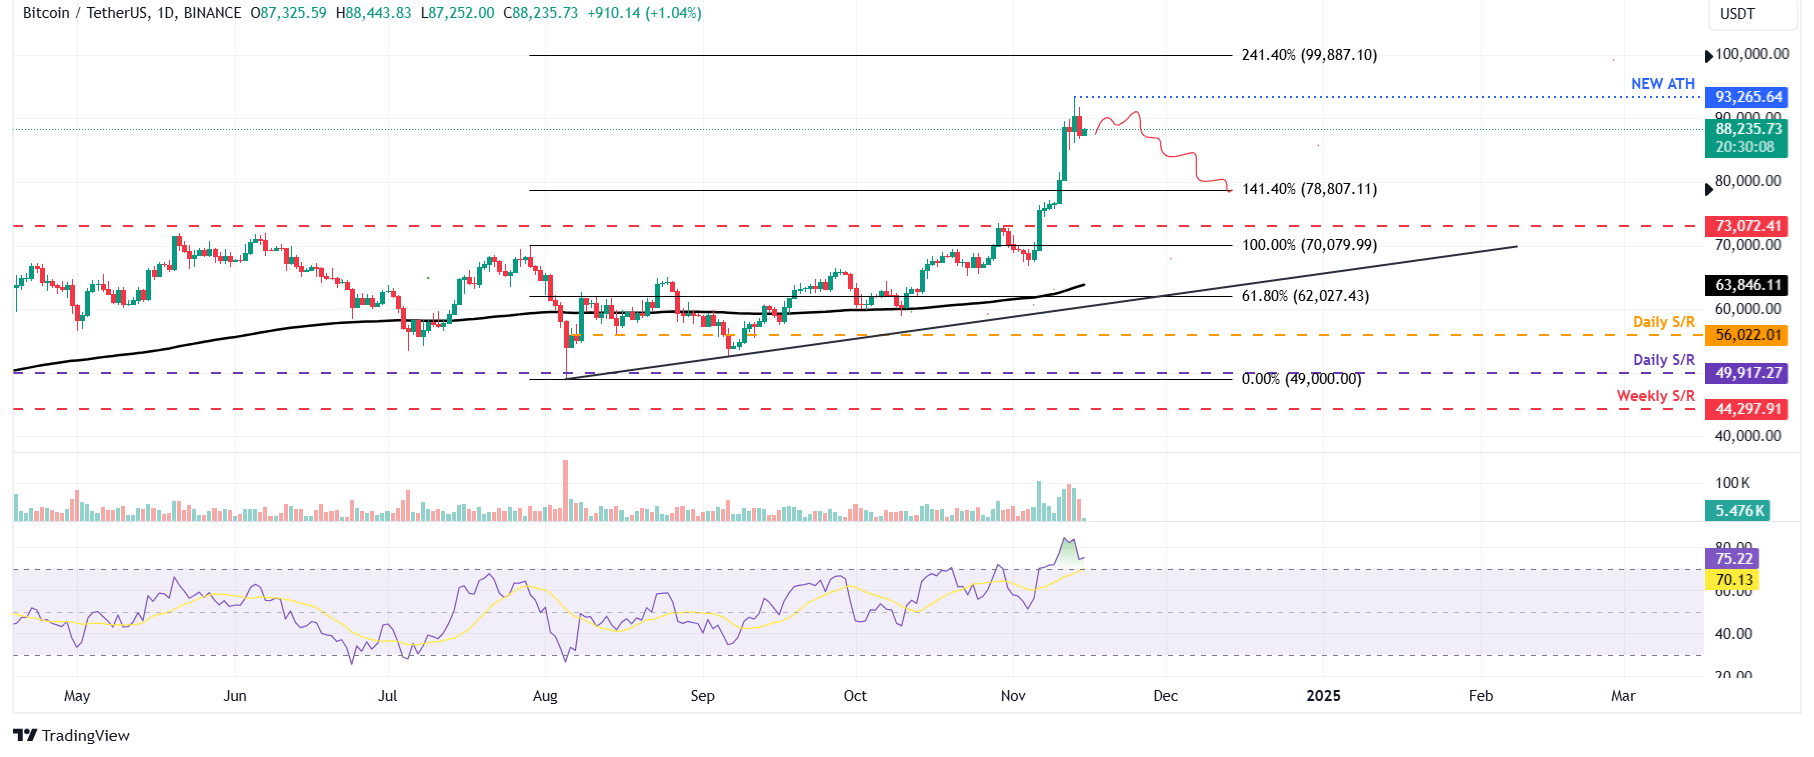
Bitcoin price reached a new all-time high of $93,265 on Wednesday and declined 3.3% on Thursday. At the time of writing on Friday, it trades slightly above around $88,200.
The Relative Strength Index (RSI) also stands at 75, well above its overbought level of 70. It points downwards, signaling increasing risk. Traders should exercise caution when adding to their long positions, as a move out of the overbought territory by the RSI could provide a clear sign of a pullback.
If BTC faces a corrective pullback, it could decline 10.6% from its current position and retest its $78,807 support level.
BTC/USDT daily chart
Conversely, if the bulls continue the upward momentum, the rally could extend to retest its 241.40% Fibonacci extension level at $99,887, drawn from July’s high of $70,079 to August’s low of $49,000.
Ethereum price is poised for a decline if it closes below $3,000
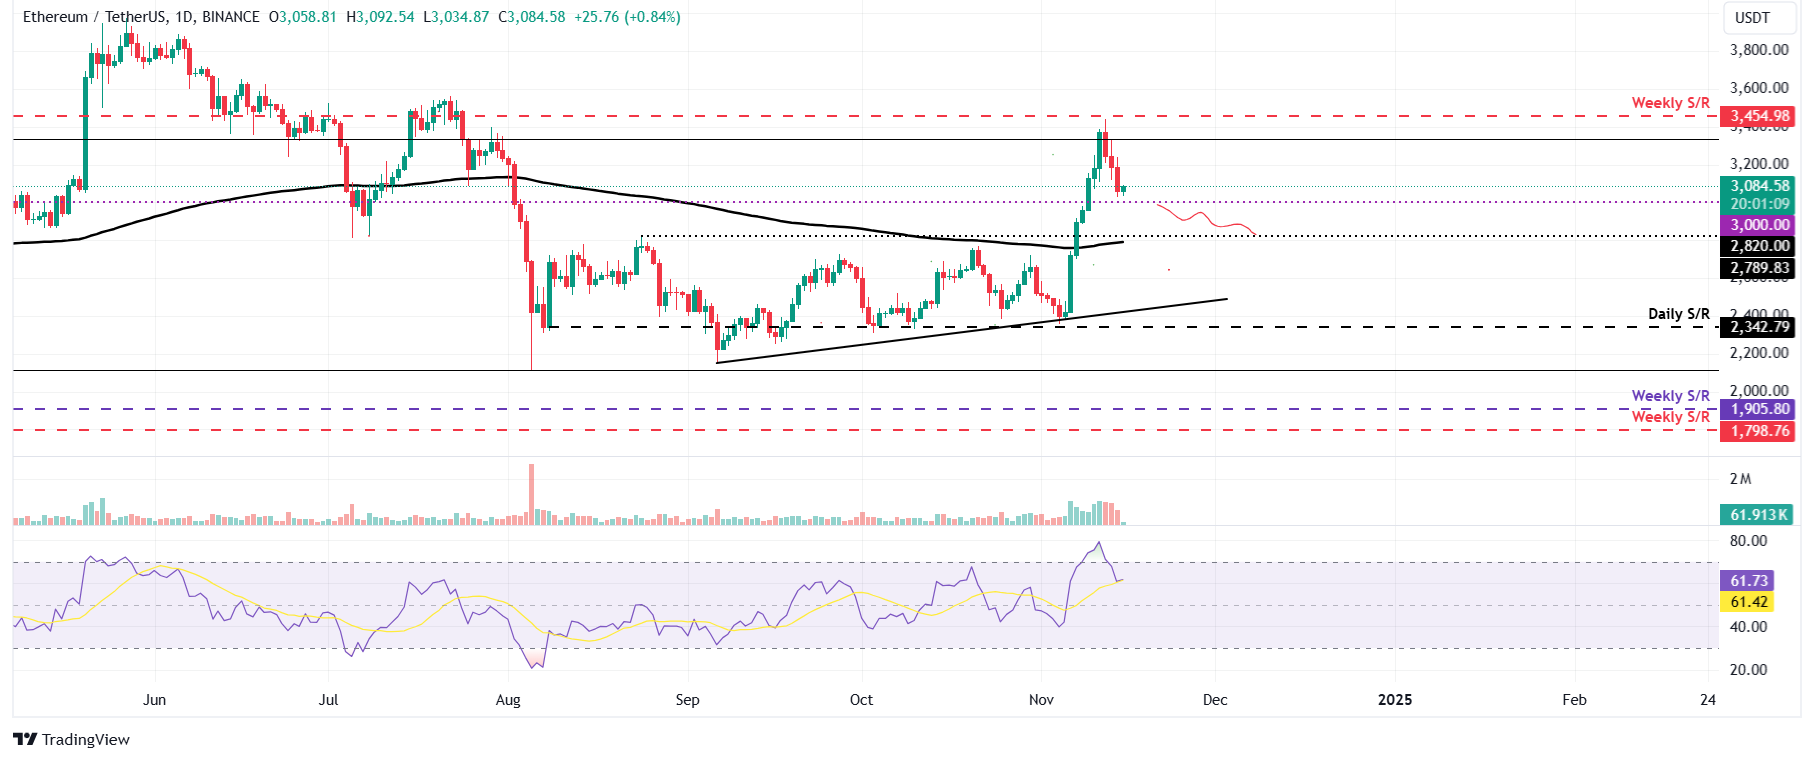
Ethereum price faced rejection around the weekly level of $3,454 on Tuesday and declined 9.2% until Thursday. On Friday, it trades slightly higher, around $3,084, approaching its $3,000 psychologically important level.
If ETH closes below the $3,000 level, it could decline to retest its 200-day Exponential Moving Average of around $2,789.
The RSI indicator on the daily chart reads 61 after exiting its overbought level of 70. If the RSI continues its decline and closes below the neutral level of 50, the Ethereum price will further decline.
ETH/USDT daily chart
However, If ETH breaks and closes above the weekly resistance at $3,454, it will rally to retest its psychologically important $4,000 level.
Ripple price is set for a downturn if it rejects the $0.854 level
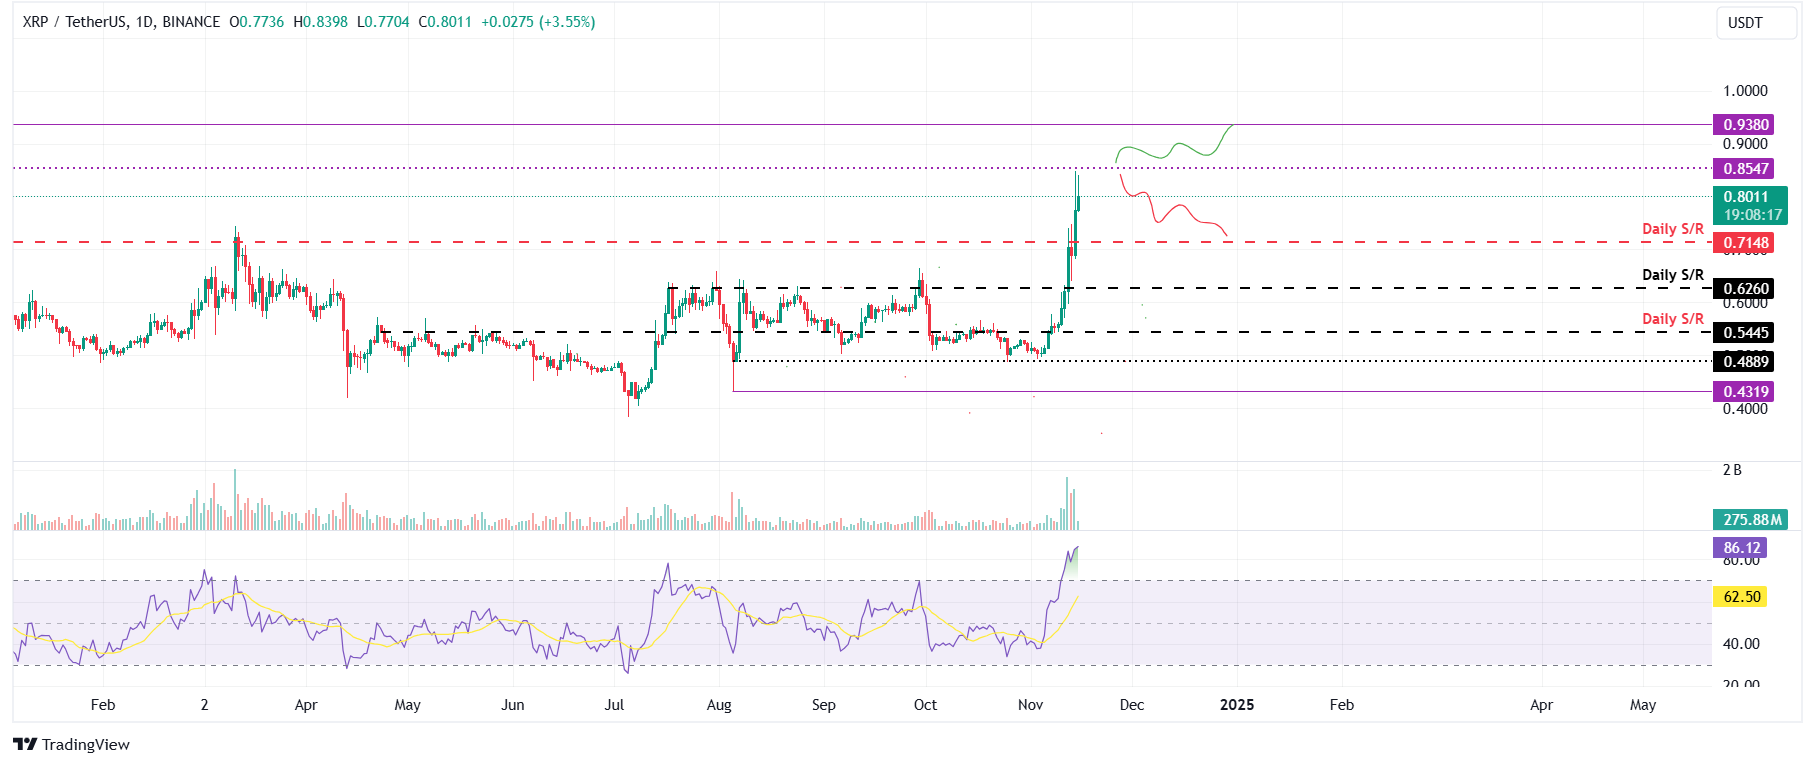
Ripple price broke above the daily resistance level of $0.714 and rallied 12% on Thursday. As of Friday, it trades higher at around $0.801, approaching its $0.854 resistance level.
If XRP finds rejection around $0.854 and declines, it will extend its downward movement to retest its $0.714 support level.
The RSI on the daily chart read 86, well above its overbought level of 70, signaling increasing risk. Traders should exercise caution when adding to their long positions, as a move out of the overbought territory by the RSI could provide a clear sign of a pullback.
XRP/USDT daily chart
On the other hand, if XRP closes above the $0.854 level, it would extend the rally to retest its next target at $0.930.
Author

Manish Chhetri
FXStreet
Manish Chhetri is a crypto specialist with over four years of experience in the cryptocurrency industry.



