Bitcoin Price Forecast: BTC reaches new highs near $90,000, on-chain data show chances of pullback

Bitcoin price today: $86,000
- Bitcoin corrects after reaching a new all-time high above $89,900 on Tuesday.
- Technical indicators suggest the ongoing rally is overstretched and could have a corrective pullback in BTC.
- On-chain data further supports a healthy correction as some holders realize profits at tops and leverage rises to a yearly high.
Bitcoin (BTC) hit a new all-time high (ATH) of $89,900 on Tuesday before easing to around $86,000, following a 30% surge since November 5. Technical indicators suggest the rally may be overstretched, with a potential corrective pullback ahead. On-chain data also supports this outlook, as some holders take profits and leverage reaches a yearly high, signaling a possible price correction for Bitcoin.
Bitcoin shows signs of a healthy correction
Bitcoin reached an ATH of $89,900 on Tuesday. Profit-taking transactions are soaring as traders attempt to sell at the top. According to Santiment’s data, some holders are realizing profits as the current euphoria is high, though as intense as in mid-March, when Bitcoin was in its previous all-time high cycle.
Moreover, funding rates on Binance and Bitmex indicate aggressive margins and leveraged longs looking to capitalize on further price increases. Prices are expected to climb as long as whales continue buying and the retail crowd keeps selling their cheap coins during small dips.
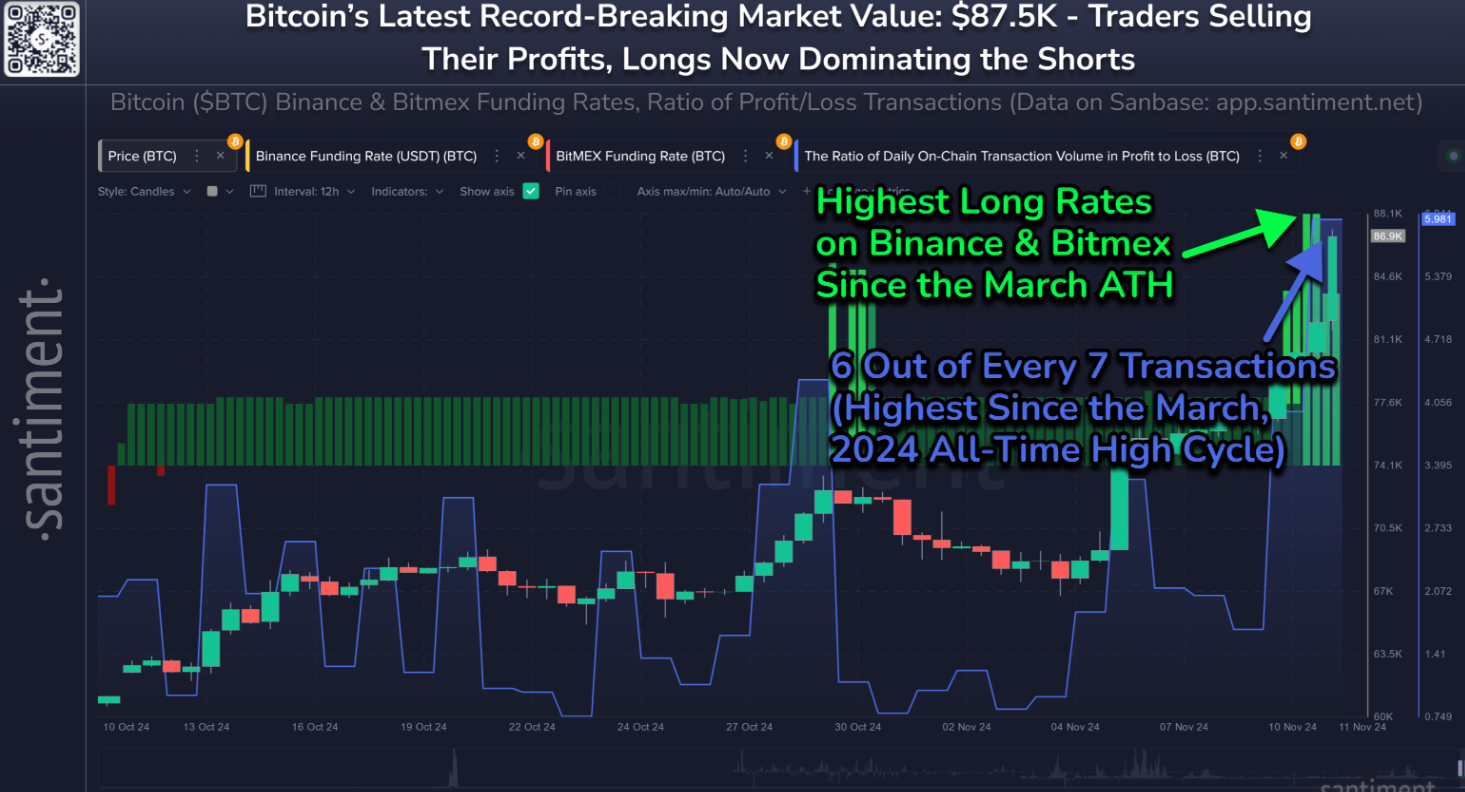
Bitcoin transactions and funding chart. Source: Santiment
Looking into institutional flows highlights how big investors continue accumulating Bitcoin, even as some holders take profits. According to Coinglass ETF data, US spot Bitcoin Exchange Traded Funds (ETFs) recorded an inflow of $1.12 billion on Monday, largely fueled by BlackRock IBIT funds, which contributed $763.60 million. If the magnitude of inflows persists to exceed the amount of BTC sold by retail investors, Bitcoin’s price could rally further.
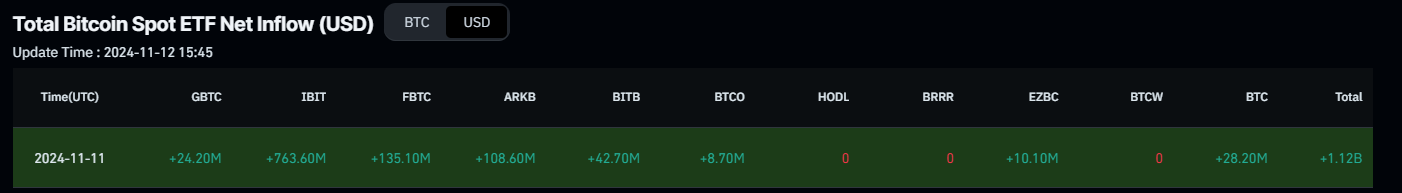
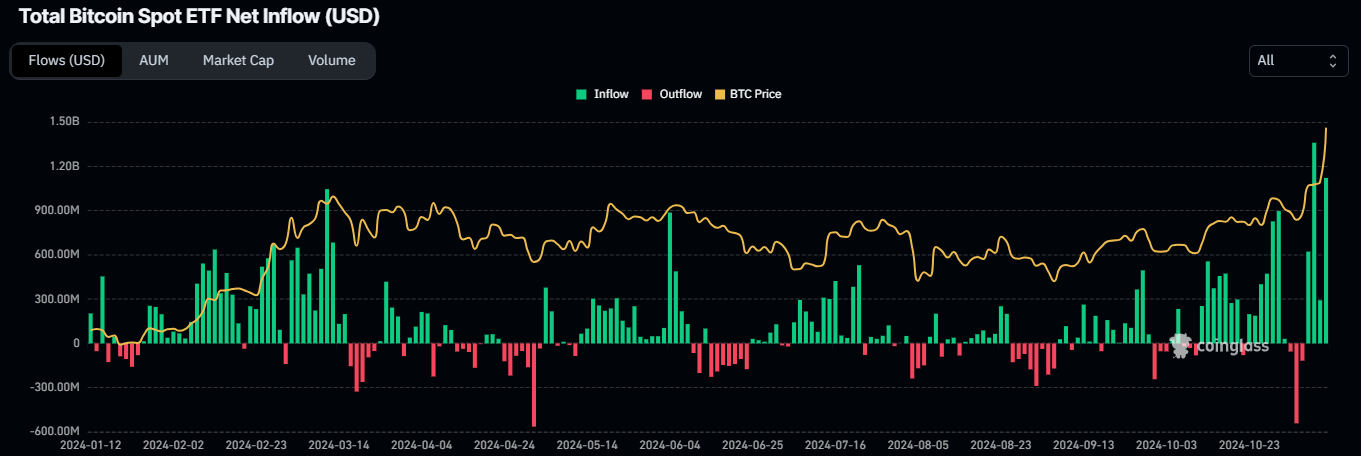
Total Bitcoin Spot ETF Net Inflow chart. Source: Coinglass
“With BTC’s break of key resistance and its multi-month range, the market is certainly in a state of euphoria. Perp funding is very elevated, and basis yields are at 7-month highs. While we remain structurally bullish, we are cautious of any pullbacks, especially from leveraged washouts. Historically, such spikes in basis yields have not lasted very long either”, says QCP Capital’s report.
CryptoQuant data shows that as Bitcoin hits new highs, leverage rises and reached a yearly high of 0.23 on Friday, indicating risks of high volatility. Last week, Bitcoin broke out of its previous all-time high and entered a price discovery process, which began to show signs of a high risk of corrections in the short term.
However, it is important to point out that the current market structure’s fundamentals are much more solid, and any short-term corrections are likely to be healthy movements of normalization in leverage. As long as cycle indicators do not signal risk, corrections can be understood as buying opportunities.
-638670190306503776.png)
Bitcoin Estimated Leverage Ratio chart. Source: Cryptoquant
Bitcoin Price Forecast: Higher chances of a pullback
Bitcoin price reached a new all-time high of $89,940 on Tuesday after seven consecutive green candlesticks since November 5, suggesting the rally may be overstretched. At the time of writing on Tuesday, it trades down around $86,000.
The Relative Strength Index (RSI) also stands at 76, well above its overbought level of 70. It points downwards, signaling increasing risk. Traders should exercise caution when adding to their long positions, as a move out of the overbought territory by the RSI could provide a clear sign of a pullback.
If BTC faces a corrective pullback, it could decline 8.5% from its current position and retest its $78,807 support level.
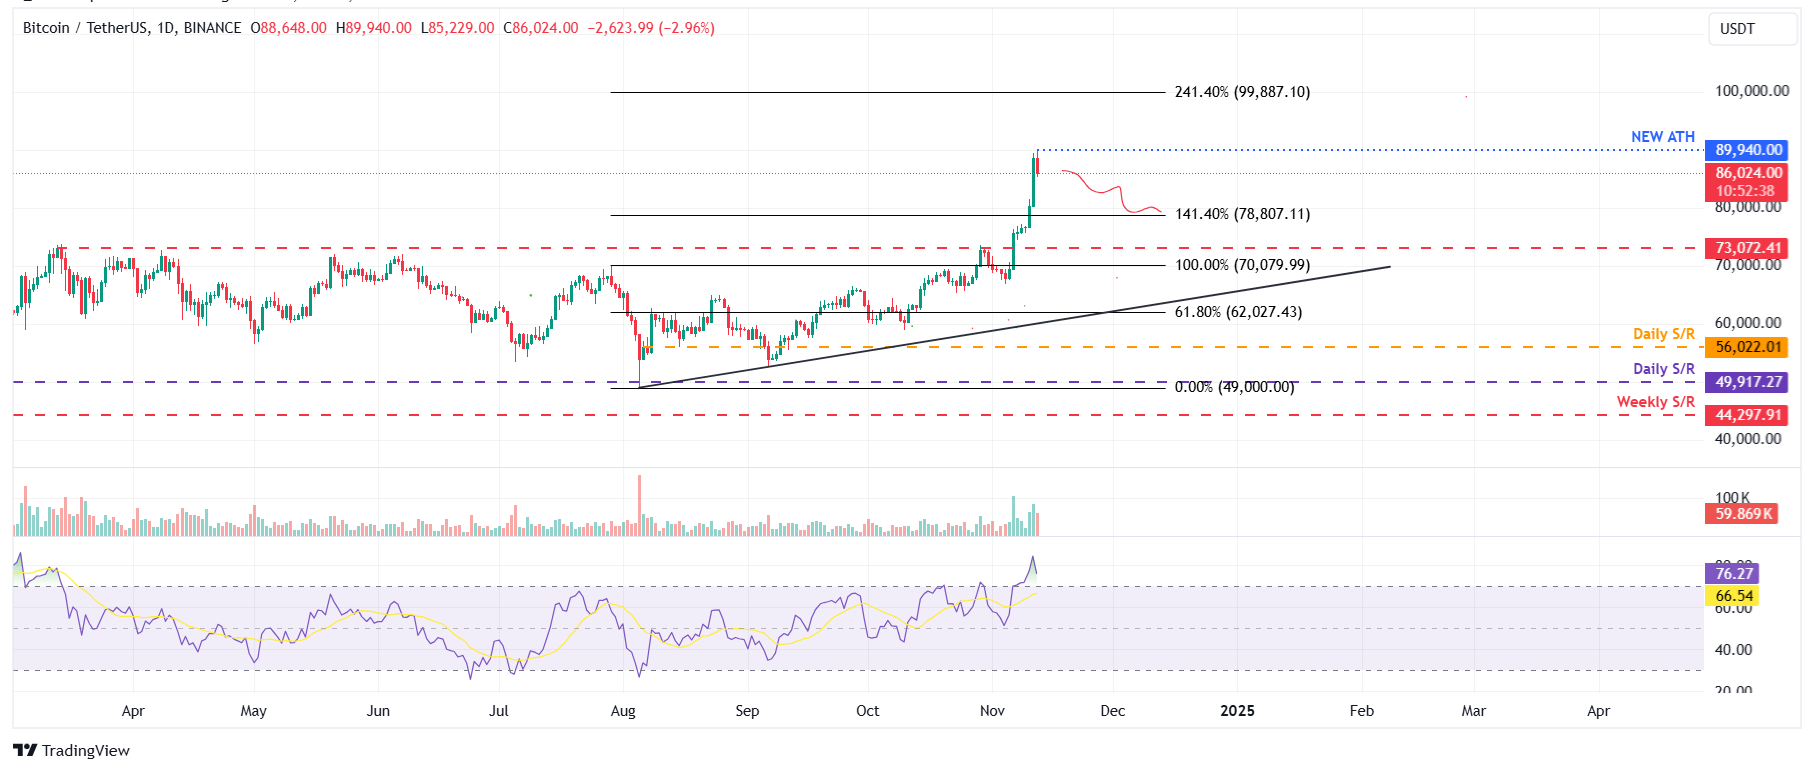
BTC/USDT daily chart
However, if the bulls continue the upward momentum, the rally could extend to retest its 241.40% Fibonacci extension level at $99,887, drawn from July’s high of $70,079 to August’s low of $49,000.
Bitcoin, altcoins, stablecoins FAQs
Bitcoin is the largest cryptocurrency by market capitalization, a virtual currency designed to serve as money. This form of payment cannot be controlled by any one person, group, or entity, which eliminates the need for third-party participation during financial transactions.
Altcoins are any cryptocurrency apart from Bitcoin, but some also regard Ethereum as a non-altcoin because it is from these two cryptocurrencies that forking happens. If this is true, then Litecoin is the first altcoin, forked from the Bitcoin protocol and, therefore, an “improved” version of it.
Stablecoins are cryptocurrencies designed to have a stable price, with their value backed by a reserve of the asset it represents. To achieve this, the value of any one stablecoin is pegged to a commodity or financial instrument, such as the US Dollar (USD), with its supply regulated by an algorithm or demand. The main goal of stablecoins is to provide an on/off-ramp for investors willing to trade and invest in cryptocurrencies. Stablecoins also allow investors to store value since cryptocurrencies, in general, are subject to volatility.
Bitcoin dominance is the ratio of Bitcoin's market capitalization to the total market capitalization of all cryptocurrencies combined. It provides a clear picture of Bitcoin’s interest among investors. A high BTC dominance typically happens before and during a bull run, in which investors resort to investing in relatively stable and high market capitalization cryptocurrency like Bitcoin. A drop in BTC dominance usually means that investors are moving their capital and/or profits to altcoins in a quest for higher returns, which usually triggers an explosion of altcoin rallies.
Author

Manish Chhetri
FXStreet
Manish Chhetri is a crypto specialist with over four years of experience in the cryptocurrency industry.


