Top 3 Price Prediction Bitcoin, Ethereum, Ripple: BTC, ETH and XRP could face pullbacks
- Bitcoin price declines and shows a high chance of a pullback after reaching a new all-time high of $89,900.
- Ethereum faces rejection around its weekly level of $3,454, indicating bearish momentum ahead.
- Ripple declines as it retests a crucial resistance level, suggesting a correction ahead.

Bitcoin (BTC), Ethereum (ETH) and Ripple (XRP) trade in the red on Tuesday following strong rallies since last week, driven by crypto-friendly candidate Donald Trump's election victory. Technical indicators now suggest a normal correction for all three coins may be ahead.
Bitcoin bulls show signs of exhaustion
Bitcoin price reached a new all-time of $89,980 on Tuesday after rallying seven consecutive green candlesticks since November 5, suggesting the rally may be overstretched. At the time of writing on Wednesday, it trades slightly down around $87,500.
The Relative Strength Index (RSI) also stands at 80, well above its overbought level of 70. It points downwards, signaling increasing risk. Traders should exercise caution when adding to their long positions, as a move out of the overbought territory by the RSI could provide a clear sign of a pullback.
If BTC faces a corrective pullback, it could decline 10% from its current position and retest its $78,807 support level.
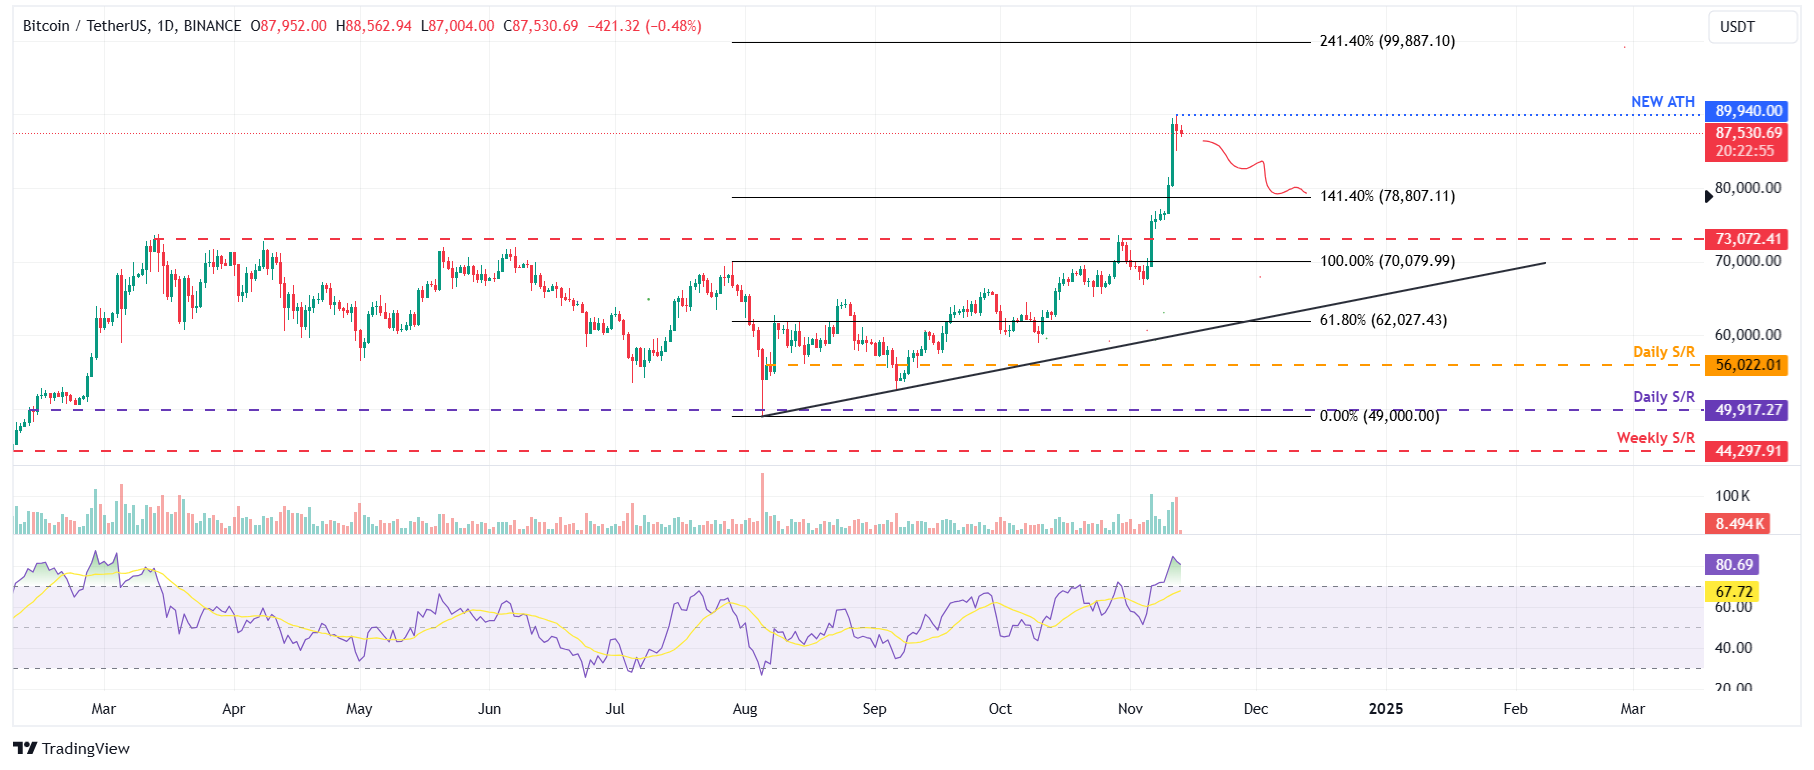
BTC/USDT daily chart
Conversely, if the bulls continue the upward momentum, the rally could extend to retest its 241.40% Fibonacci extension level at $99,887, drawn from July’s high of $70,079 to August’s low of $49,000.
Ethereum price is poised for a decline as it faces rejection from key level
Ethereum price retested its daily support at around $2,342 on November 5 and surged over 40% until Monday. Such a massive rally could lead to a pullback. As of Tuesday, it retested the weekly resistance level at $3,454 and declined 3.79%. At the time of writing on Wednesday, it continues to decline slightly down to around $3,200.
The RSI indicator on the daily chart supports Ethereum’s decline. It reads 69, pointing downwards, exiting from its overbought value of 70, indicating bullish momentum is losing strength.
If ETH faces a pullback, it could decline around 6% from its current position and retest its psychologically important $3,000 level.
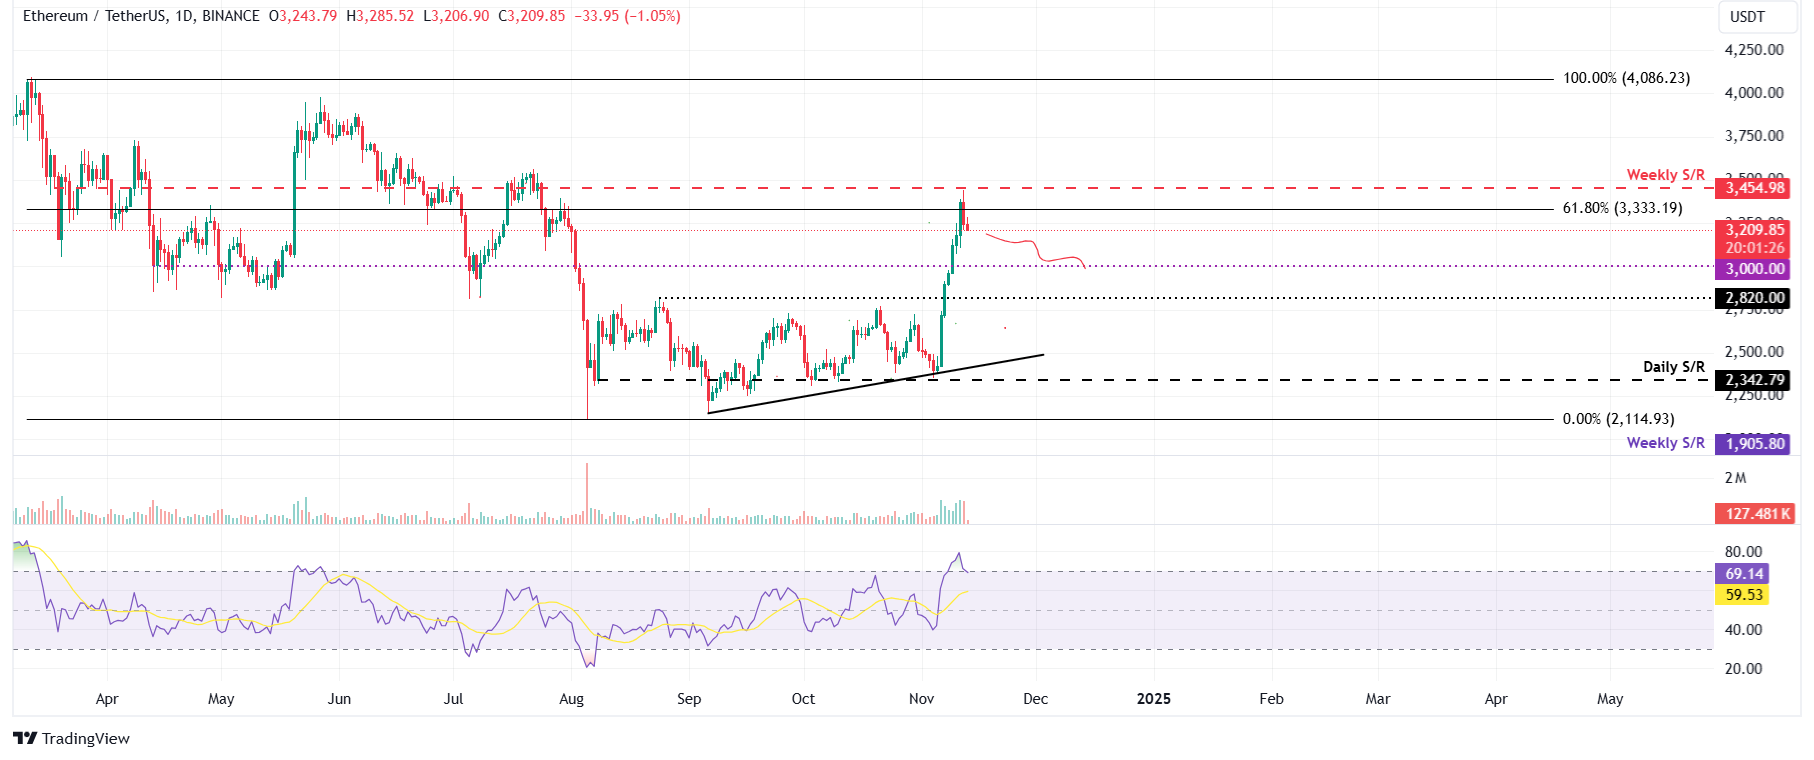
ETH/USDT daily chart
However, If ETH breaks and closes above the weekly resistance at $3,454, it will rally to retest its psychologically important $4,000 level.
Ripple price could face pullback following rejection off key resistance
Ripple price broke the daily resistance level of $0.544 on November 7 and rallied over 27% until Tuesday. When writing the article on Wednesday, it retested a March 11 high of $0.744 and faced rejection, starting to decline to trade around $0.671.
If XRP continues to decline, it could extend the decline to retest its crucial daily support at $0.626.
The RSI also stands at 73, well above its overbought threshold of 70. It points downwards, signaling increasing risk. Traders should exercise caution when adding to their long positions, as a move out of the overbought territory by the RSI could provide a clear sign of a pullback.
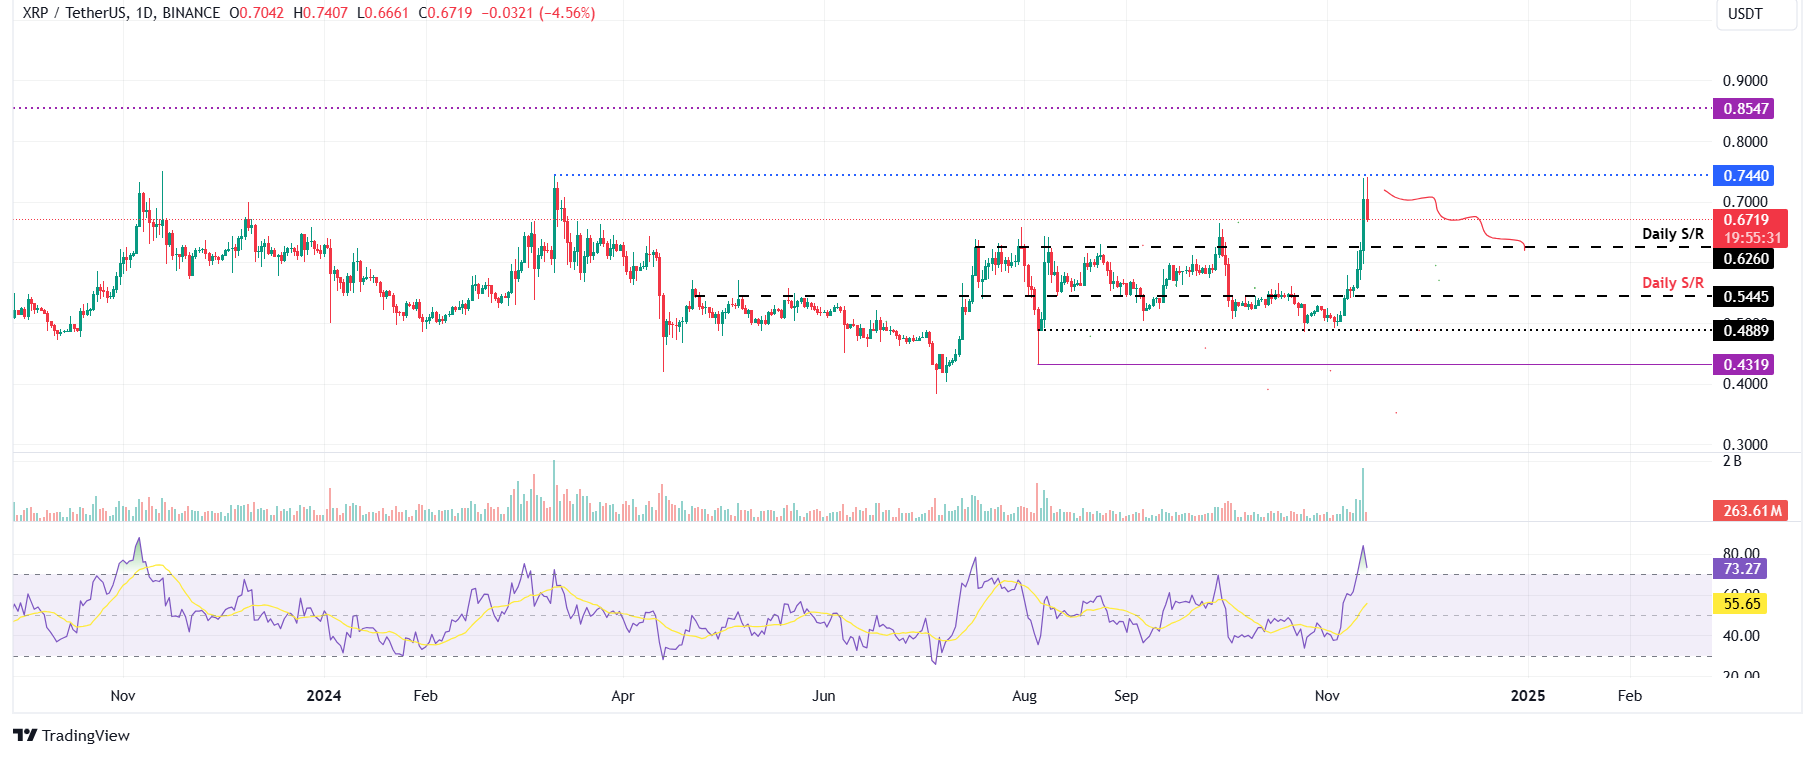
XRP/USDT daily chart
On the other hand, if the XRP breaks and closes above $0.744, it could extend the rally to retest its resistance level at $0.854.
Author

Manish Chhetri
FXStreet
Manish Chhetri is a crypto specialist with over four years of experience in the cryptocurrency industry.