Top 3 Price Prediction Bitcoin, Ethereum, Ripple: BTC presents the ultimate test of patience
- Bitcoin price remains within a bind, sliding horizontally as bulls take the back seat.
- Ethereum price is slowly grinding up against BTC while consolidating in this giant falling wedge.
- Ripple price coils up for a 10% breakout to $0.000028, but early profit takers could change the narrative.

Bitcoin (BTC) has continued to move within a bind for almost six weeks now, a lack of volatility that has exhausted investors' patience. The drag has extended to altcoins, with Ethereum (ETH) and Ripple (XRP) prices not showing much activity either.
Also Read: Bitcoin Weekly Forecast: Can BTC reach $40k or $25k first?
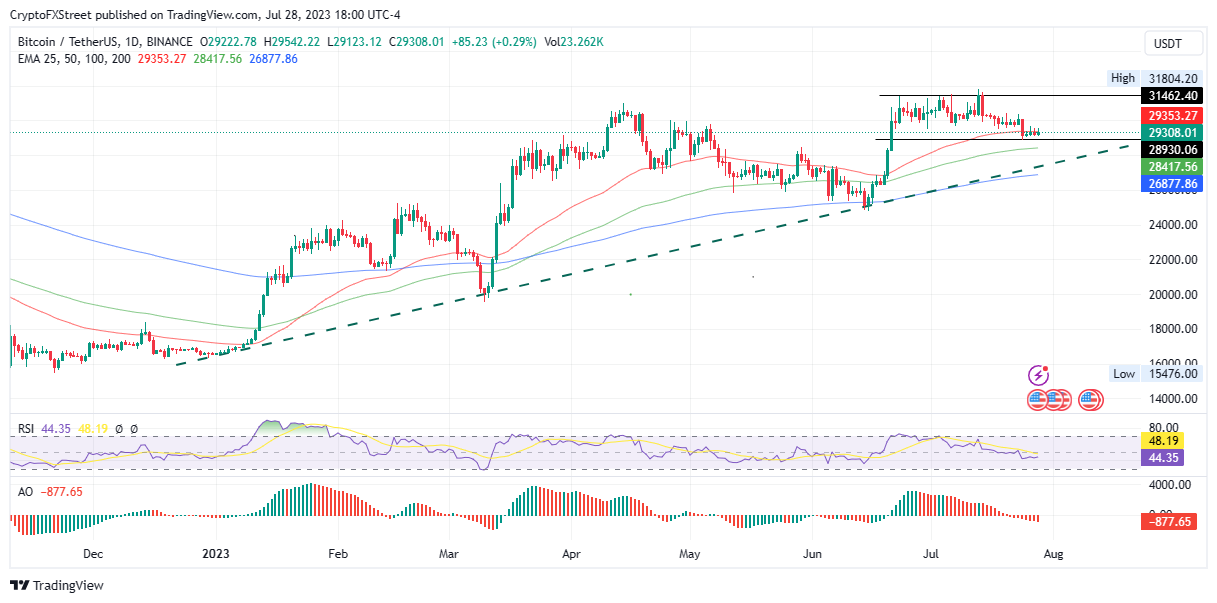
Bitcoin price continues to drag
Bitcoin (BTC) is moving horizontally, under the foothold of the 50-day Exponential Moving Average (EMA) at $29,352. This comes after BTC bounced off from the immediate support at $28,930 to continue in the multi-week consolidation between $31,462 and the aforementioned level.
Failure to flip the 50-day EMA at $29,352 into support could see Bitcoin price slide lower to lose the support offered by the $28,930 level. Such a move would give bears control over Bitcoin price, potentially causing a prolonged slump toward the 100-day EMA at $28,417.
In a highly bearish case, BTC could extend a leg south to breach the support offered by the uptrend line. Such a move would spell doom for Bitcoin price, first invalidating the bullish outlook the clearing the clog for possible retest of the $26,000 range.
The bearish outlook is bolstered by the Relative Strength Index (RSI) below 50 and the Awesome Oscillators in the negative zone, suggesting bears are leading the market.
BTC/USDT 1-Day Chart
On the flip side, if buying pressure increases above the $28,930 support level, Bitcoin price could continue north, first flipping the 50-EMA hurdle into support before reaching higher. A decisive daily candlestick close above the $31,462 barricade would clear the path north, potentially marking a new range high.
Also Read: Bitcoin halving could pump investors' bags, but a gloomy future awaits BTC miners.
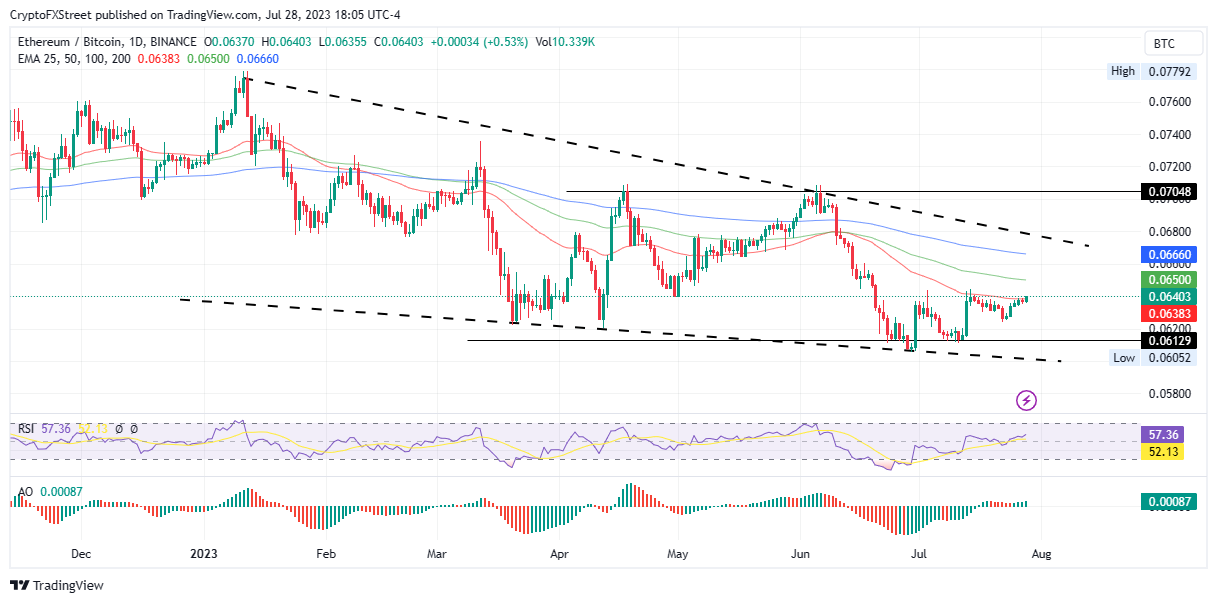
Ethereum price grinds up against BTC
Ethereum (ETH) price is edging north against Bitcoin on the ETH/BTC 1-day chart after a progressive consolidation within a falling wedge pattern. Lower highs and lower lows characterize this bullish technical formation as bulls give way to the bears. As the price bounces from the lower boundary of the chart pattern, the right amount of buyer momentum could see ETH breakout and confirm the pattern.
A decisive daily candlestick close above $0.070 levels would confirm an uptrend, which was last seen on June 5. Such a move would denote a 10% climb from the current level.
Momentum indicators such as the RSI and AO both favor the bulls, as the RSI is tipping north to show rising momentum, while the AO is positive to show that bulls are leading the market.
ETH/BNB 1-Day Chart
On the other hand, if profit takers start cashing in, the current uptrend would be interrupted. The subsequent selling pressure could see the PoS token approach the immediate support at $0.061.
In the dire case, the Ethereum price could extend a leg south to tag the lower boundary of the pattern. A stretch below this level could spell doom for ETH holders.
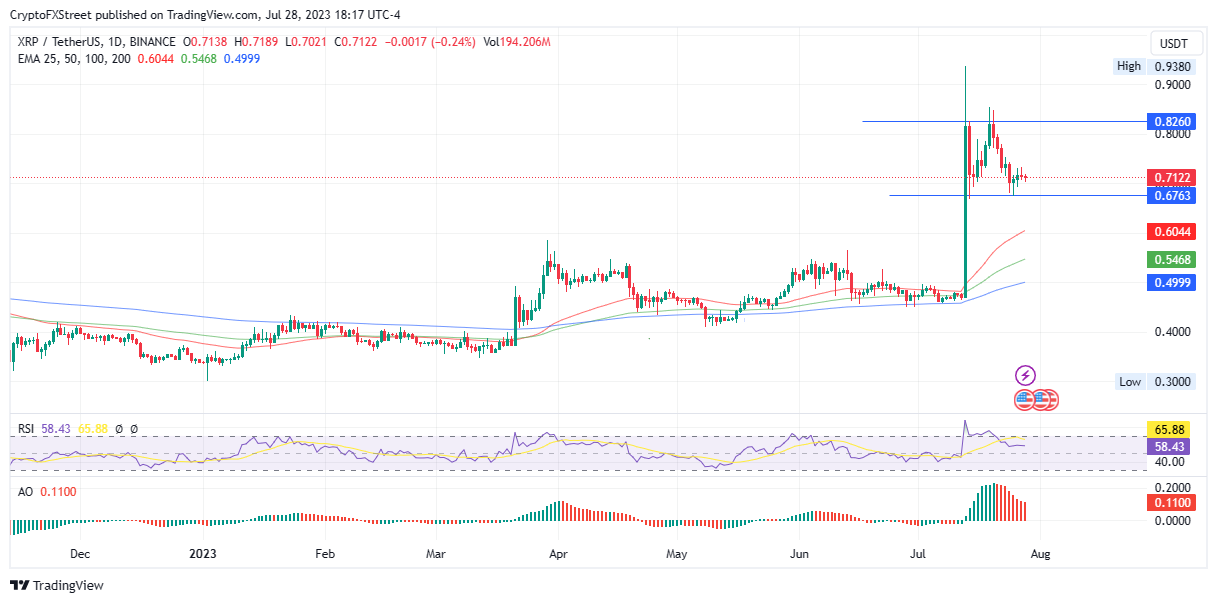
Ripple price coils up for a breakout
Ripple (XRP) price is trading with a bullish bias, steadily pulling north after finding support at $0.676. With the position of both momentum indicators favoring the bulls, XRP could soon reclaim the range high at $0.826.
The three EMAs pointing north suggest it is the path with the least resistance, further tipping the odds in favor of the bulls.
XRP/USDT 1-Day Chart
The histograms of the AO flashing red and their volume decreasing show that bears are gaining ground. If they manage to overpower the bulls, Ripple price could pull south. Losing the immediate support at $0.676 could threaten the July 13 gains, but the real danger would be a successful flip of the 50-day EMA support at $0.604 into a resistance level.
Also Read: XRP retail holders made biggest winners from Torres' decision, technology policy expert says
Like this article? Help us with some feedback by answering this survey:
Author

Lockridge Okoth
FXStreet
Lockridge is a believer in the transformative power of crypto and the blockchain industry.


