Top 3 Price Prediction Bitcoin, Ethereum, Ripple: BTC faces market brutality, ETH and XRP suffer by association
- Bitcoin price is bearish, preparing for the next move below the channel's lower boundary at $21,746.
- Ethereum price repels a key confluence level at $1,508, but overhead pressure may overpower the bulls.
- Ripple price breaks above a descending parallel channel at $0.3726, but the bearish rating remains.

Bitcoin (BTC) price is moving with a bearish inclination as it plans to break below the channel's lower boundary. Overhead pressure from the 200-day Exponential Moving Average (EMA) continues suppressing the flagship crypto. As expected, once Bitcoin price starts plummeting, it takes the rest of the altcoins down with it, explaining the discouraging outlook for Ethereum (ETH) and Ripple (XRP).
Also read: How US President Joe Biden’s plan for updated crypto tax affects cryptocurrency traders?
Bitcoin price suffers overhead pressure
Bitcoin price succumbed to overhead pressure due to the 50-day EMA at $22,319 in the Wednesday trading session. It also faces another suppression due to the 200-day EMA at $21,790 on Thursday, which could push it below the channel. Therefore, we expect the price to drop further, potentially tagging the 100-day EMA at $21,309.
The Relative Strength Index (RSI) showed a price strength of 38, indicating that the path with the least resistance was downward. If selling pressure continues to build up, Bitcoin price could descend towards the support at $19,000. Such a descent would constitute a 12.60% decline from the current price of $21,746.
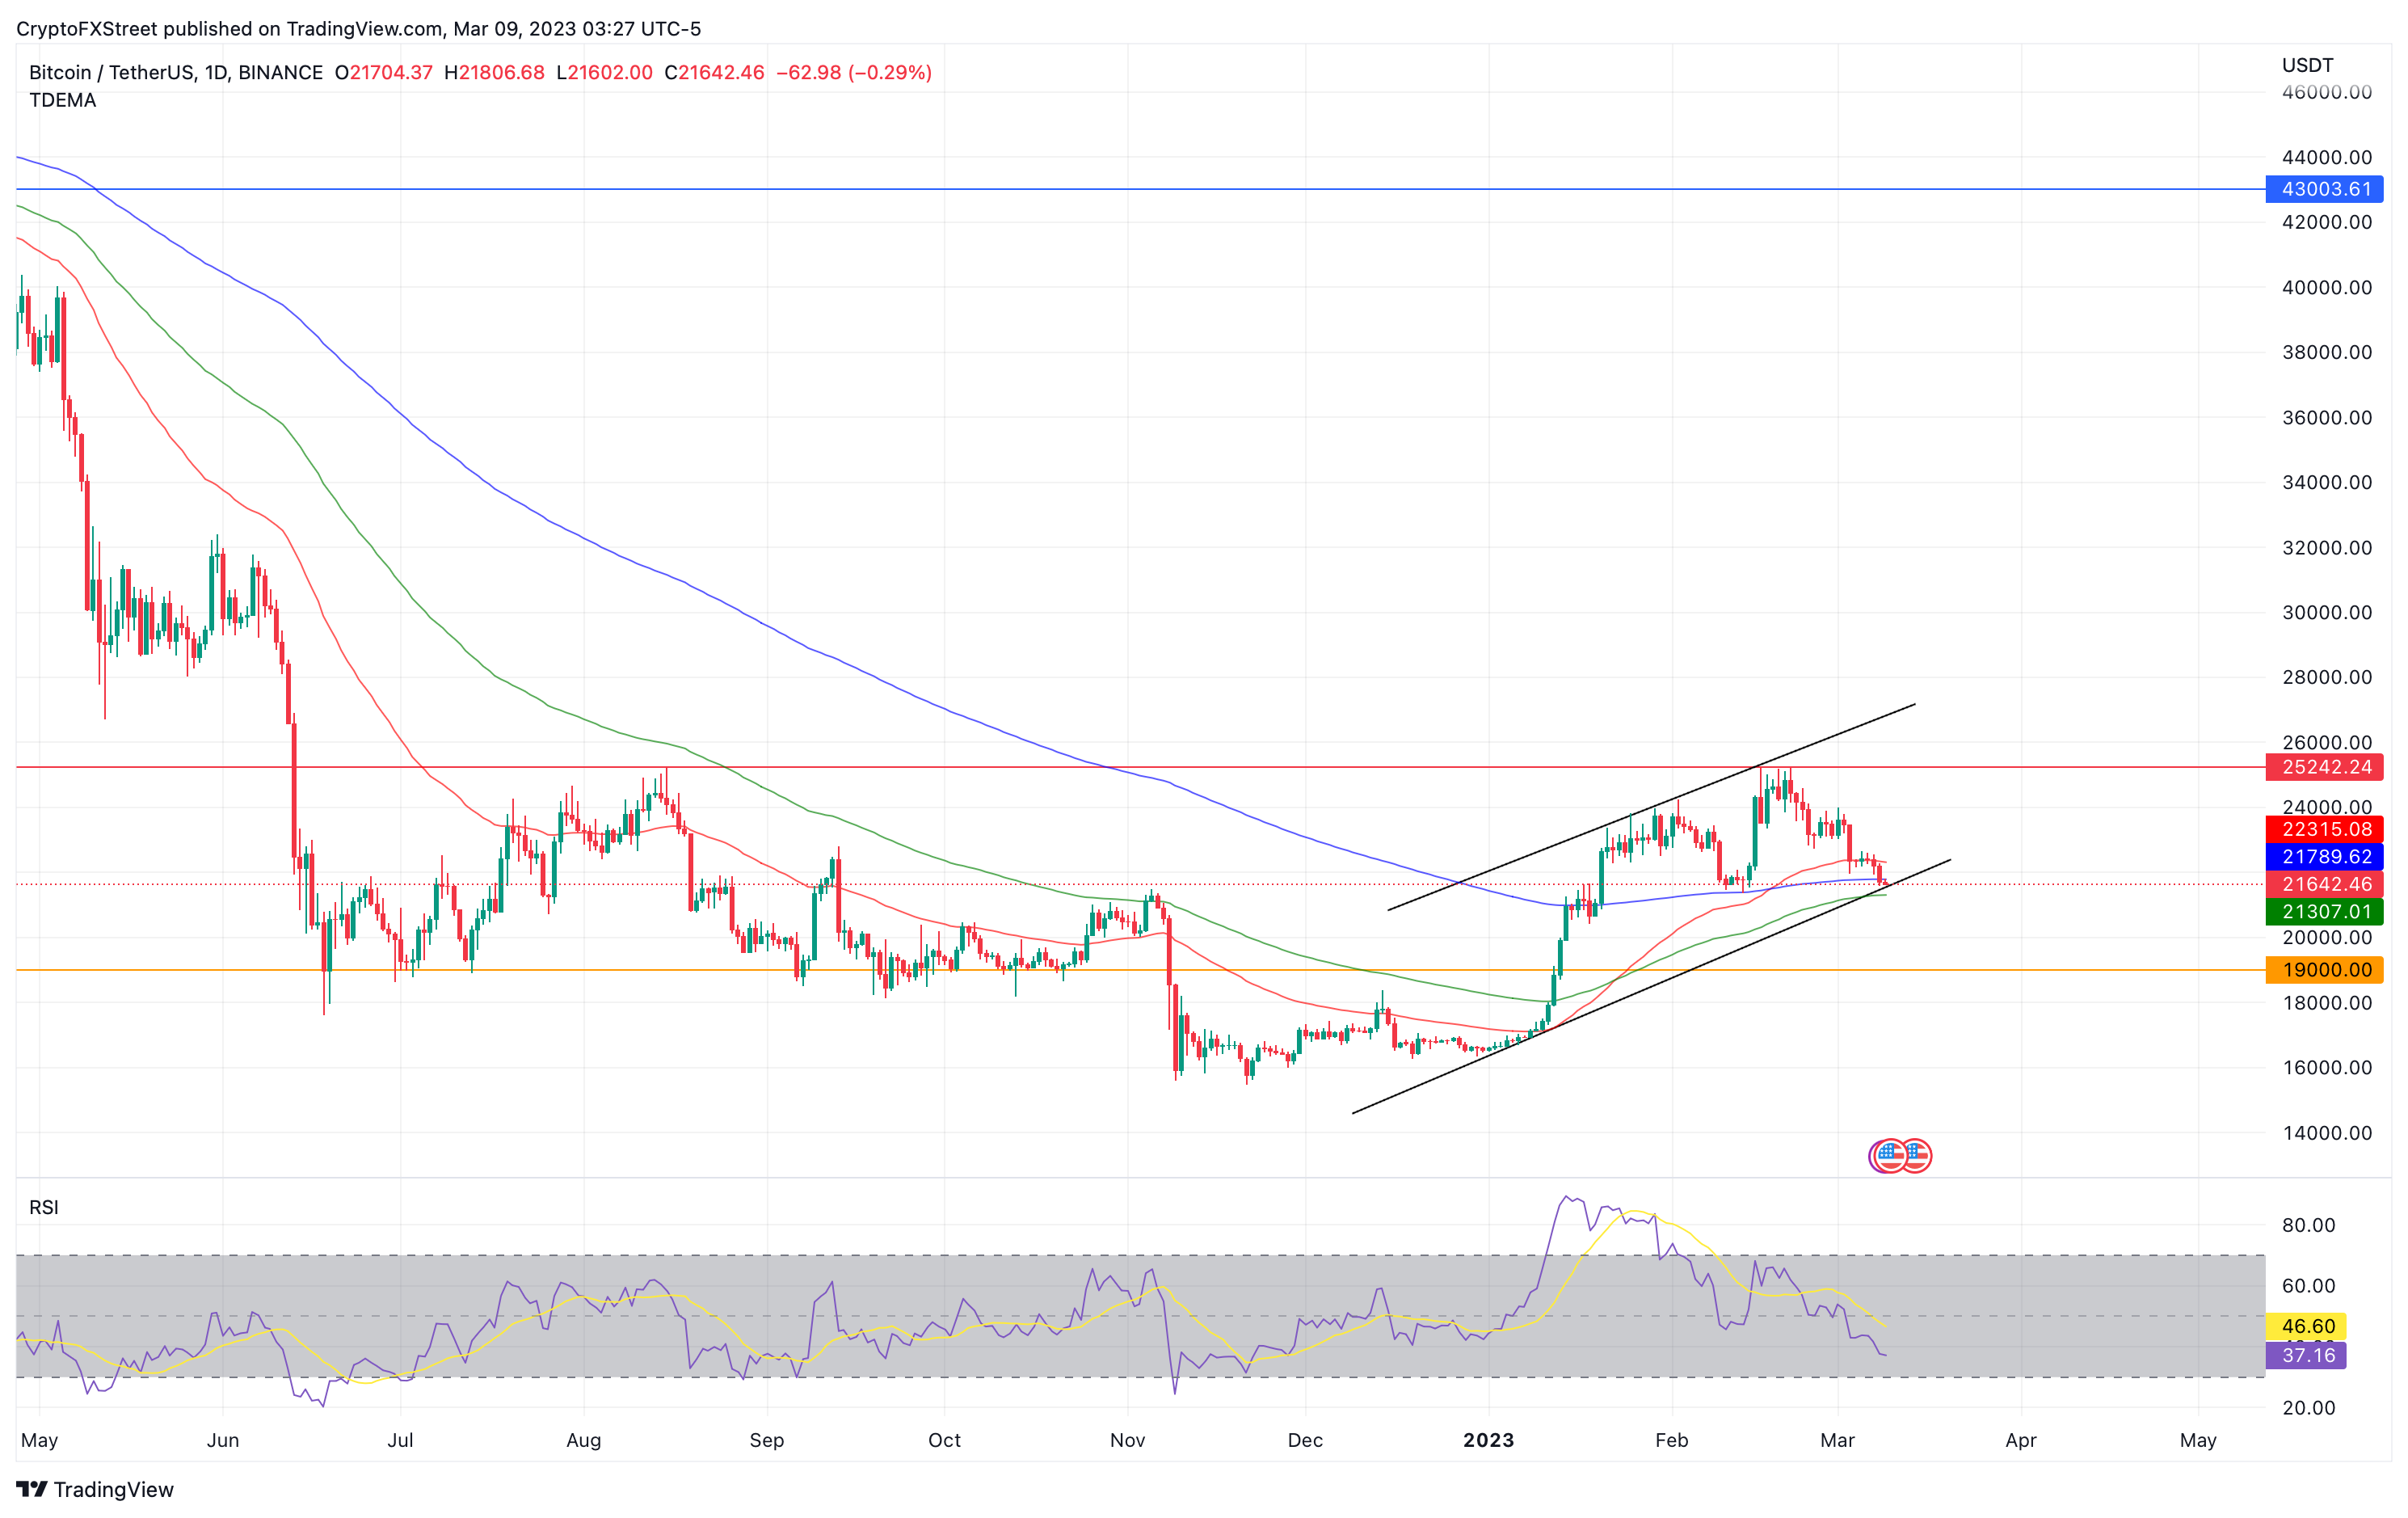
BTC/USDT 1-day chart
On the upside, if bulls defend their position above the channel's lower boundary, Bitcoin price could increase. This would mean overcoming the resistance due to the 200-day EMA at $21,790, as they did on January 14.
Past the 200-day EMA, bulls would also have to bypass the 50-day EMA at $22,319. A daily candlestick close above this level would invalidate the bearish thesis. With their right foot forward, they could make a run for Bitcoin price to tag the major resistance at $25,242. Such a move would constitute a 16% climb from the current level.
Ethereum price repels a key confluence level
Ethereum (ETH) price, like Bitcoin, is trading with a bearish bias and struggling to hold above a key level. Overhead pressure due to the 50-day EMA at $1,567 stomped its value in the Wednesday session, flipping the support offered by the 200-day EMA at $1,546 into resistance in the Thursday trading session. As buyer momentum continues to reduce, ETH could drop below the support confluence due to the horizontal level and the 100-day EMA at $1,509.
Below that, the Ethereum price could descend toward $1,212 before a possible trend reversal or revisit the $990 support floor in the dire case.
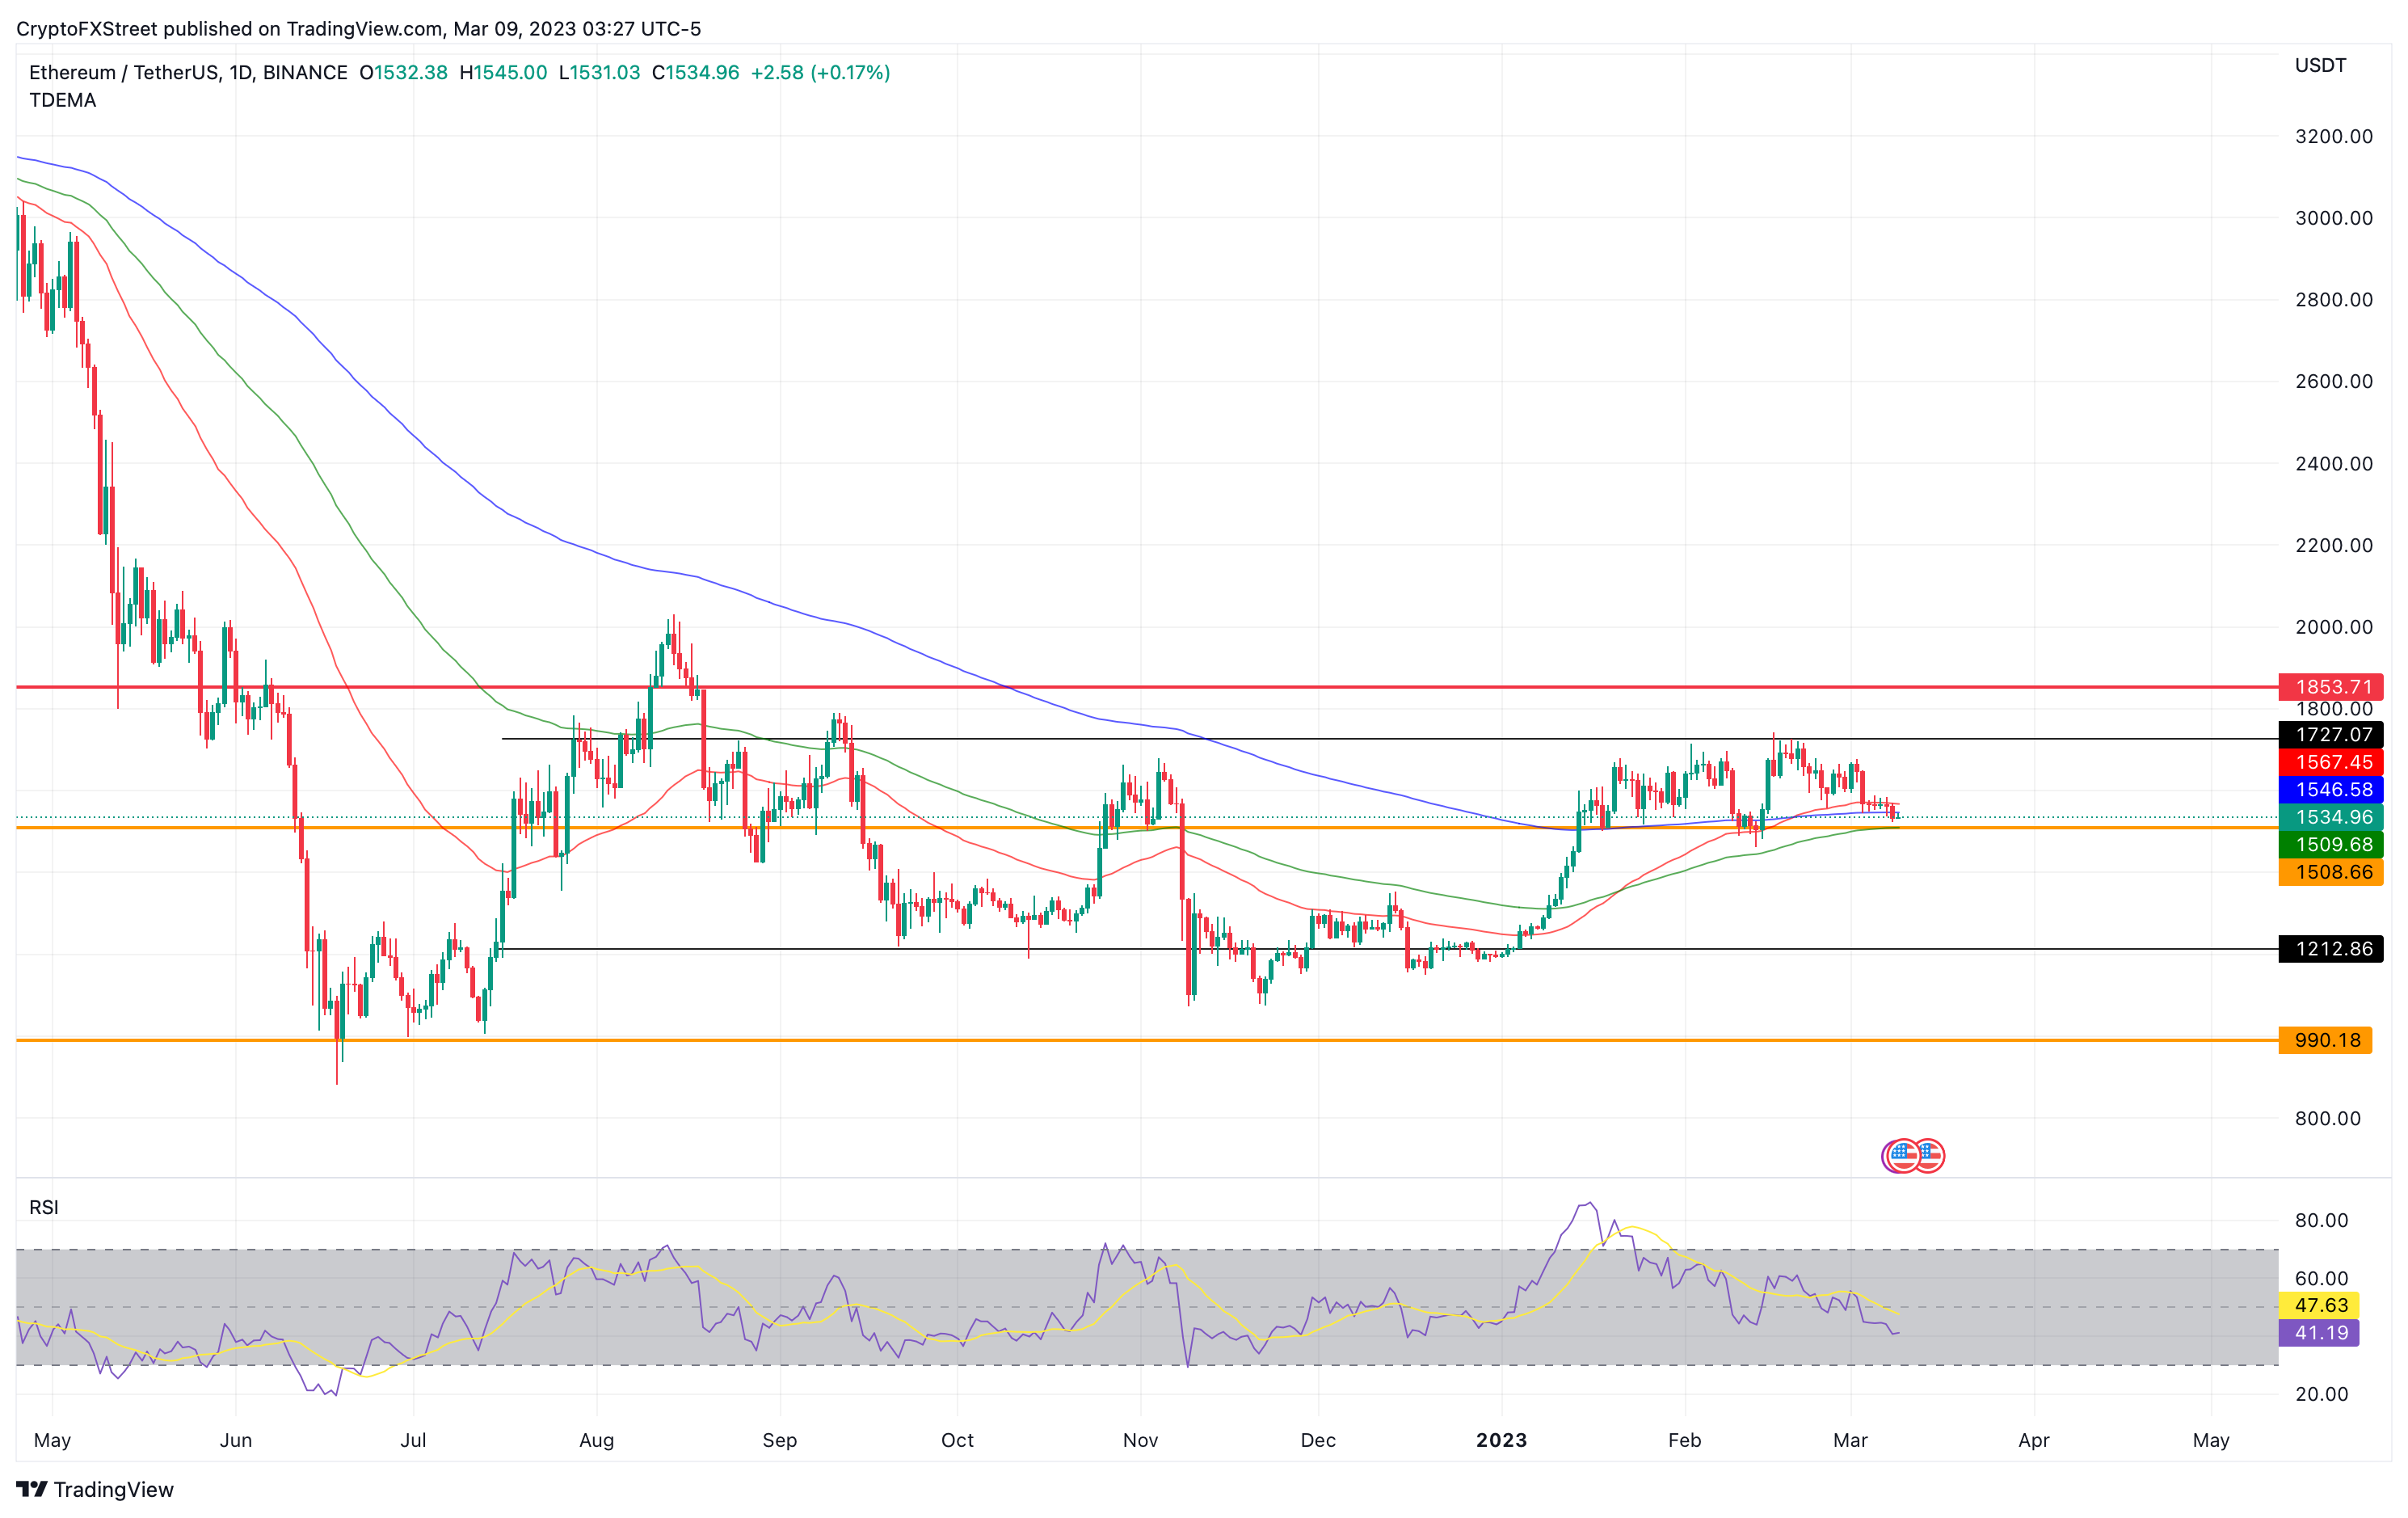
ETH/USDT 1-day chart
Conversely, considering the RSI had just tipped upward, more buyers were rushing to the scene, and the price could increase. In such a case, the Ethereum price would have to overcome overhead pressure and crack past the 200-day EMA at $1,546 before confronting the 50-day EMA at $1,567. A daily candlestick close above the aforementioned EMA will invalidate the bearish narrative.
In highly ambitious cases, the Ethereum price could ascend to the $1,727 resistance level and run toward the major resistance at $1,853. Such a move would denote a 20.55% increase from the current $1,539 price.
Ripple price escapes consolidation, but the bearish rating remains
Ripple (XRP) price escaped from a descending parallel channel during the Tuesday trading session, a bullish move that could be attributed to the perceived positive ruling in the Ripple vs. SEC case.
A close win for Ripple on a purely mathematical basis. https://t.co/BXQDh66nvC pic.twitter.com/AXMu2wwWIG
— Mr. Huber (@Leerzeit) March 7, 2023
At the time of writing, XRP was auctioning for $0.3868 after gaining 2.62% on the last day. There was a lot of trading in the Ripple market, recording a 30% increase in 24-hour trading volume to around $1.945 billion.
Nevertheless, selling pressure was building up, and Ripple price was trading with a bearish bias. The supplier congestion level at $0.3933 and the 100-day EMA at $0.3878 were stunting XRP as investors collected early profits. If the selloff continues, the price will drop below the 50-day EMA at $0.3848 before falling into the grasp of the technical formation.
If the bearish narrative plays out, the Ripple price could descend to the $0.3627 or the $0.3539 level. In extreme cases, the price could go as low as the $0.3321 swing low. Notice that while the Relative Strength Index (RSI) was at the optimal index, the indicator had just tipped downwards to show that bears were taking control.
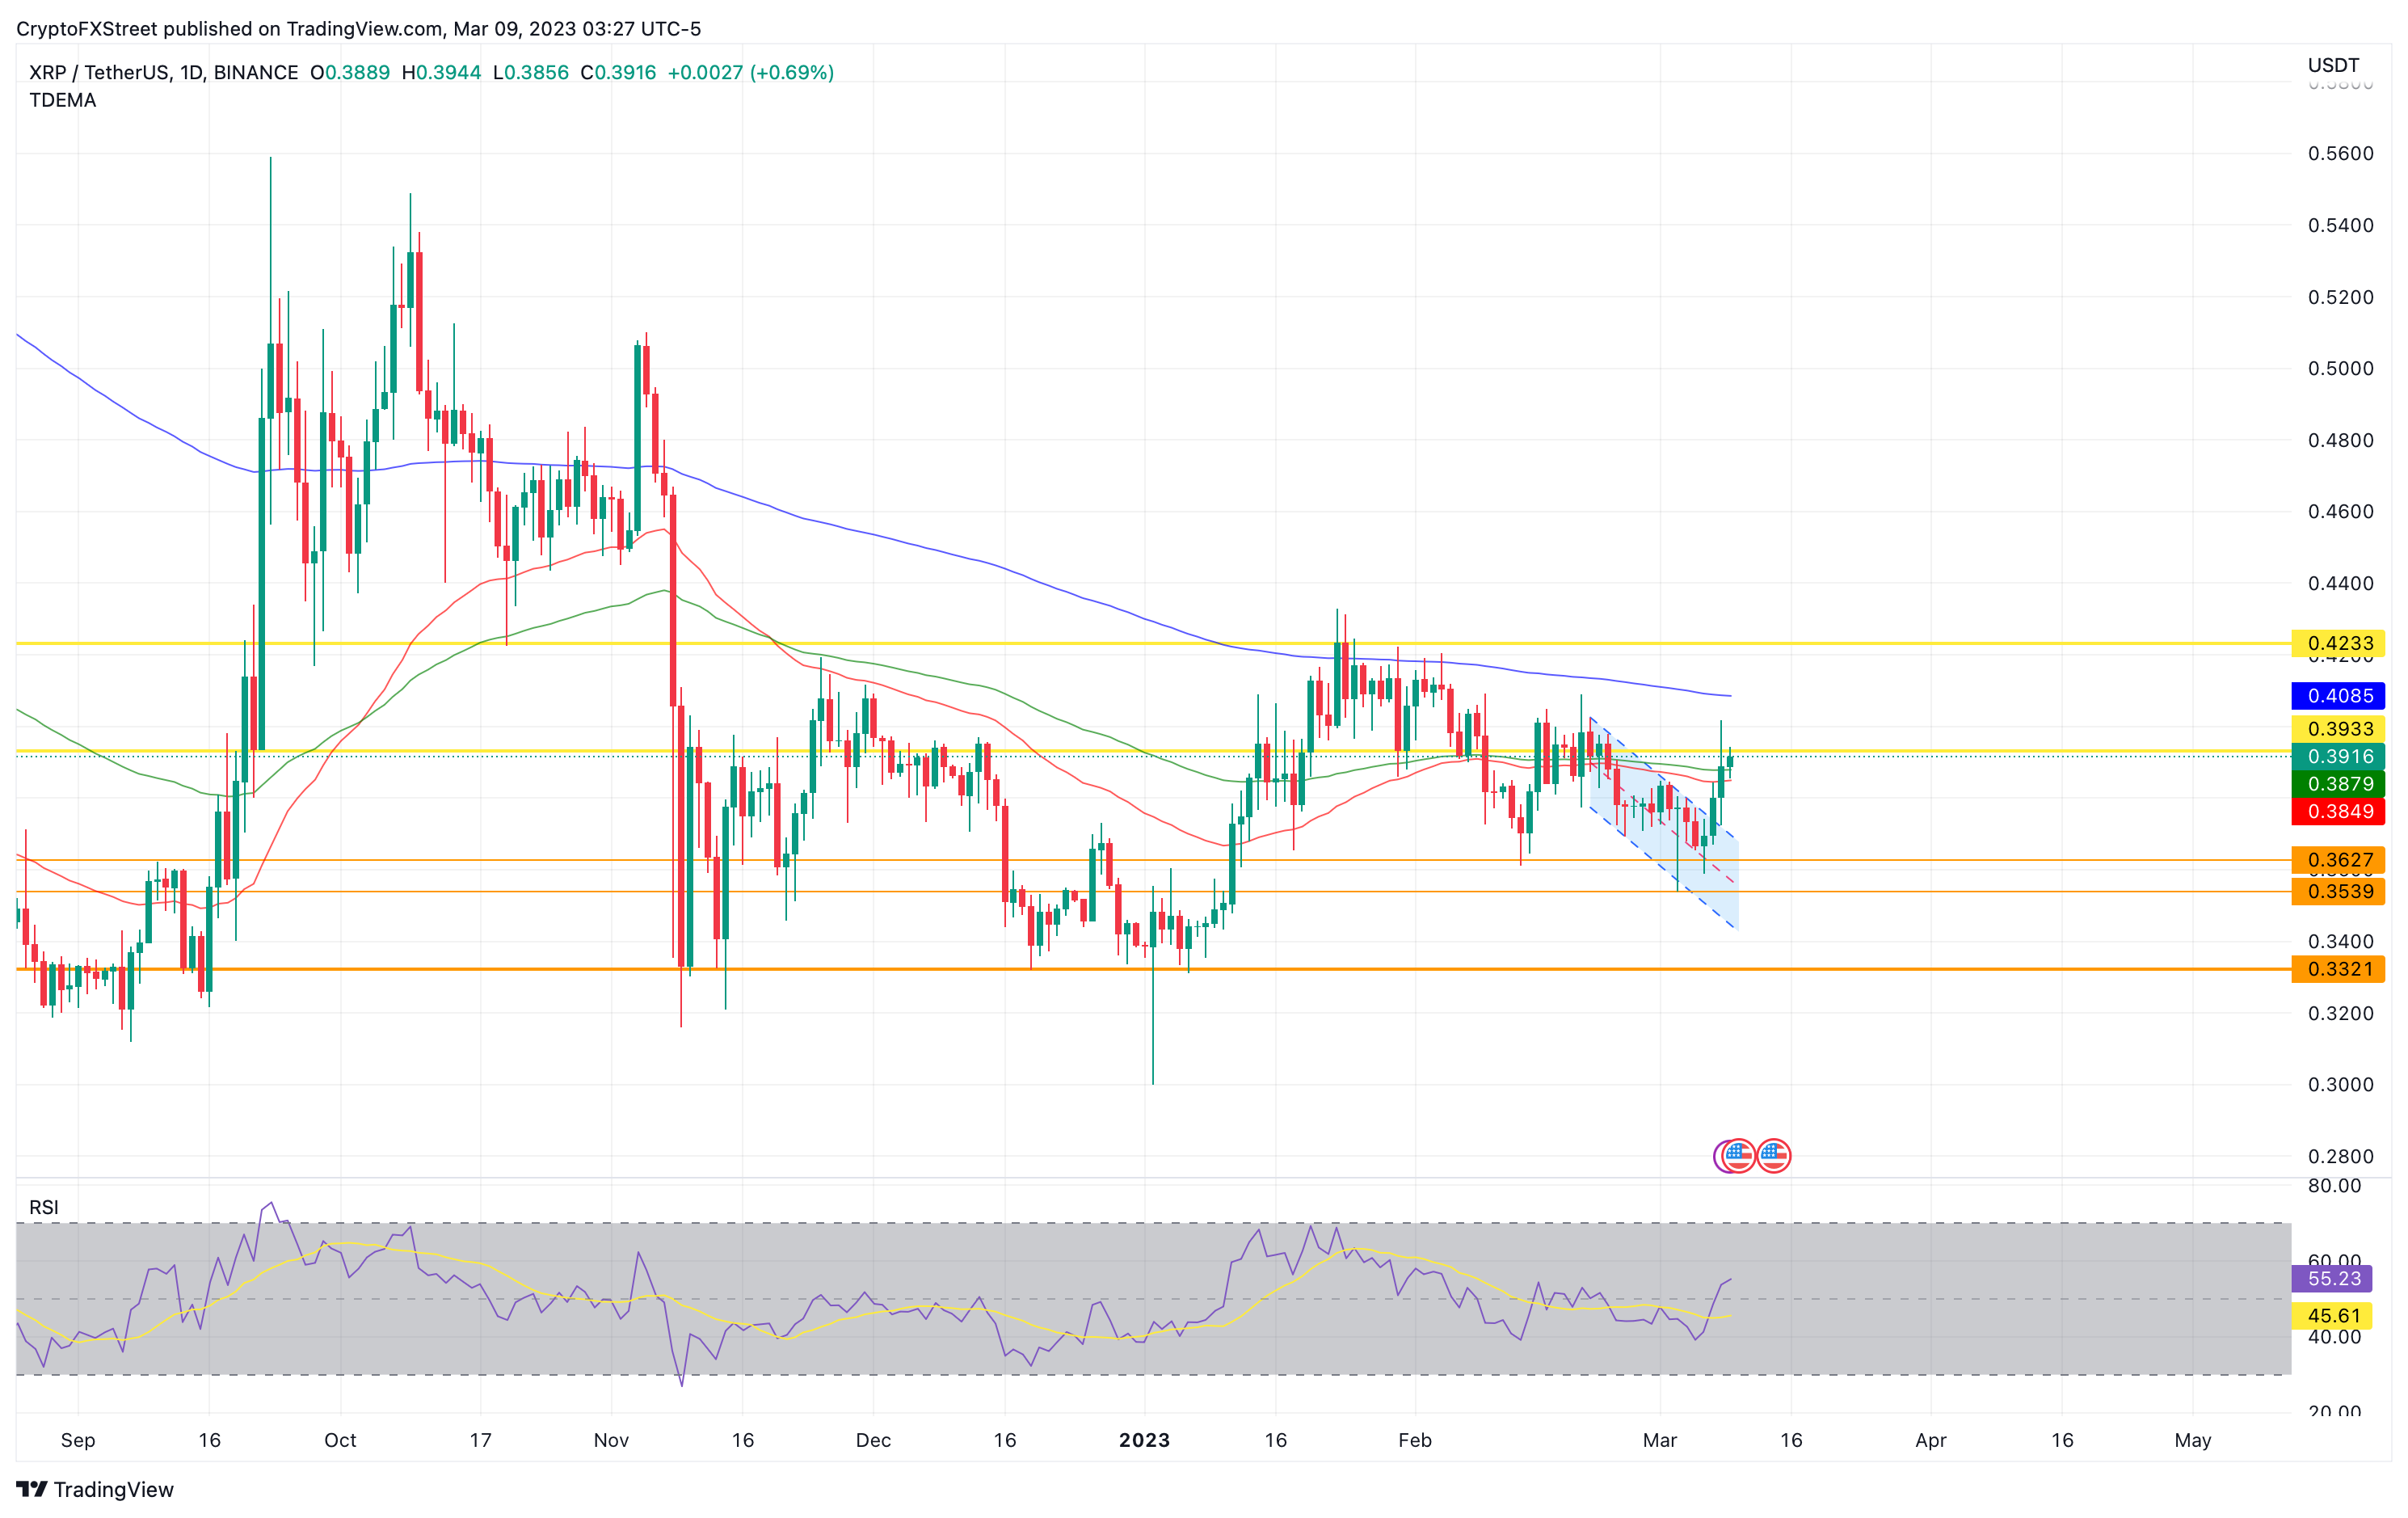
XRP/USDT 1-day chart
On the upside, Ripple price was confronting the immediate resistance level at $0.3878 offered by the 100-day EMA. A daily candlestick close above this level would invalidate the bearish case.
An increase in buying momentum past this hurdle could set XRP to fight off the next roadblock at $0.3933. Beyond this level, the next obstacle for Ripple price stood at $0.4085, presented by the 200-day EMA. Flipping this hurdle would set XRP on course to confront the $0.4233 resistance level. Such an ascent would constitute a 9.36% increase from current levels.
Author

Akash Girimath
FXStreet
Akash Girimath is a Mechanical Engineer interested in the chaos of the financial markets. Trying to make sense of this convoluted yet fascinating space, he switched his engineering job to become a crypto reporter and analyst.


