Top 3 Price Prediction Bitcoin, Ethereum, Ripple: BTC at the moment of a legitimate trend change
- Bitcoin price on course to close the week higher and above the strategically important 50-week simple moving average (SMA) at $32,290.
- Ethereum price acknowledging the resistance specified by the 200-day SMA at $2,094.
- XRP price recovers the 50-week SMA at $0.572, but now faces formidable resistance in May’s descending trend line.

Bitcoin price captured the upper line of a falling wedge pattern this week, signaling that the flagship cryptocurrency may be on to bullish outcomes. Ethereum price confronts the 2020 ascending trendline, reinforcing the 200-day SMA. XRP price has credible support at $0.51 to counter any renewal in selling pressure.
Bitcoin price benefits from a bullish pattern resolution
Bitcoin price has registered a close above the falling wedge’s upper resistance line, possibly initiating a new trend for BTC. It is the first signal that the pioneer cryptocurrency is finished testing the price range around the psychologically important $30,000 and the neckline of a head-and-shoulders pattern. To confirm the breakout, Bitcoin price needs to close the week above the resistance line and the 50-week SMA at $32,290, setting the stage for a legitimate trend change.
Aspirations for an immediate continuation of the BTC rebound are tempered by a range of resistance outlined by the 50-day SMA at $34,361 and the 10-week SMA at $34,934. In particular, the 10-week SMA invites a big challenge as Bitcoin price has not closed above the moving average since the beginning of May.
Above $34,934, Bitcoin price can target a rally to the June 15 high of $41,322 and the January high of $41,986. If momentum is sustained, BTC should surpass the 38.2% Fibonacci retracement of the April-July correction at $42,589 and eventually test the 200-day SMA at $42,604, completing a 38% gain from the current price.
It is essential to remain patient for the rally to gain traction and be mindful that the declining 50-day SMA will try to pull down on Bitcoin price as the move develops.
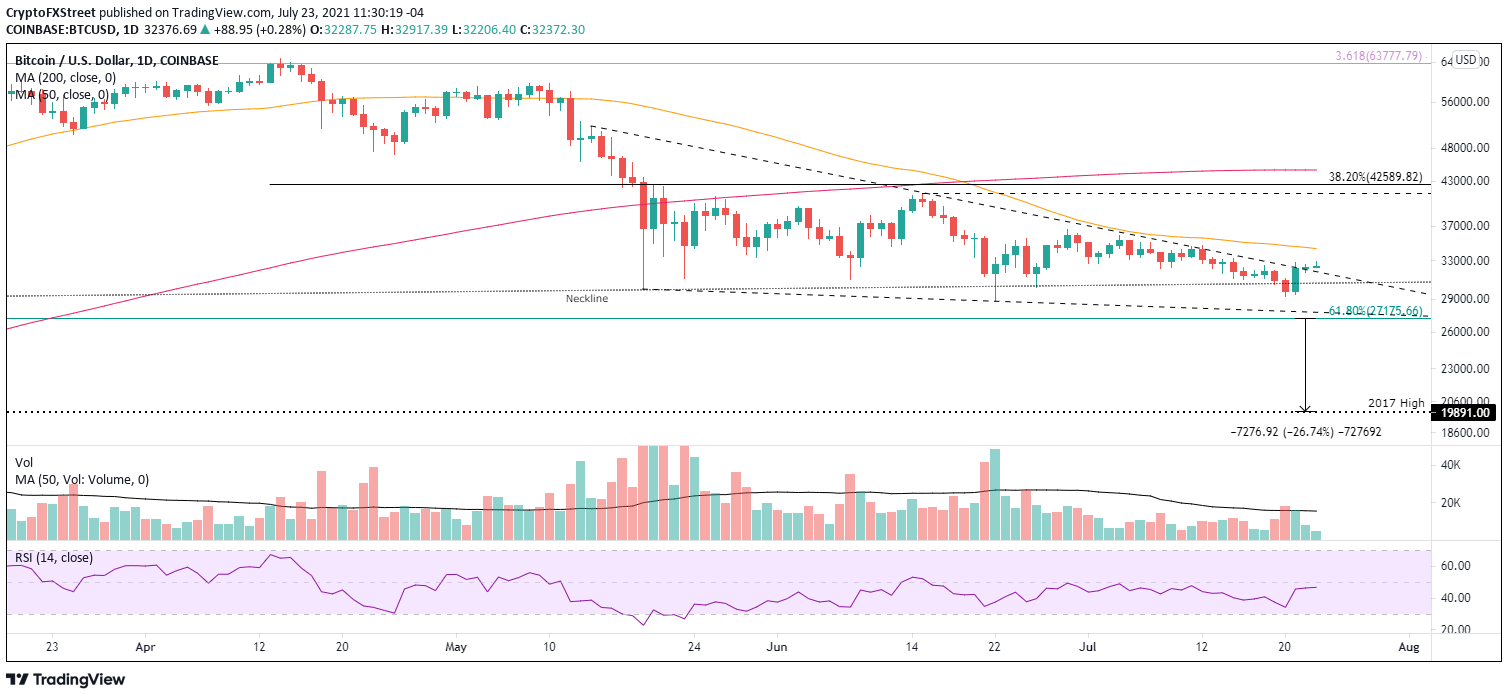
BTC/USD daily chart
A collective sell-off in the cryptocurrency complex could undermine the developing trend change. Bitcoin price needs to hold the falling wedge’s lower support line at $27,725 and the 61.8% retracement level of the advance beginning in March 2020 at $27,175 on a daily closing basis.
A BTC failure to engage those levels exposes it to a drop to the 2017 high of $19,981, constituting a 27% loss from the 61.8% retracement level.
From an on-chain perspective, Bitcoin price is not well supported according to the Daily Active Addresses. Interaction with the platform continues to trend down based on the 30 eight-hour SMA. The current level of the moving average shows activity is now at the lowest level since January 7.

BTC Daily Active Addresses - Santiment
A second concern for BTC is the negative or neutral funding rates over the last two months. The rates reveal that investors continue to build short positions despite the marginal new lows printed since May 19.
However, once a semblance of an uptrend is accomplished, there could be a buying stampede as shorts are forced to cover positions.
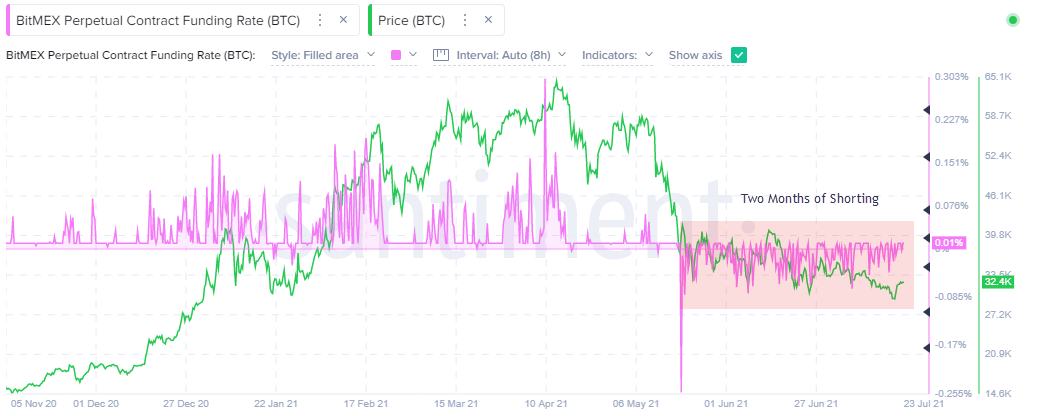
BTC BitMEX Funding Rate - Santiment
Here, FXStreet's analysts evaluate where BTC could be heading next as it seems bound for a rebound before capitulation.
Ethereum price reaches target, now focused on resistance levels
Only July 20, Ethereum price successfully tested the impressive resistance around $1,700, formulated by the May 23 low of $1,728, the June 22 low of $1,700, the June 26 low of $1,717 and the 61.8% Fibonacci retracement of the ETH rally beginning in March 2020 at $1,730. The average of the four levels is $1,719, and the July 20 low was $1,718.
The gain of almost 12% on July 21 was a telling reply to the successful test of the support, carrying Ethereum price to a trifecta of a resistance framed by the influential February high of $2,041, the 200-day SMA at $2,094 and the 2020 ascending trend line at $2,110. Over the three days, ETH has recorded a 19% rally.
To dream of more significant returns, Ethereum price needs to achieve a daily close above the 2020 ascending trend line, currently at $2,110. It would release ETH to test the 50-day SMA at $2,184 and, more importantly, extend the rally to the descending triangle’s upper trend line at $2,485, generating a 42% homerun from the July 21 low.
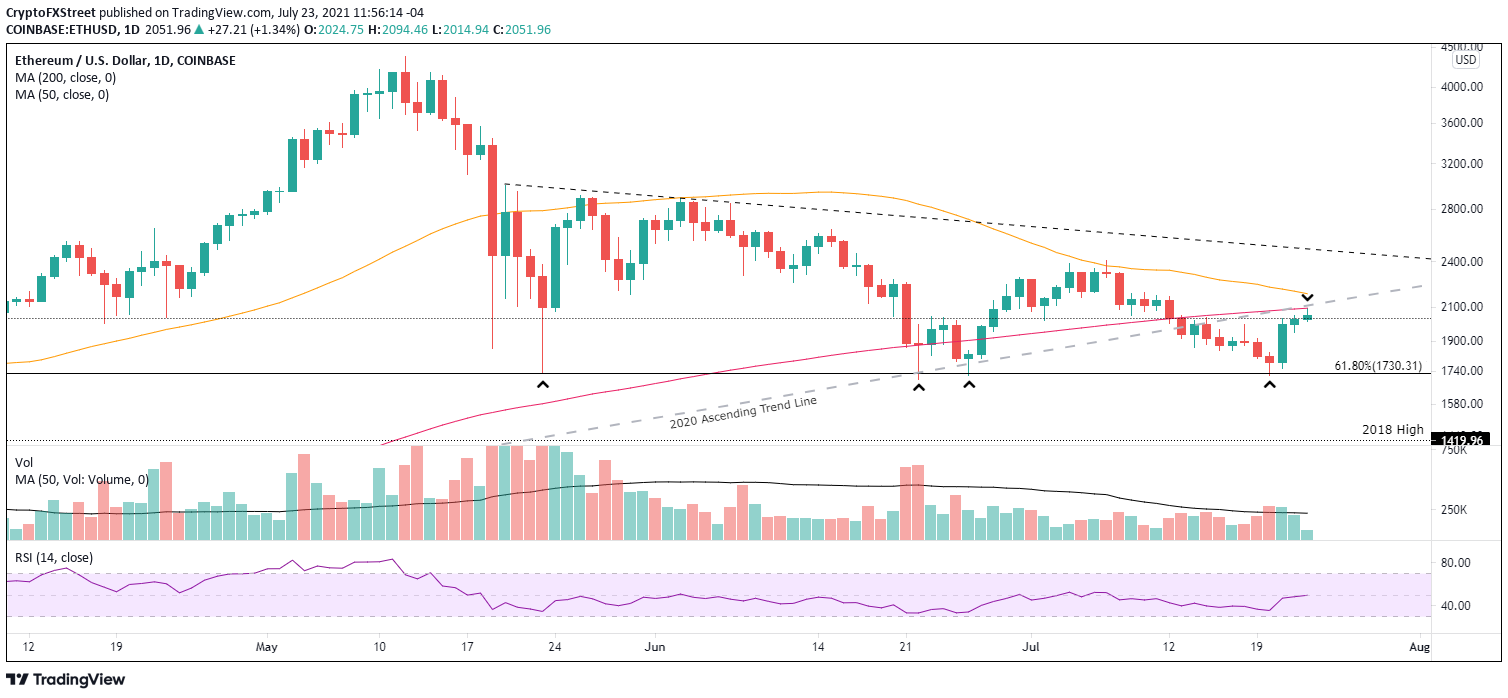
ETH/USD daily chart
If Ethereum price cannot overcome the resistance, investors should prepare for a new test of the $1,700 range. A daily close below $1,700 shifts the focus to the support marked by the 2018 high of $1,419. The 50-week SMA strengthens the support at $1,415.
Here, FXStreet's analysts evaluate where ETH could be heading next as it seems bound for a breakout after holding above key support.
XRP price recovers support, but doubts linger
XRP price recorded an 8% gain on July 21, placing the international settlements token above the 78.6% Fibonacci retracement of the advance beginning in December 2020 at $0.555. Moreover, yesterday’s follow-through raised Ripple above the 50-week SMA at $0.571, setting the weekly chart up for a bullish hammer candlestick.
To confirm the low on July 20 at $0.516 and bullish XRP price intentions, Ripple needs a daily close above May’s declining trend line at $0.620 and the critical resistance associated with the May 23 low of $0.652.
Suppose a collective rally gains traction in the cryptocurrency complex. In that case, XRP price may engage the 50-day SMA at $0.706 before encountering the intimidating resistance bordered by the converging 200-day SMA at $.759 and the neckline of an inverse head-and-shoulders pattern at $0.773.
To avoid the XRP price churn associated with multiple layers of resistance, it is recommended to use weakness down to the 78.6% retracement level at $0.555 to accumulate Ripple, with a stop at the June 22 low of $0.512. A successful execution would reveal the potential for a 38% gain from the retracement level.
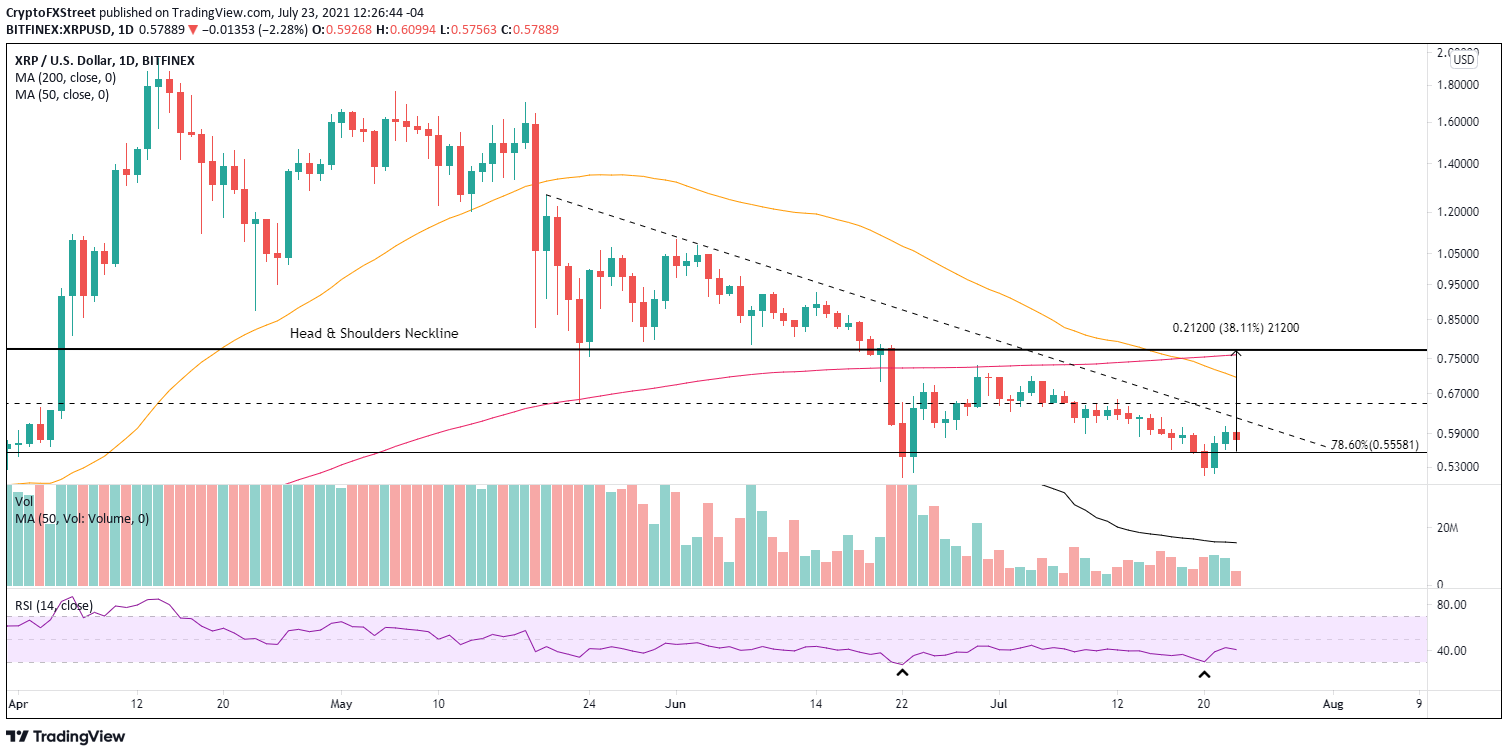
XRP/USD daily chart
So far, the XRP price strength is not proving to be a one-day event, but a daily close below the June 22 low of $0.512 raises the probability that Ripple will test the 200-week SMA (mean) at $0.457. Any additional weakness would imply bigger issues for the cryptocurrency.
Events this week have reignited an interest in the cryptocurrency market, motivating market operators to trigger pilot buys for the first time in a few weeks. For now, it is all about the weekly close and where it positions the three crypto majors relative to influential moving averages and support and resistance levels. With the improved technicals, investors can explore bullish outcomes for the rest of the summer.
Here, FXStreet's analysts evaluate where Ripple could be heading next as it seems bound for an upswing before lower lows.
Author

Sheldon McIntyre, CMT
Independent Analyst
Sheldon has 24 years of investment experience holding various positions in companies based in the United States and Chile. His core competencies include BRIC and G-10 equity markets, swing and position trading and technical analysis.


