Top 3 Price Prediction Bitcoin, Ethereum, Ripple: Bitcoin volatility surges amid impact of US CPI data
- Bitcoin price finds resistance around the weekly level of $58,375; a breakout of this level could signal a bullish move.
- Ethereum finds support around the key level at $2,817, with potential recovery on the cards.
- Ripple price finds support around the weekly support level of $0.413, impending rally eyed.

Bitcoin (BTC) initially dipped before rallying after the release of US CPI data on Wednesday. Ethereum (ETH) and Ripple (XRP) are possibly set to mirror BTC’s pattern, showcasing the synchronized dance of cryptocurrency markets.
Bitcoin price shows potential
Bitcoin has encountered resistance near the $58,375 weekly resistance throughout this week. As of Friday, BTC is trading at $57,250, showing a slight decline of 0.2%.
Furthermore, BTC is currently below a descending trendline formed by connecting multiple swing high levels from early June to mid-July.
If BTC closes above the weekly resistance at $58,375 and a breakthrough above the descending trendline could potentially lead to a 9% increase, targeting a revisit of the daily resistance at $63,956.
Moreover, the daily chart shows a lower low formation on July 5, while the Relative Strength Index (RSI) indicated a higher high during the same period. This bullish divergence often signals a trend reversal or a short-term rally.
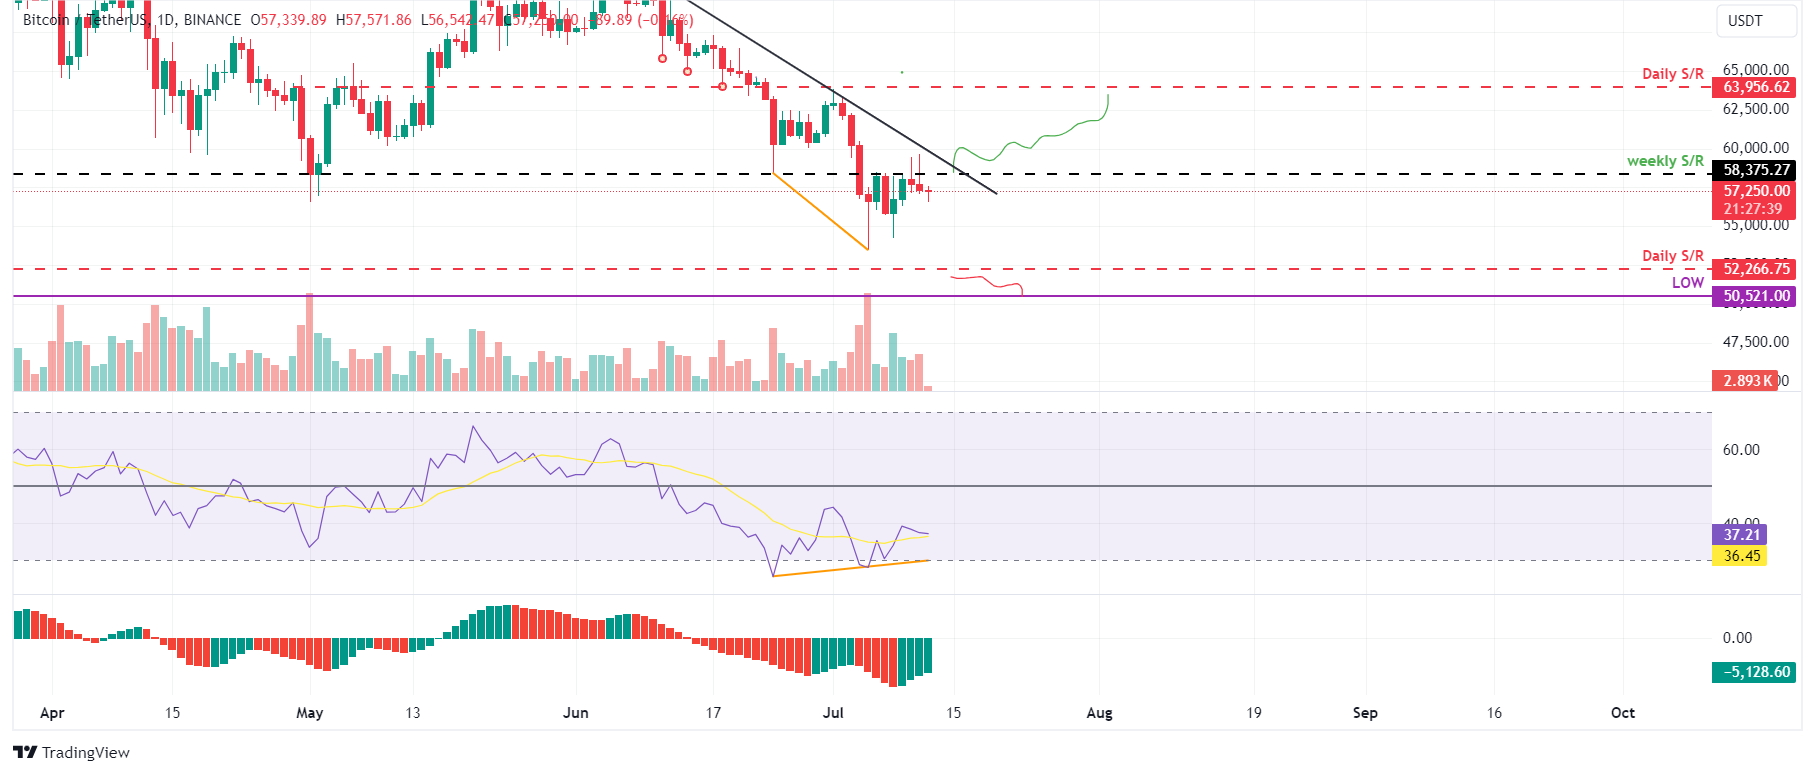
BTC/USDT daily chart
Conversely, if BTC closes below the daily support level at $52,266 and forms another lower low in the daily timeframe, it could indicate continued bearish sentiment. Such a scenario might trigger a 4% decline in Bitcoin's price, potentially revisiting the low of $50,521 observed on February 23.
Ethereum price displays resilience with promising upside
Ethereum's price found support on Monday at $2,817, which was its low on May 1. It rebounded by 2.7% in the next two days. As of Friday, it is trading slightly up by 0.32% at $3,059.
If Ethereum's price closes above the $3,240 level, ETH could potentially increase 8.8%, targeting a retest of its daily high from July 1 at $3,524.
The Relative Strength Index (RSI) and the Awesome Oscillator (AO) on the daily chart are currently below their respective neutral levels of 50 and zero. For bullish momentum to be sustained, both indicators need to rise above these critical levels, which could support the ongoing recovery rally.
Furthermore, surpassing the $3,524 level could open the way for an additional 5.5% rise, aiming to retest the next daily high, recorded at $3,717 on June 9.
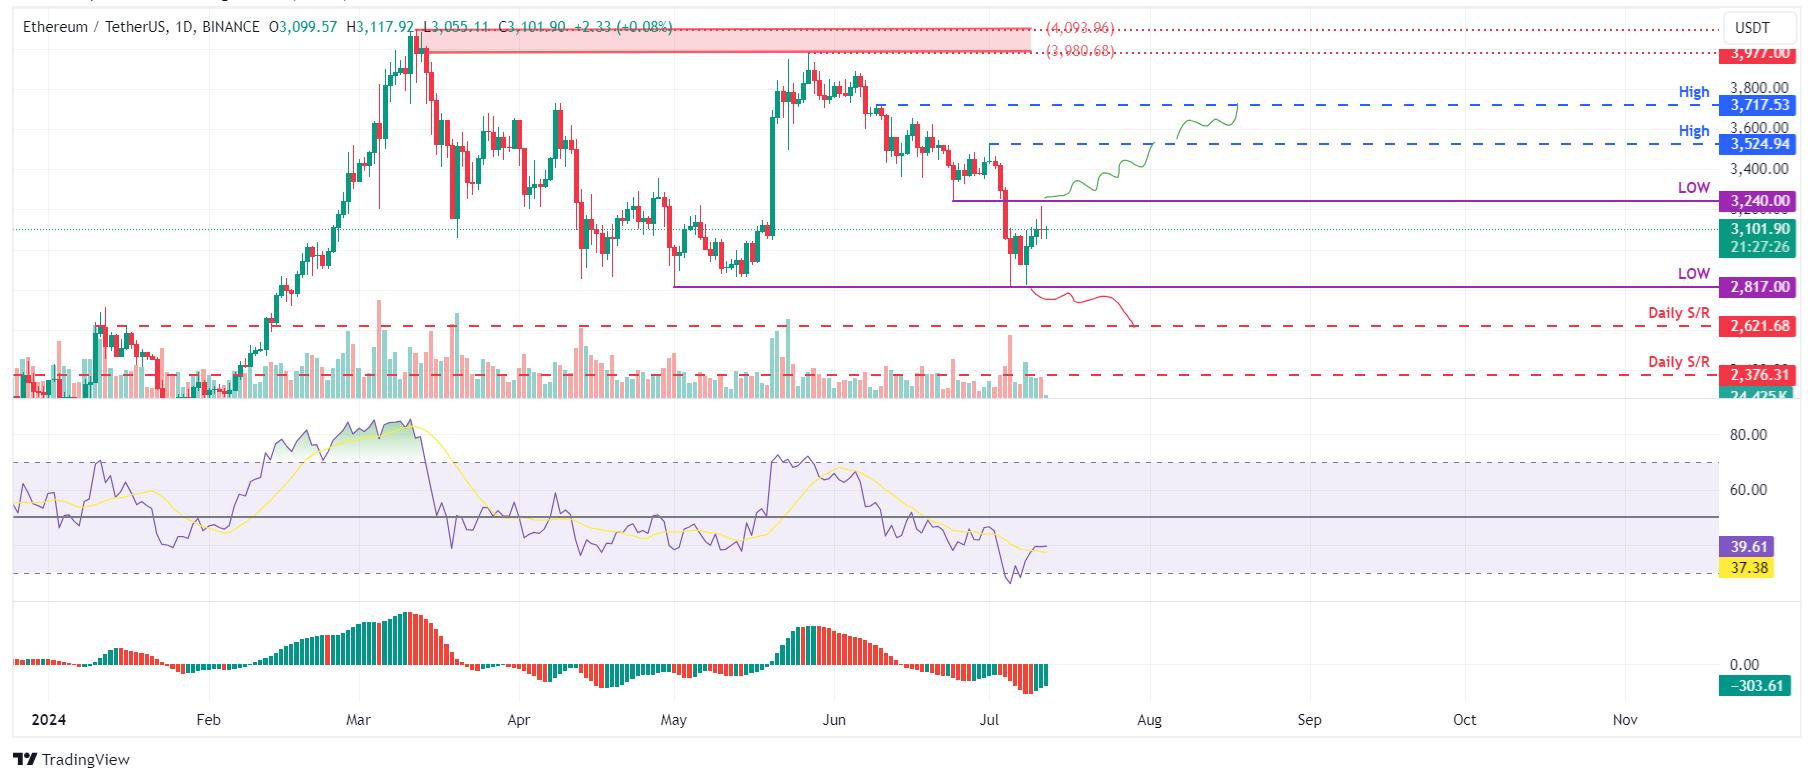
ETH/USDT daily chart
On the other hand, if Ethereum's daily candlestick closes below $2,817, forming a lower low in the daily timeframe, it may signal persistent bearish sentiment. This scenario could potentially trigger a 7% decline in Ethereum's price, targeting a revisit of its daily support at $2,621.
Ripple price eyes a rally
Ripple's price found support near the weekly mark of $0.413 early this week, rebounding by 4% over the subsequent two days. As of Friday, it trades up by 0.6% to trade at $0.452.
A daily close above the $0.450 threshold for XRP could potentially fuel an 11% rally, targeting a revisit of its daily resistance level at $0.499.
On the daily chart, both the Relative Strength Index (RSI) and the Awesome Oscillator (AO) are currently positioned below their critical thresholds of 50 and zero, respectively. To maintain bullish momentum, these indicators need to rise above these levels, potentially bolstering the ongoing recovery.
Furthermore, surpassing the $0.499 level could pave the way for an additional 6.4% increase, aiming to retest the next daily high at $0.532 recorded on June 5.
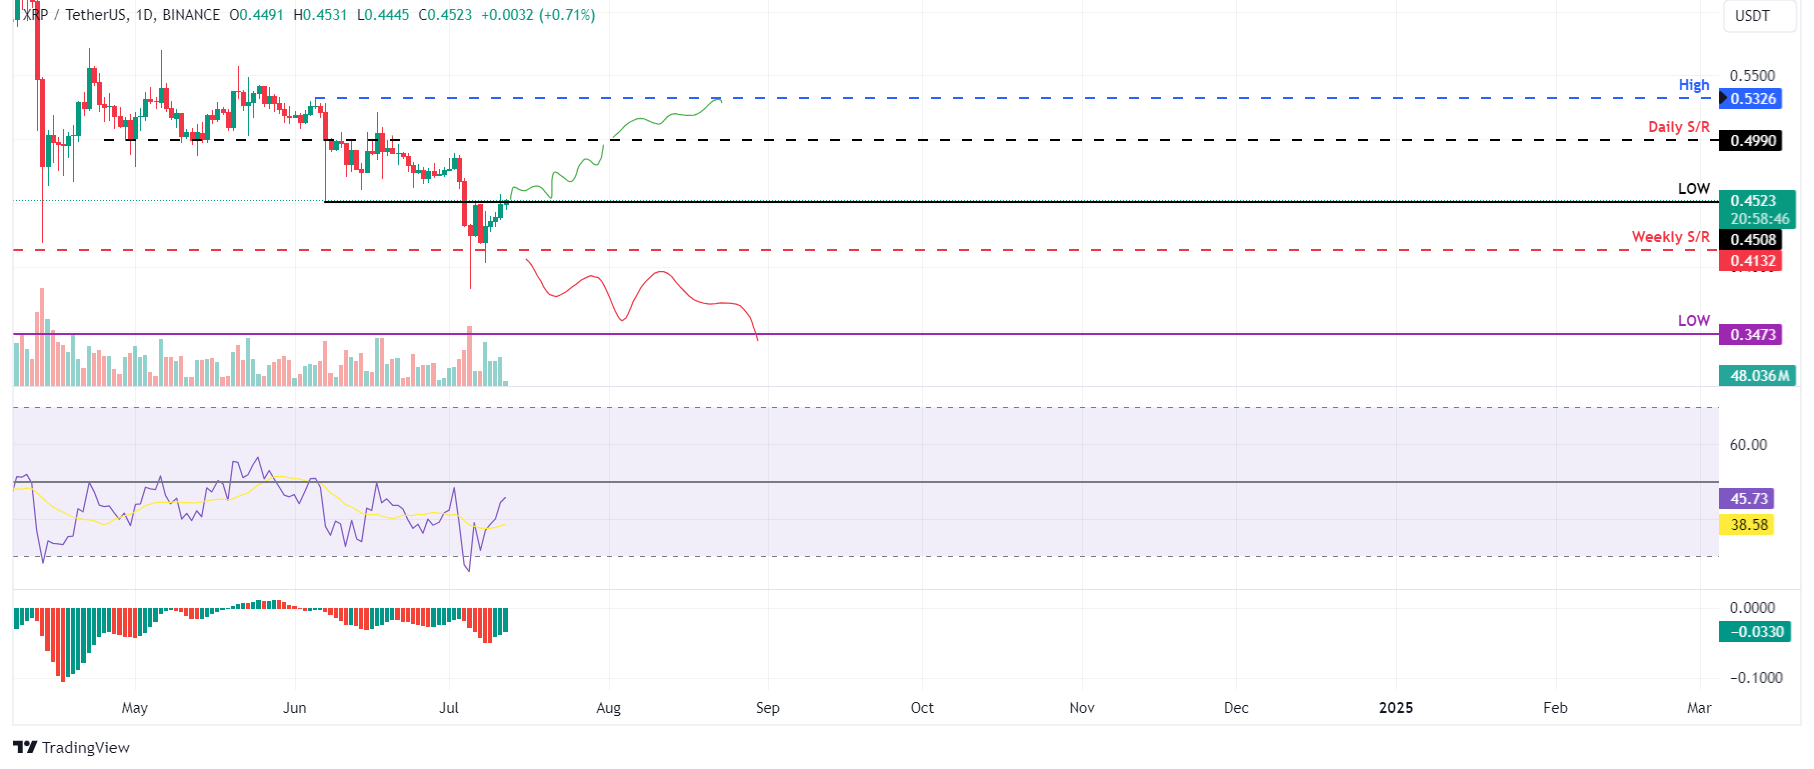
XRP/USDT daily chart
However, if Ripple's daily candlestick closes below $0.413, forming a lower low in the daily timeframe, it indicates sustained bearish sentiment. Such a scenario could potentially lead to a 16% decline in Ripple's price, targeting a revisit of its low from March 12 at $0.347.
Author

Manish Chhetri
FXStreet
Manish Chhetri is a crypto specialist with over four years of experience in the cryptocurrency industry.


