Top 3 Price Prediction Bitcoin, Ethereum, Ripple: Bitcoin price could decline as it nears $62,000 resistance level
- Bitcoin price fails to rise and remains within its broad consolidation zone between $57,000 and $62,000.
- Ethereum's price is at risk of a decline as it approaches its key resistance level of around $2,800.
- Ripple price finds stability around the daily support level of $0.544, with potential recovery on the cards.

Bitcoin (BTC) and Ethereum (ETH) prices could drop following their inability to break through their key resistance levels, as momentum indicators indicate a bearish bias. Ripple (XRP) price shows stability near its $0.544 daily support level, suggesting a possible comeback.
Bitcoin price is poised for a down leg as it nears $62,000 level
Bitcoin price has remained between $57,115 and $62,066 (the Fibonacci retracement levels of 38.2% and 61.8%, respectively, drawn from the high on July 29 to the low on August 5) for the last 15 days. As of Friday, it trades slightly up by 0.7% at $60,772 and approaches its key resistance level at $62,066.
If BTC fails to close above the $62,066 level, it could drop to $57,115 before potentially declining by 19% to revisit the $49,917 daily support level.
On the daily chart, the Relative Strength Index (RSI) trades around its neutral level of 50, and the Awesome Oscillator (AO) still trades below its neutral level of zero, suggesting a weak momentum and an impending bearish trend.
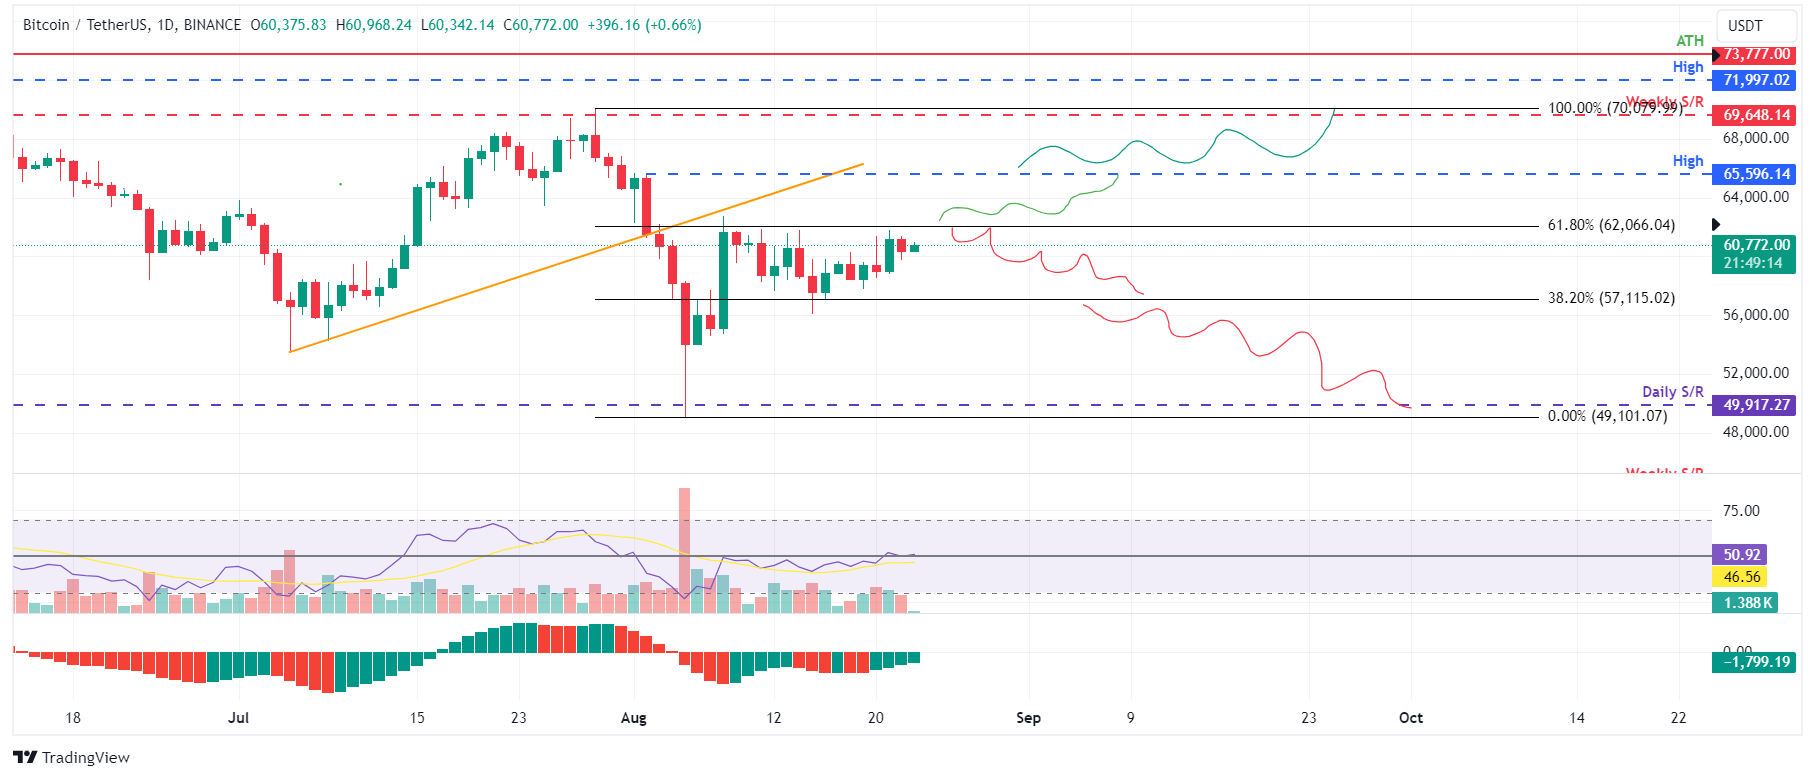
BTC/USDT daily chart
However, if Bitcoin price closes above $62,066, a rise towards the August 2 high of $65,596 would be on the cards as it would set a higher high on the daily chart. This could lead to a further 6% price increase to test the weekly resistance at $69,648.
Ethereum price could decline as it approaches its key resistance level
Ethereum price has been consolidating for the last 11 days between its 50% retracement level of $2,843 (based on the swing high of $3,562 from July 22 and the swing low of $2,124 from August 5) and the August 12 low of $2,510. As of Friday, it's trading slightly higher by 0.7% at $2,641.
If the $2,843 level holds as resistance, it may drop to $2,510 before potentially declining by 4.5% to test the psychological support at $2,400.
On the daily chart, the RSI and AO trade below their neutral levels of 50 and zero, respectively, suggesting an impending bearish trend.
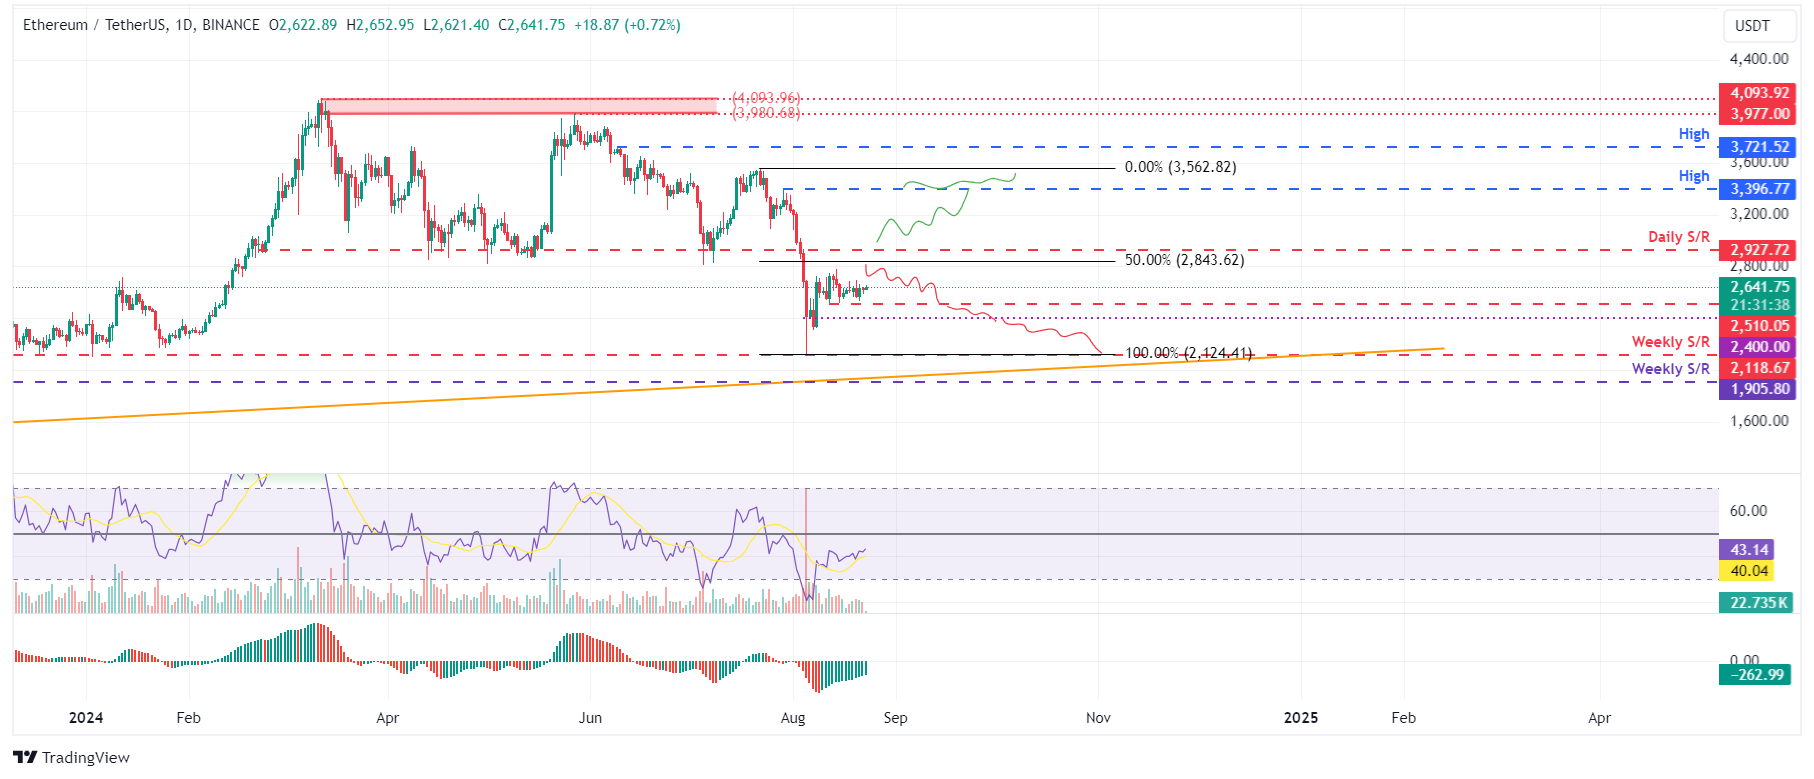
ETH/USDT daily chart
Conversely, if Ethereum price closes above $2,843, it could rise to the July 29 high of $3,396, forming a higher high on the daily chart, potentially driving a 5% increase to revisit the July 22 high of $3,562.
Ripple price is set for a rally after finding support around the daily level
Ripple price found support around its daily support level of $0.544, which coincides with the 100-day EMA at $0.547 on August 16. It rose 6.5% in the following three days. As of Friday, it trades slightly higher by 0.5% at $0.600.
If the daily support at $0.544 holds, XRP could continue to rally 7% from its current trading level at $0.600 to challenge the next resistance level at $0.643.
The daily chart's RSI and AO have flipped above their neutral levels of 50 and zero, respectively. These momentum indicators indicate bullish dominance.
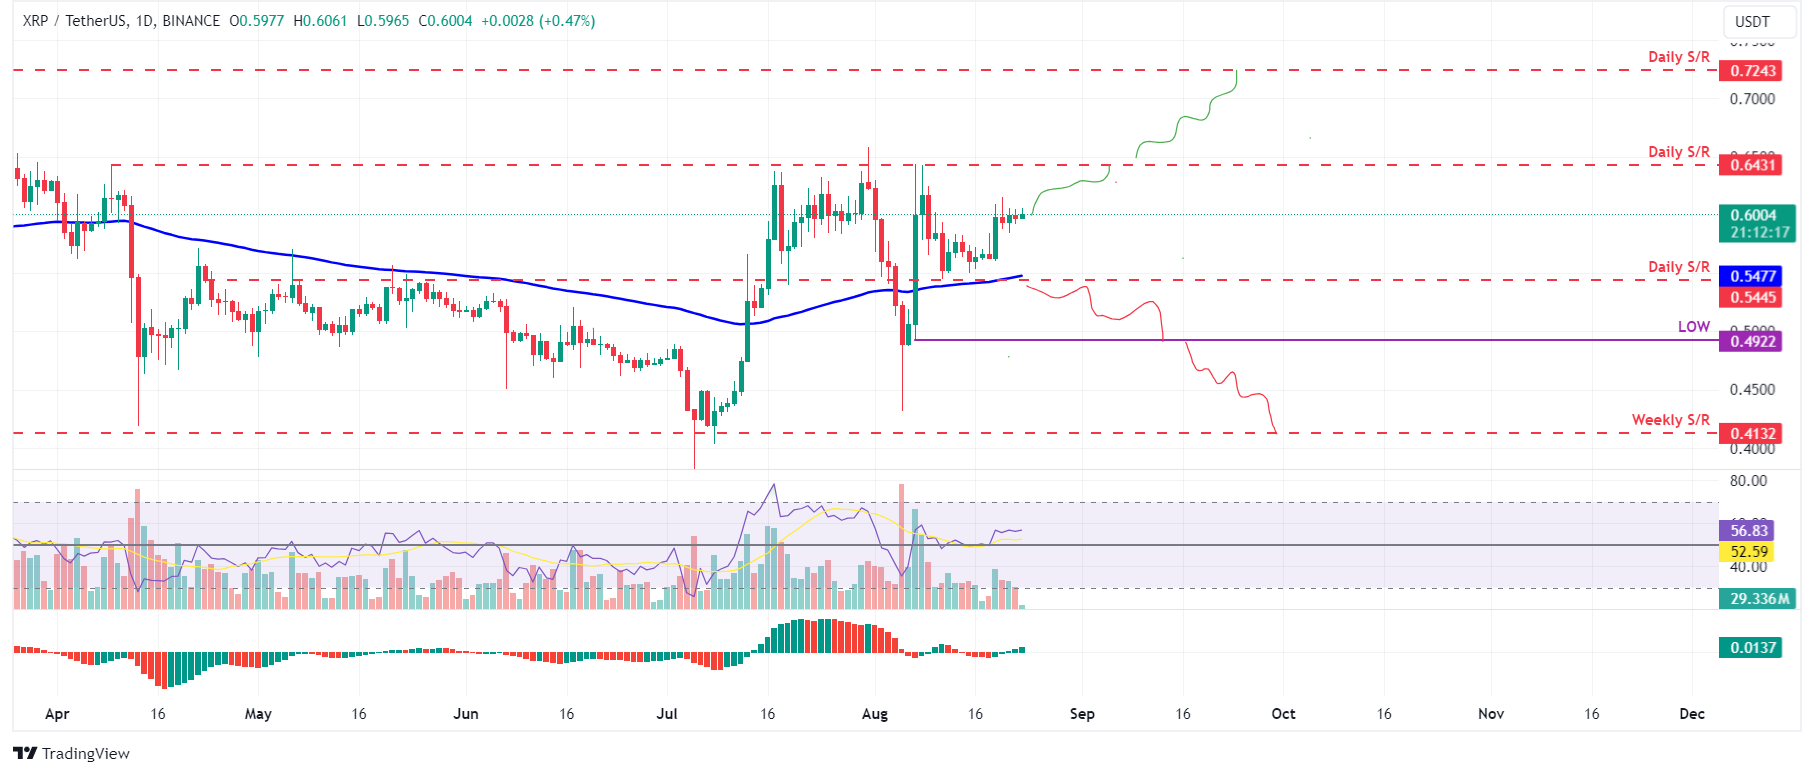
XRP/USDT daily chart
However, if Ripple price closes below the $0.544 daily support level, it would shift the market structure by creating a lower low on the daily chart, potentially leading to a 9.5% decline to revisit the August 7 low of $0.492.
Cryptocurrency metrics FAQs
The developer or creator of each cryptocurrency decides on the total number of tokens that can be minted or issued. Only a certain number of these assets can be minted by mining, staking or other mechanisms. This is defined by the algorithm of the underlying blockchain technology. Since its inception, a total of 19,445,656 BTCs have been mined, which is the circulating supply of Bitcoin. On the other hand, circulating supply can also be decreased via actions such as burning tokens, or mistakenly sending assets to addresses of other incompatible blockchains.
Market capitalization is the result of multiplying the circulating supply of a certain asset by the asset’s current market value. For Bitcoin, the market capitalization at the beginning of August 2023 is above $570 billion, which is the result of the more than 19 million BTC in circulation multiplied by the Bitcoin price around $29,600.
Trading volume refers to the total number of tokens for a specific asset that has been transacted or exchanged between buyers and sellers within set trading hours, for example, 24 hours. It is used to gauge market sentiment, this metric combines all volumes on centralized exchanges and decentralized exchanges. Increasing trading volume often denotes the demand for a certain asset as more people are buying and selling the cryptocurrency.
Funding rates are a concept designed to encourage traders to take positions and ensure perpetual contract prices match spot markets. It defines a mechanism by exchanges to ensure that future prices and index prices periodic payments regularly converge. When the funding rate is positive, the price of the perpetual contract is higher than the mark price. This means traders who are bullish and have opened long positions pay traders who are in short positions. On the other hand, a negative funding rate means perpetual prices are below the mark price, and hence traders with short positions pay traders who have opened long positions.
Author

Manish Chhetri
FXStreet
Manish Chhetri is a crypto specialist with over four years of experience in the cryptocurrency industry.


