Top 3 Price Prediction Bitcoin, Ethereum, Ripple: Bitcoin points to $288K, according to the S2F ratio
- According to crypto analyst Plan B, the average price level for the next Bitcoin bullish move is beyond $250K.
- The fight for market shares between cryptocurrencies continues and sets the pace of events.
- Volatility is likely to increase in the coming sessions, a trend that could last for months.

The crypto market continues to move forward as if nothing has changed after the halving event. In the previous halvings, the bullish reaction of Bitcoin – and the whole crypto board – only started on average after six months.
A leading analyst in the crypto ecosystem on Twitter, Plan B (https://twitter.com/100trillionUSD), has tweeted its post-halving price forecast for Bitcoin. According to their S2F (Stock to Flow) model, the price of Bitcoin would start a strong upward movement six months after the event (November 2020). Plan B expects BTC/USD to move into a price range around $288000 by 2024.
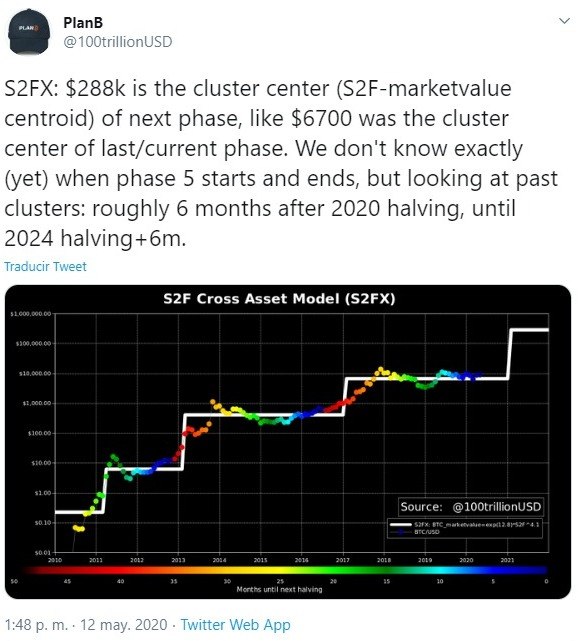
Source: Twitter
The BTC/USD pair tries again this morning to break above the $9000 level without success, while in the case of ETH/USD it is the $190 level that limits a possible recovery from last week's levels. The worst performer in the top 3 is the XRP/USD pair, which lost support in the weekend sell-off and is in a weak position until it breaks through the $0.20 level.
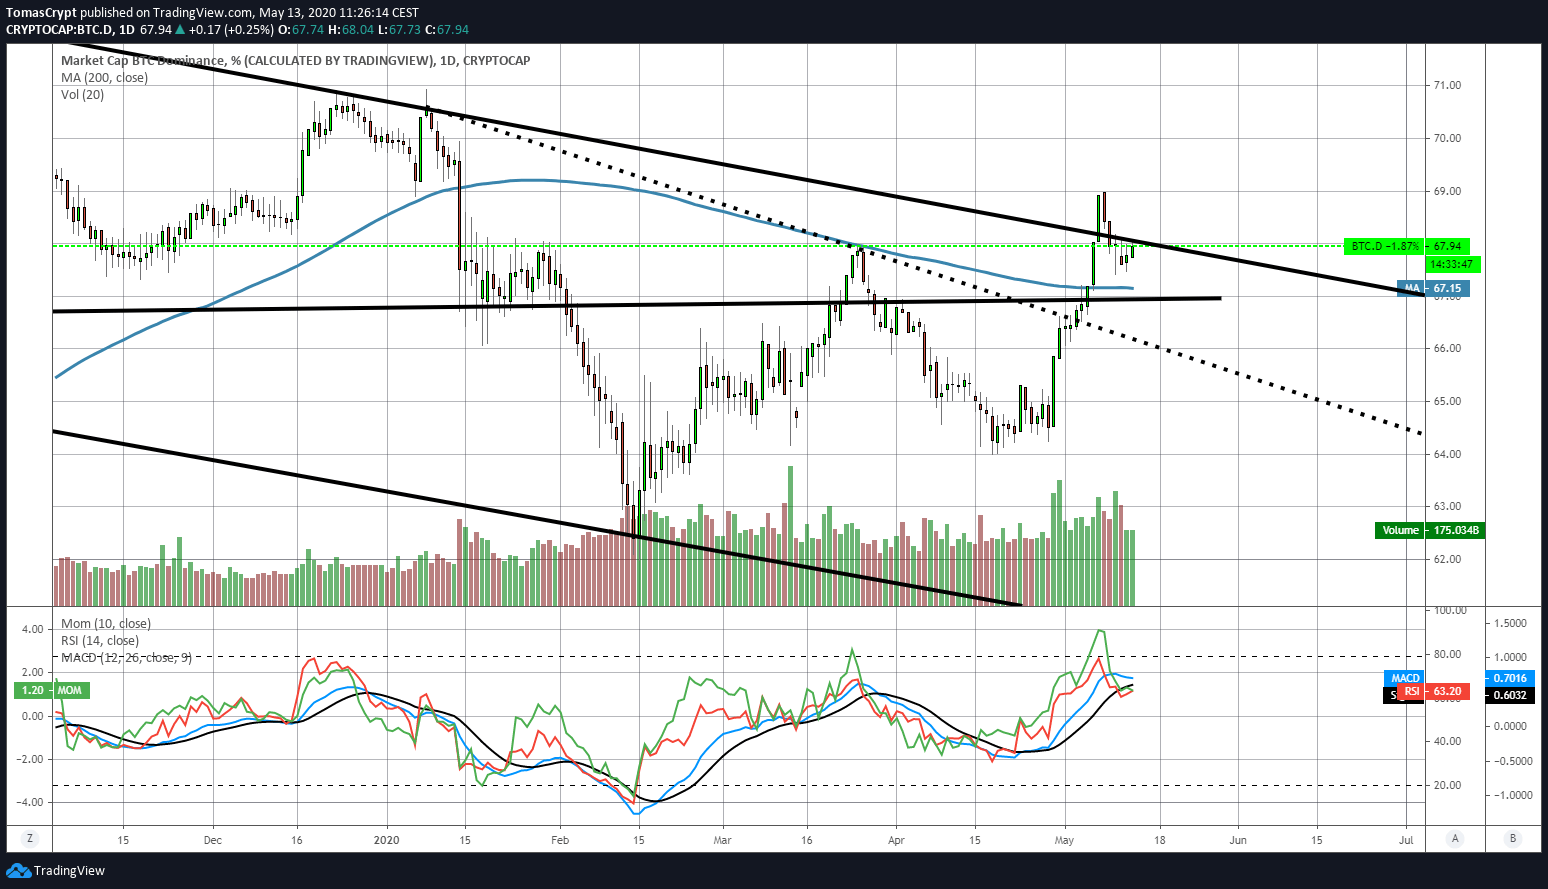
In the dispute for dominance in the crypto market, Bitcoin fails to break the upper limit of the long-term bearish channel. Indicators show potential for a final upward breakout attempt, but not enough to get much distance from current levels.
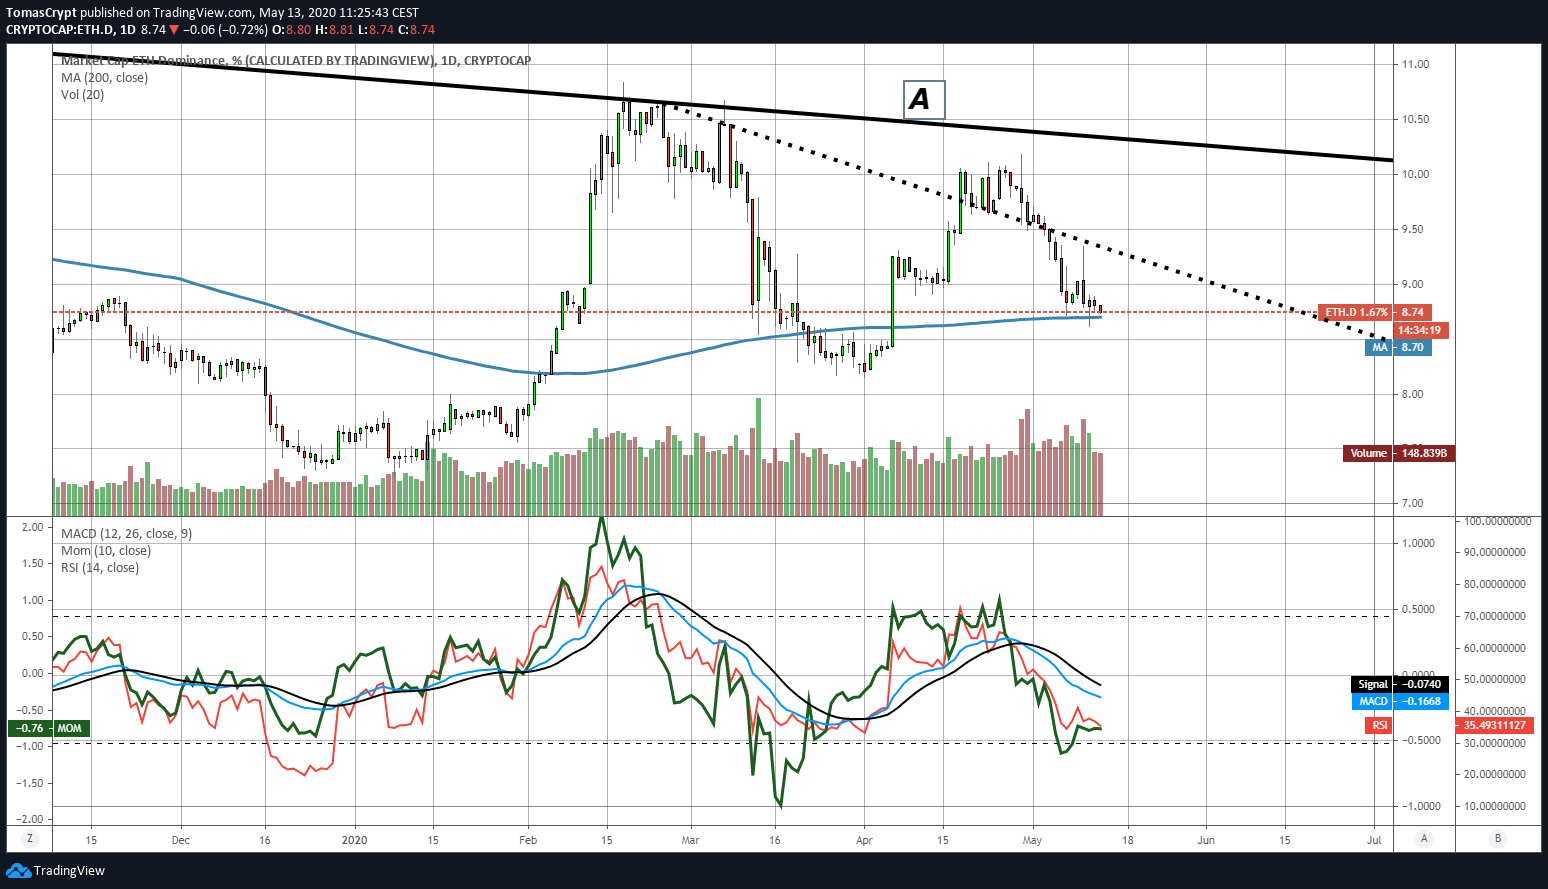
The Ethereum dominance chart shows the other side of the coin and is still waiting on the 200-day moving average to launch its attack. Technical indicators are beginning to show signs of upward pressure, but it seems unlikely that the bullish structure will be complete until the end of this month.
Market sentiment is improving by two points from yesterday, and the 41 level indicates that fear is the dominant factor at the moment.
ETH/BTC Daily Chart
The ETH/BTC pair is currently trading at the price level of 0.0213 and is moving dangerously far away from the 200-day simple moving average. If the downward movement is confirmed, the target would be the 0.0203 level. At this level, a price congestion support and an uptrend line that begins at the January lows converge. The time projection marks the end of this month as the probable date for this – not yet confirmed – bearish movement.
Above the current price, the first resistance level is at 0.221, then the second at 0.227 and the third one at 0.235.
Below the current price, the first support level is at 0.203, then the second at 0.198 and the third one at 0.187.
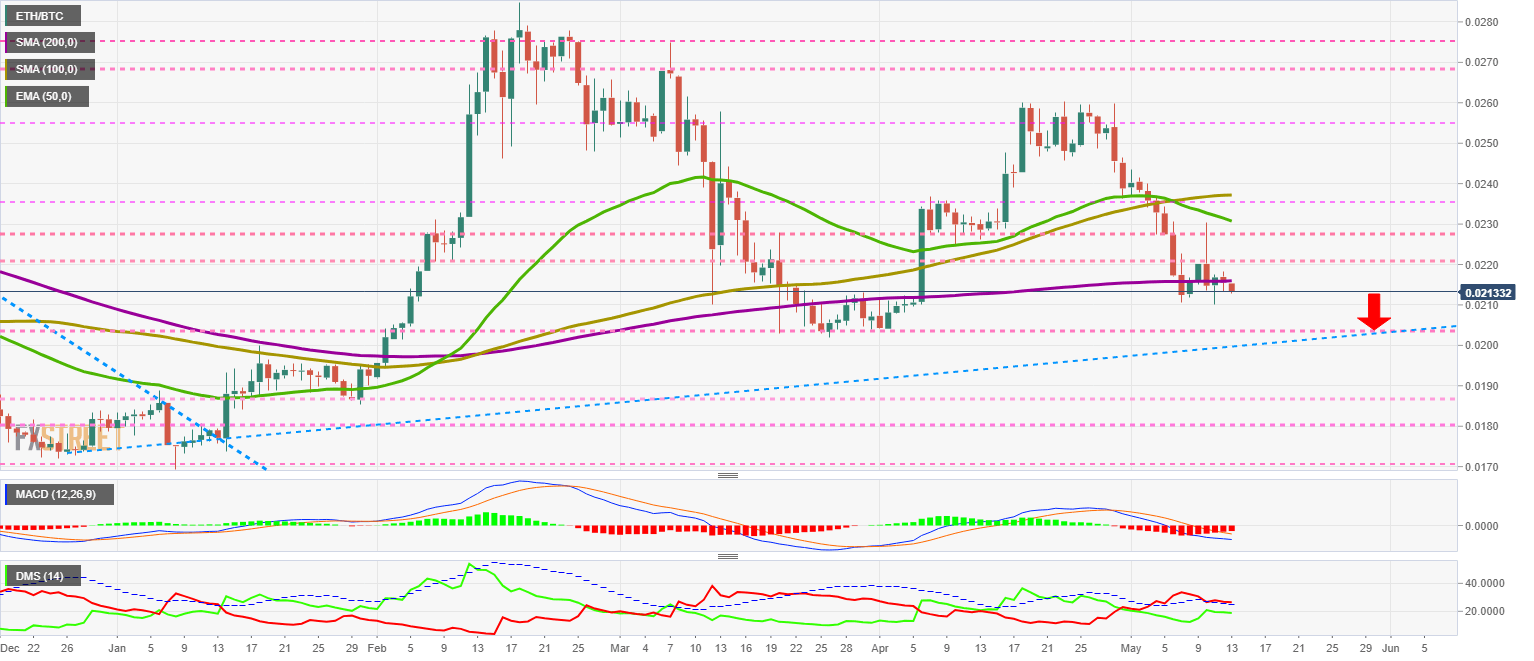
The MACD on the daily chart retains the previous bearish profile. If it improved a little yesterday, it makes the opposite move today and worsens enough to risk the current price levels.
The DMI on the daily chart shows the bears holding well above the ADX line and retains all the downward potential. The bulls remain confident that they can enter the leadership contest and maintain a healthy level of strength.
BTC/USD Daily Chart
The BTC/USD pair is currently trading at the price level of $8906 and is unable to break through the $9000 resistance level. The main moving averages are concentrated around the $8000 level forming a bullish golden cross. This remarkable confluence of key technical indicators is going to have a strong pull on the price, and we may see this level in the BTC/USD pair soon.
Above the current price, the first resistance level is at $9150, then the second at $9650 and the third one at $10,000.
Below the current price, the first support level is at $8800, then the second at $8400 and the third one at $8200.
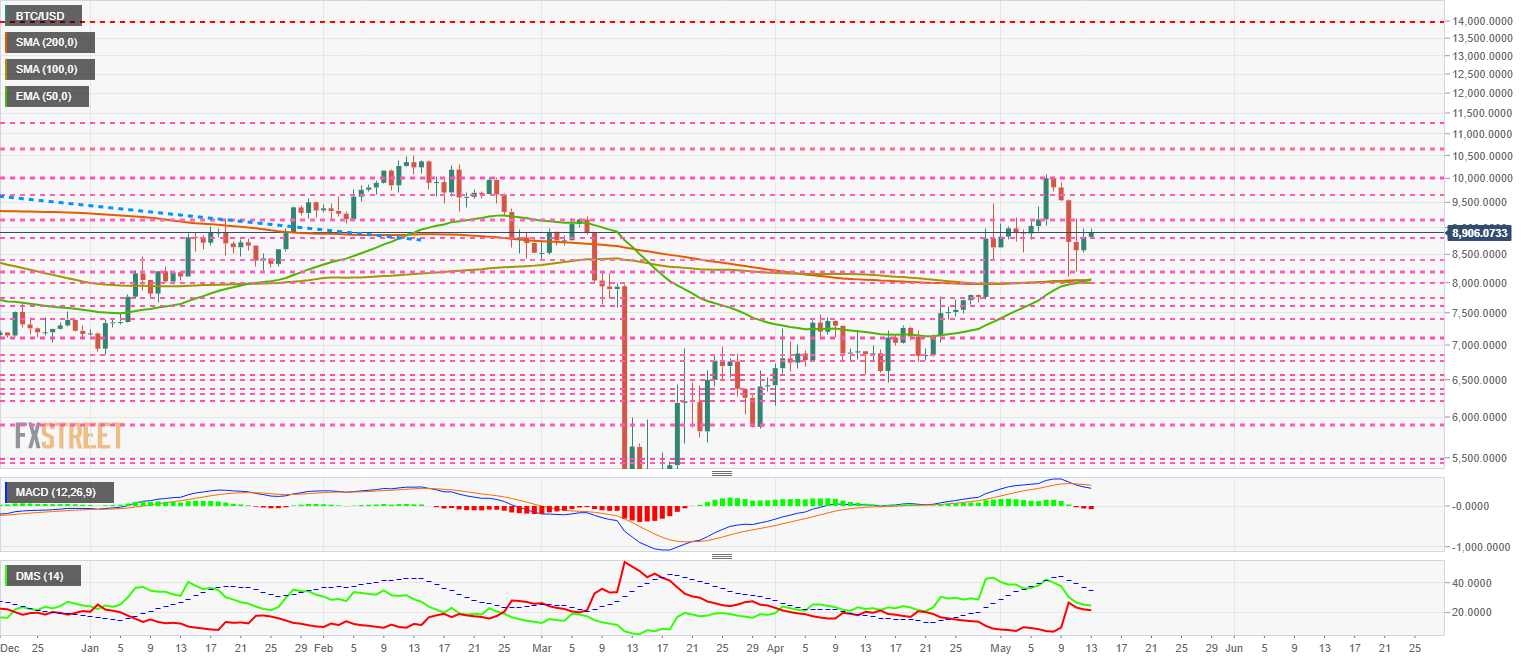
The MACD on the daily chart continues with the bearish setup, although it doesn't increase the slope or the opening between the lines. With the current structure, a short-term upward movement that could undo the bearish cross it's still possible.
The DMI on the daily chart shows both sides of the market following each other tightly. This type of structure can precede a violent movement.
ETH/USD Daily Chart
The ETH/USD pair is currently trading at $190.06. On the upside, the movement is limited y the presence of the 100-day simple moving average at $191.2.
Above the current price, the first resistance level is at $191, then the second at $195 and the third one at $200.
Below the current price, the first support level is at $186, then the second at $180 and the third one at $175.
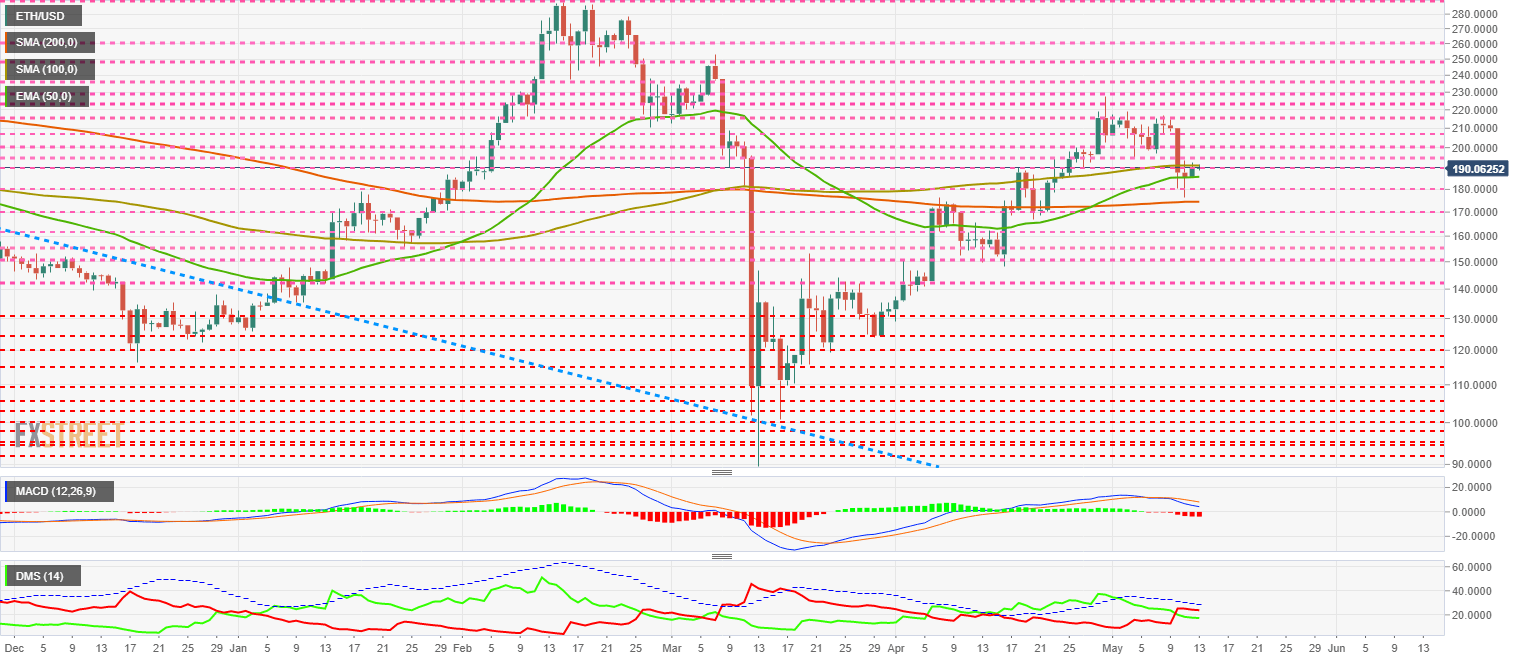
The MACD on the daily chart shows an increase in the bearish momentum.
The DMI on the daily chart shows the bears maintaining control over the bulls, but being unable to break the ADX line, the sell-side does not activate the bearish pattern.
.
XRP/USD Daily Chart
The XRP/USD pair is currently trading at the price level of $0.1980 and appears unable to break through the $0.20 resistance level. The main moving averages continue to point down.
Above the current price, the first resistance level is at $0.20, then the second at $0.218 and the third one at $0.238.
Below the current price, the first support level is at $0.192, then the second at $0.171 and the third one at $0.15.
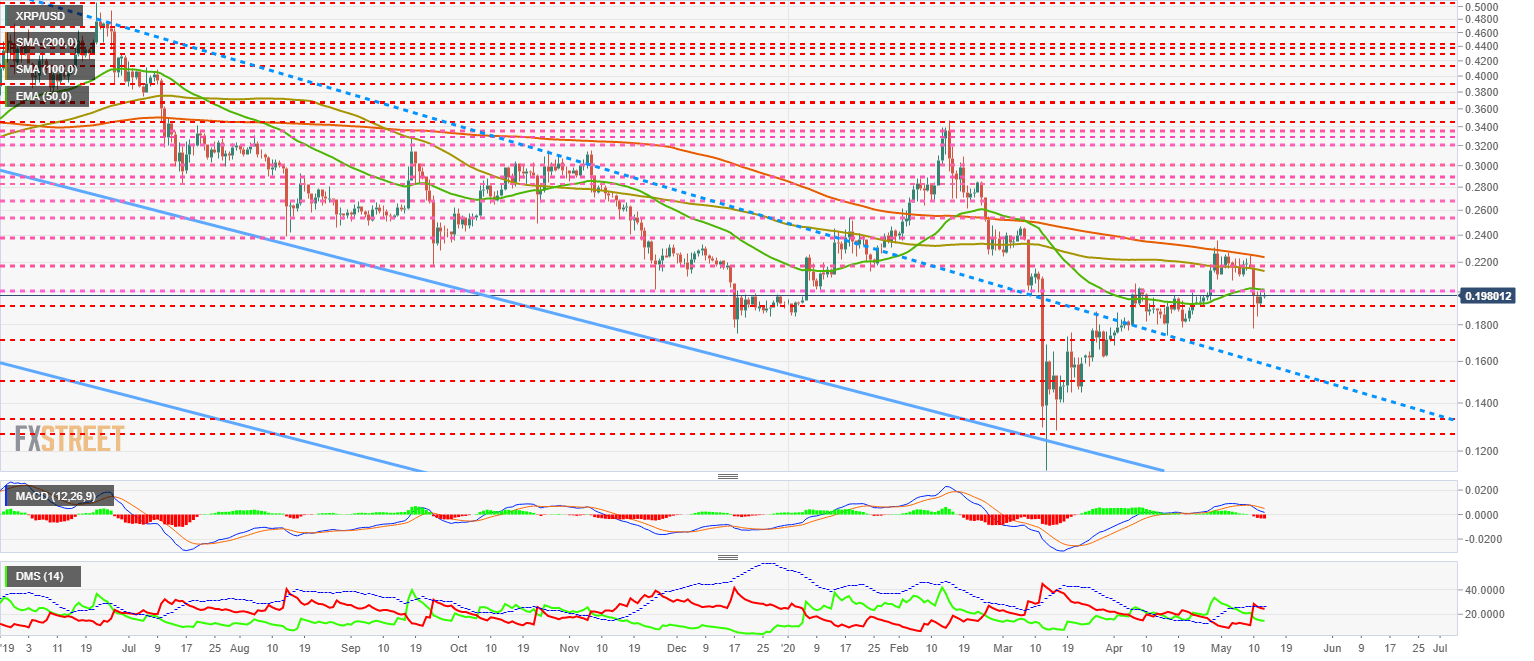
The MACD on the daily chart is approaching the neutral level of the indicator, where it could find support and open a bullish opportunity for XRP.
The DMI on the daily chart shows bears dominating XRP/USD but failing to move above the ADX line. The bulls are still losing strength consistently.
Author

Tomas Salles
FXStreet
Tomàs Sallés was born in Barcelona in 1972, he is a certified technical analyst after having completing specialized courses in Spain and Switzerland. He expanded his technical training following the guidance of great experts on the financial markets.


