- Bulls are in place to boost the Ether in the short term.
- XRP/USD shows an upward divergence in the short term.
- Bitcoin may suffer significant losses in the coming weeks.
The crypto market starts the year with the apparent development of stable support levels.
The $7000 level is active in technical support for the price of Bitcoin, while Ethereum finds fresh money between the price level of $125 and $130.
XRP is trying to reconnect with the market leader and is holding on for the slightest advantage over the $0.19.
In the last days of 2019, we got information about an initiative presented in the US Congress to establish a criterion to classify projects based on blockchain technology according to their objectives.
This initiative was one of the recurrent topics in conversations about the future of the crypto ecosystem. It is essential to be clear about the factors that impact the price of an asset.
If the US Congress defines Bitcoin as a commodity, with the present and future stock known, its price will be formed by the perception as a deposit of value by the market participants.
If the US Congress defines Ethereum as a utility that supports thousands of applications, the definition of the Ethereum intrinsic value would be defined as the capacity of the Ethereum network to continue growing and supporting the industry.
If the US Congress defines the XRP as equity, Ripple Ltd's business development should be key in pricing the XRP token.
The involvement of legislators in the development of a reliable legal framework is excellent news.
The crypto market needs to unify criteria and generate a reliable business space on a global scale.
ETH/BTC Daily Chart
The ETH/BTC cross is currently trading at 0.1815 and is returning to the bullish tone seen on December 29th after two weeks of continuous declines.
The long term downward trend line is lurking at 0.019 and indicates the limit point for the Ethereum to do better than Bitcoin.
The 100 and 200-period simple moving averages are already moving above the downtrend although they retain the downward slope and do not raise hopes for a change in ETH/BTC behavior in the short term.
Above the current price, the first resistance level is at 0.0185, a level reinforced by the proximity of the long term downward trend line at 0.019 and the 50 periods exponential average at 0.0192.
Below the current price, the first support level is at 0.018, then the second support level at 0.017 and the third one at 0.01635 as a pre-catastrophe limit.
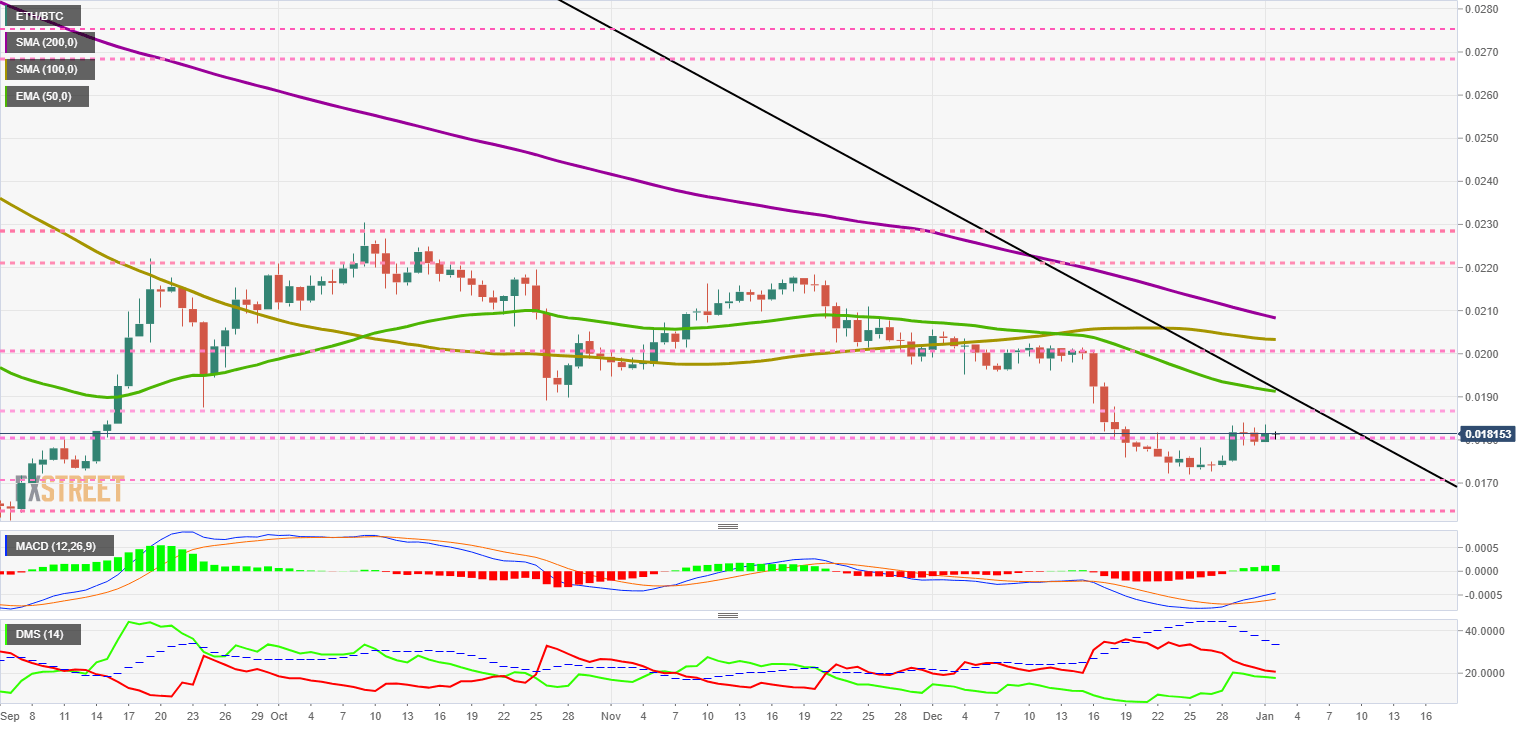
The MACD on the daily chart shows a bullish cross that has a significant upward trend. The opening between the lines suggests a continuation of the upward trend in the short term.
The DMI on the daily chart shows that the bears continue to control the ETH/BTC pair even as the recent bullish trend continues. The bulls have greatly improved in strength and are approaching the sellers' level.
BTC/USD Daily Chart
The BTC/USD pair is currently trading at the price level of $7112 and supports the psychological level for the time being before a predictable incursion into the upper 6000-dollar zone.
Bitcoin fundamentals in 2019 are positive, with the installed hash rate increasing over 169% in the year to 100 exa-hashes per second from 2018.
Above the current price, the first resistance level is at $7400, then the second at $7500 and the third one at $7600.
Below the current price, the first support level is at $7100, then the second at $6850 and the third one at $6750.
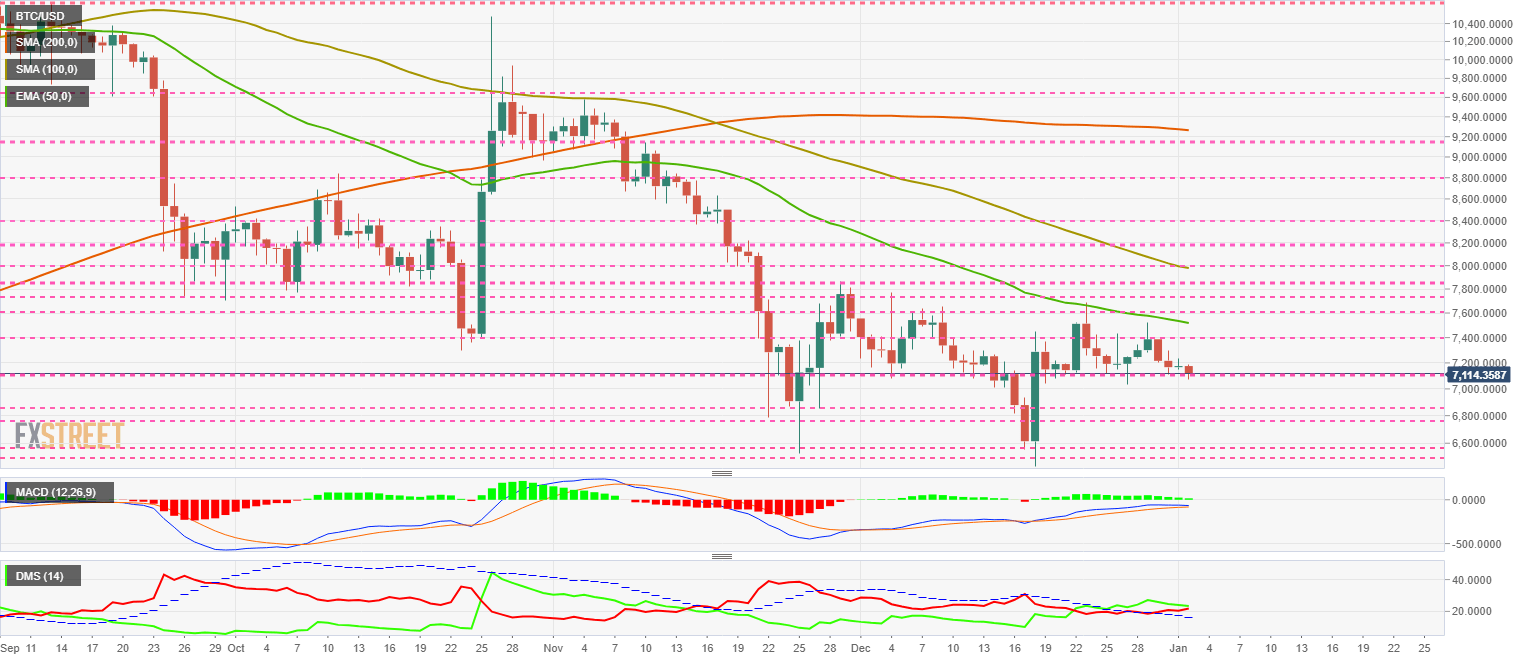 The MACD on the daily chart shows how the moving averages have lost their previous bullish momentum by approaching the 0 levels of the indicator. This type of structure can develop by going up, but the most likely scenario is a short-term downward movement.
The DMI on the daily chart shows the bears have moved above the ADX line and have a significant upward slope. The bulls continue to control the market but with a small advantage. The fact that both sides of the market are moving above the ADX line increases the potential for rising volatility in the BTC/USD.
ETH/USD Daily Chart
ETH/USD is currently trading at the price level of $129.28 and is unable to conquer the price congestion resistance at $130.
The technical structure of the Ethereum is favorable in the face of short-term doubts about Bitcoin.
Above the current price, the first resistance level is at $130, then the second at $142 and the third one at $144.
Below the current price, the first support level is at $125, then the second at $120 and the third one at $115.
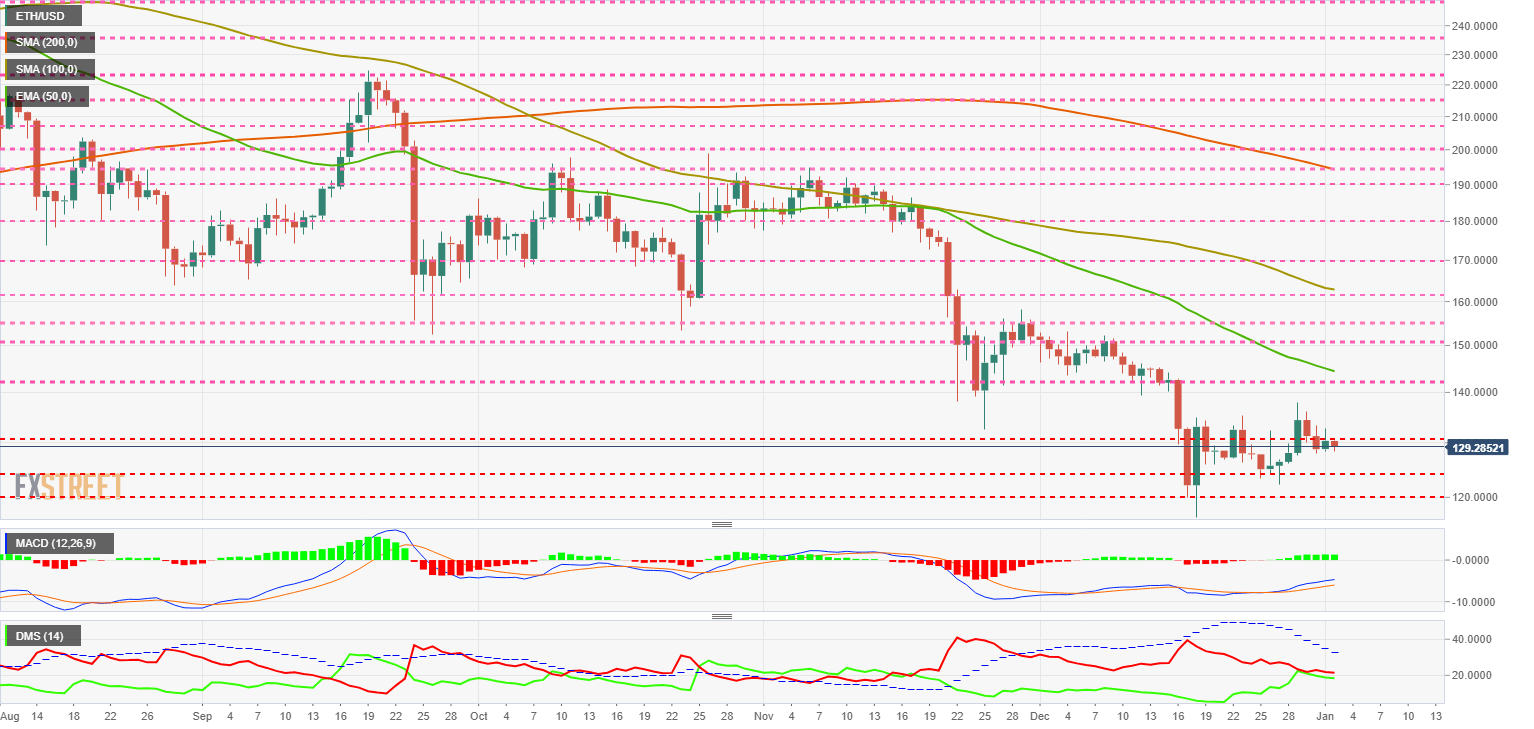 The MACD on the daily chart shows an active bullish profile, with a line separation that suggests continued upward movement in the short term. This indicator clearly shows the difference between the scenario for the BTC/USD and the ETH/USD. The Ethereum can take advantage in the short term.
The DMI on the daily chart shows bears with a small advantage over bulls. Buyers have been improving their strength since before Christmas and should now consummate the conquest of a lead they have not had since mid-November.
XRP/USD Daily Chart
XRP/USD is currently trading at the price level of $0.191 after two weeks of testing price congestion support at $0.19.
Above the current price, the first resistance level is at $0.197, then the second at $0.217 and the third one at $0.23.
Below the current price, the first support level is at $0.19, then the second at $0.17 and the third one at $0.15.
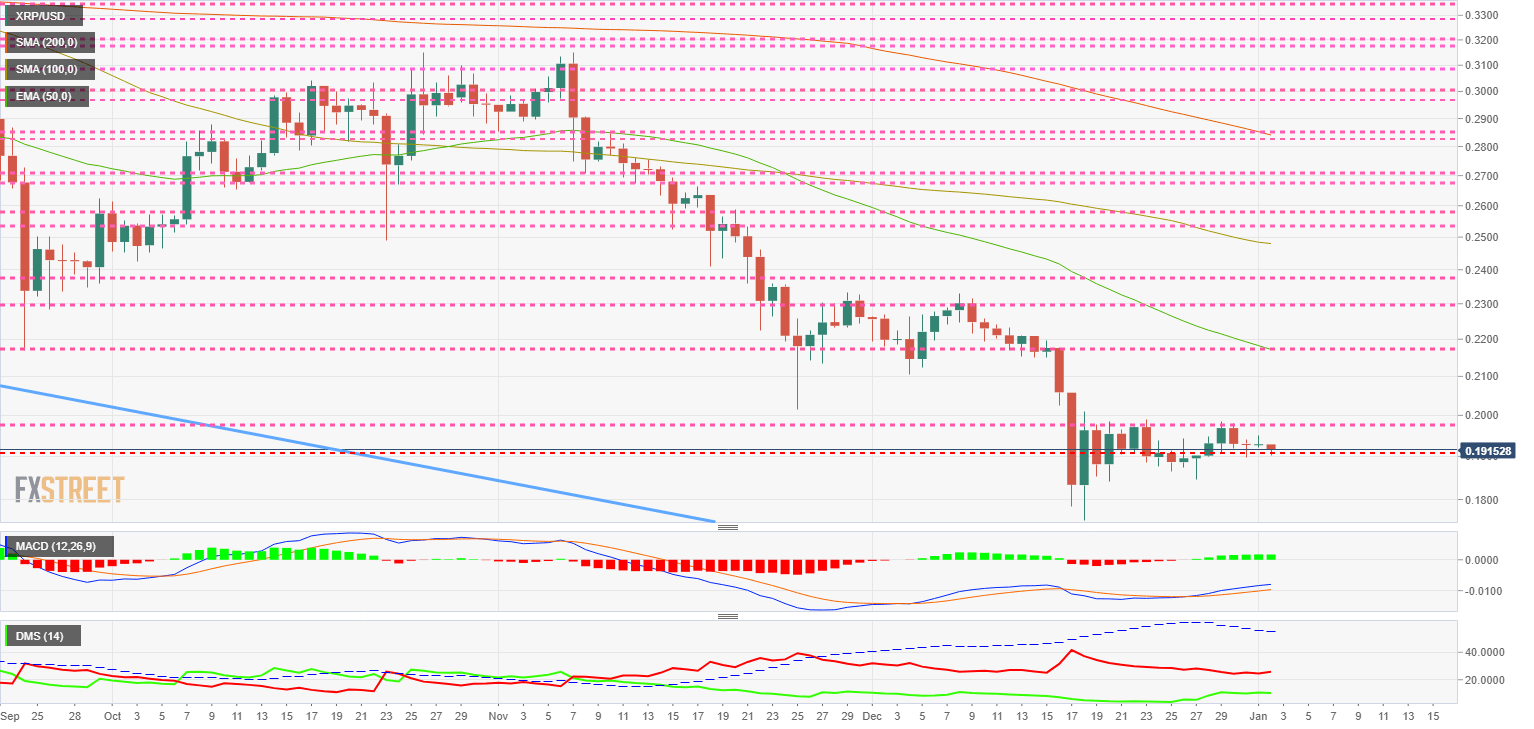
The MACD on the daily chart shows a divergent structure to the price development. Divergences do not guarantee a change in trend, but if this change in price direction occurs, the movement after a divergence is usually more forceful.
The DMI on the daily chart shows the bulls improving their strength since Christmas Day, while the bears remain healthy and do not falter in the control of the XRP/USD pair. It is this strange behavior, where both buyers and sellers are moving in the same direction that should put us on our guard as one of the two is wrong, and this will increase volatility in the short term.
Get 24/7 Crypto updates in our social media channels: Give us a follow at @FXSCrypto and our FXStreet Crypto Trading Telegram channel
Information on these pages contains forward-looking statements that involve risks and uncertainties. Markets and instruments profiled on this page are for informational purposes only and should not in any way come across as a recommendation to buy or sell in these assets. You should do your own thorough research before making any investment decisions. FXStreet does not in any way guarantee that this information is free from mistakes, errors, or material misstatements. It also does not guarantee that this information is of a timely nature. Investing in Open Markets involves a great deal of risk, including the loss of all or a portion of your investment, as well as emotional distress. All risks, losses and costs associated with investing, including total loss of principal, are your responsibility. The views and opinions expressed in this article are those of the authors and do not necessarily reflect the official policy or position of FXStreet nor its advertisers. The author will not be held responsible for information that is found at the end of links posted on this page.
If not otherwise explicitly mentioned in the body of the article, at the time of writing, the author has no position in any stock mentioned in this article and no business relationship with any company mentioned. The author has not received compensation for writing this article, other than from FXStreet.
FXStreet and the author do not provide personalized recommendations. The author makes no representations as to the accuracy, completeness, or suitability of this information. FXStreet and the author will not be liable for any errors, omissions or any losses, injuries or damages arising from this information and its display or use. Errors and omissions excepted.
The author and FXStreet are not registered investment advisors and nothing in this article is intended to be investment advice.
Recommended Content
Editors’ Picks
Crypto traders brace for short-term volatility with $2.4 billion options expiry on Friday

Bitcoin and Ethereum options market looks bullish on Friday, according to data from intelligence tracker Greeks.live. The firm said it has identified two Bitcoin calls that show an underlying bullish sentiment among market participants.
XRP recovers from week-long decline following Ripple’s response to SEC motion

Ripple filed a letter to the court to support its April 22 motion to strike new expert materials. The legal clash concerns whether SEC accountant Andrea Fox's testimony should be treated as a summary or expert witness.
Lido adds 4% gains as protocol rolls out first step towards decentralization
Lido takes the first batch of simple DVT validators to live, a step taken to decentralize the protocol. Lido leveraged technology to expand the protocol to multiple node operators, inviting both solo and community stakers.
Bitcoin Weekly Forecast: Should you buy BTC here? Premium

Bitcoin (BTC) price shows signs of a potential reversal but lacks confirmation, which has divided the investor community into two – those who are buying the dips and those who are expecting a further correction.
Bitcoin: Should you buy BTC here? Premium
Bitcoin (BTC) price shows signs of a potential reversal but lacks confirmation, which has divided the investor community into two – those who are buying the dips and those who are expecting a further correction.