Top 3 Price Prediction Bitcoin, Ethereum, Ripple: Bitcoin is the King and wants to keep the throne
- War for dominance sets the tone for the crypto board.
- Bitcoin's strength calls Altcoins' season in doubt.
- Ripple is looking for traction looking towards the $0.21 price level.

Today the market is turning red because of the threat posed to the Altcoin segment by the possibility of Bitcoin taking the path to victory in the war for dominance.
Bitcoin has been losing market share since the beginning of May. Now, it shows intentions of stopping the bleeding and, even going on the attack in this dispute for market share.
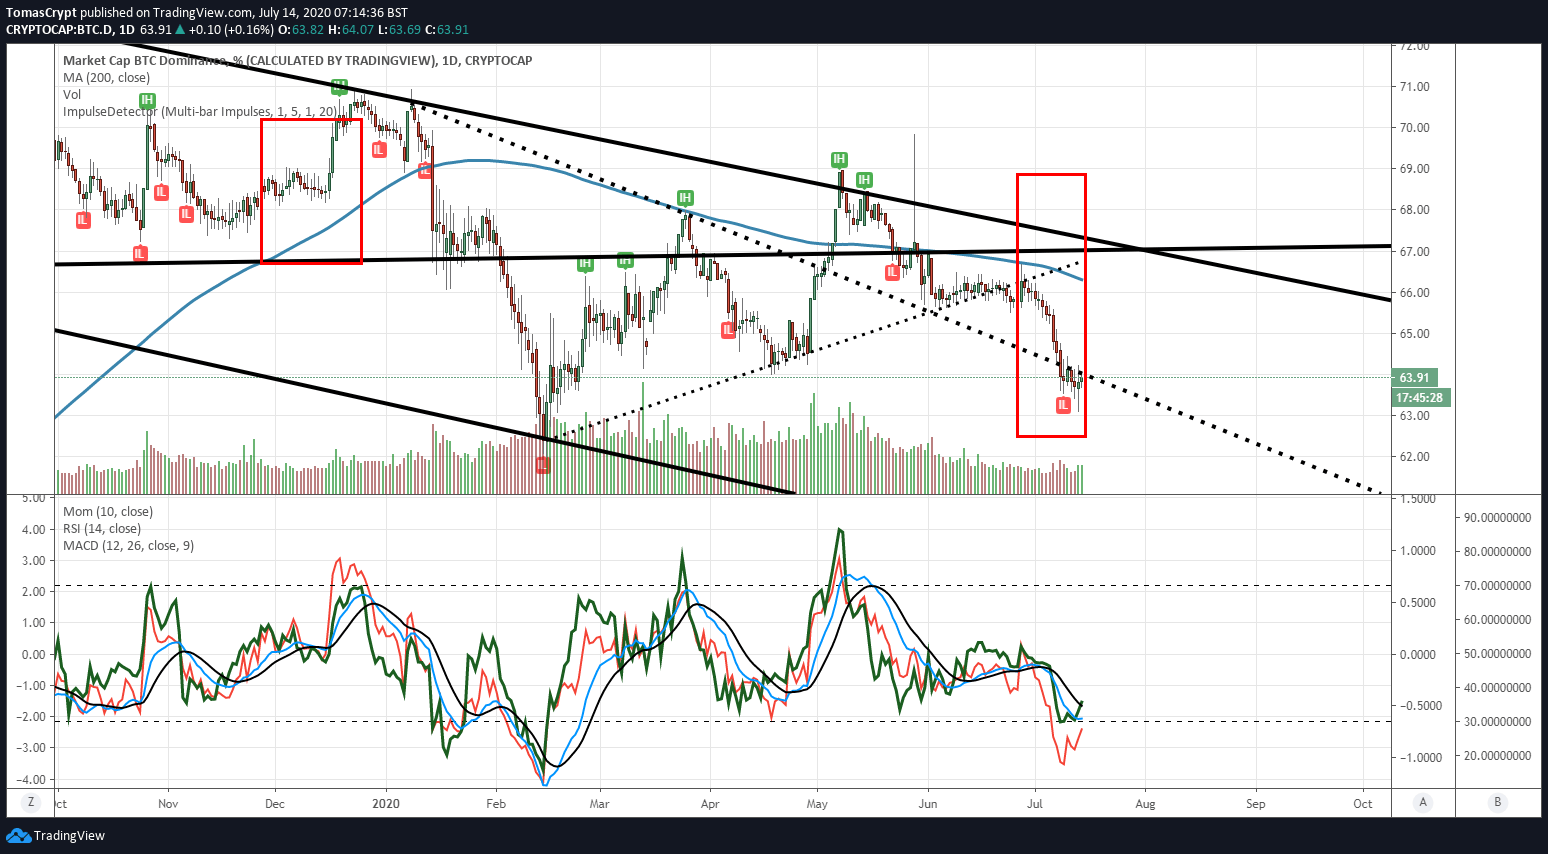
Yesterday's session left a minimum of 63% dominance for Bitcoin, but in the final hours of the session, it turned sharply upwards to close near the 64% level.
The technical indicators reinforce the possibility of a bullish attempt, which would cause a rebalancing of market positions that would punish the entire Altcoin segment.
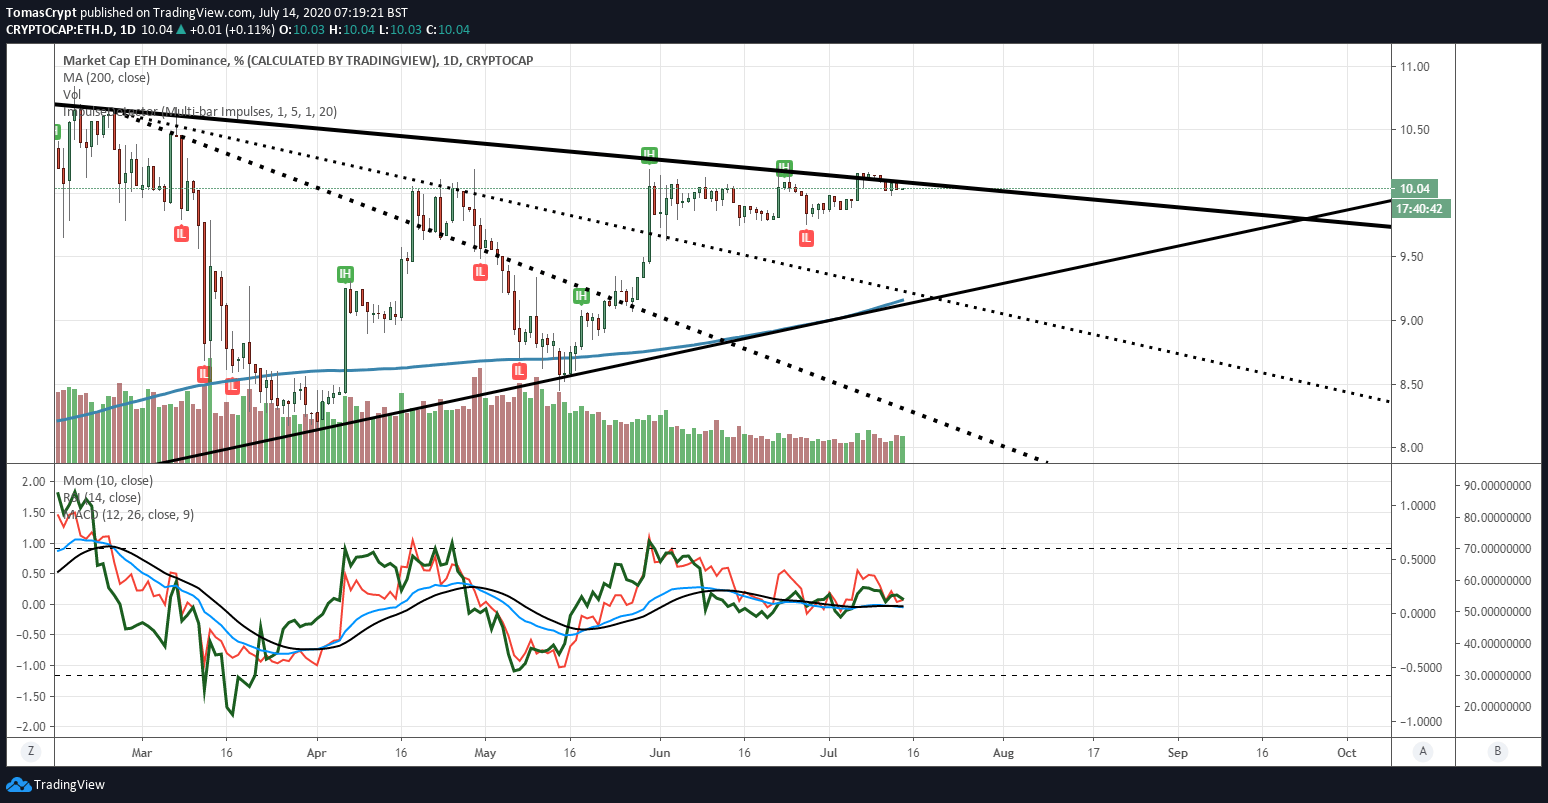
Ethereum also plays its role in the battle, and as a consequence of Bitcoin's bullish intentions, it gives up the support it conquered last week and goes back into the previous bearish scenario. It's vital for the immediate future of Ethereum that the dominance level returns above the 10.10% level.
These are the two conditions necessary for the Altcoin season not to slow down: Bitcoin dominance below 63.5% and Ethereum dominance above 10.10%.
ETH/BTC Daily Chart
The ETH/BTC pair is currently trading at the price level of 0.02595 and remains above the price congestion support of 0.0256. The 200-day moving average increases the bullish profile but is still far from the spot price.
Above the current price, the first resistance level is at 0.0277, then the second at 0.0298 and the third one at 0.0308.
Below the current price, the first support level is at 0.0257, then the second at 0.0248 and the third one at 0.0245.
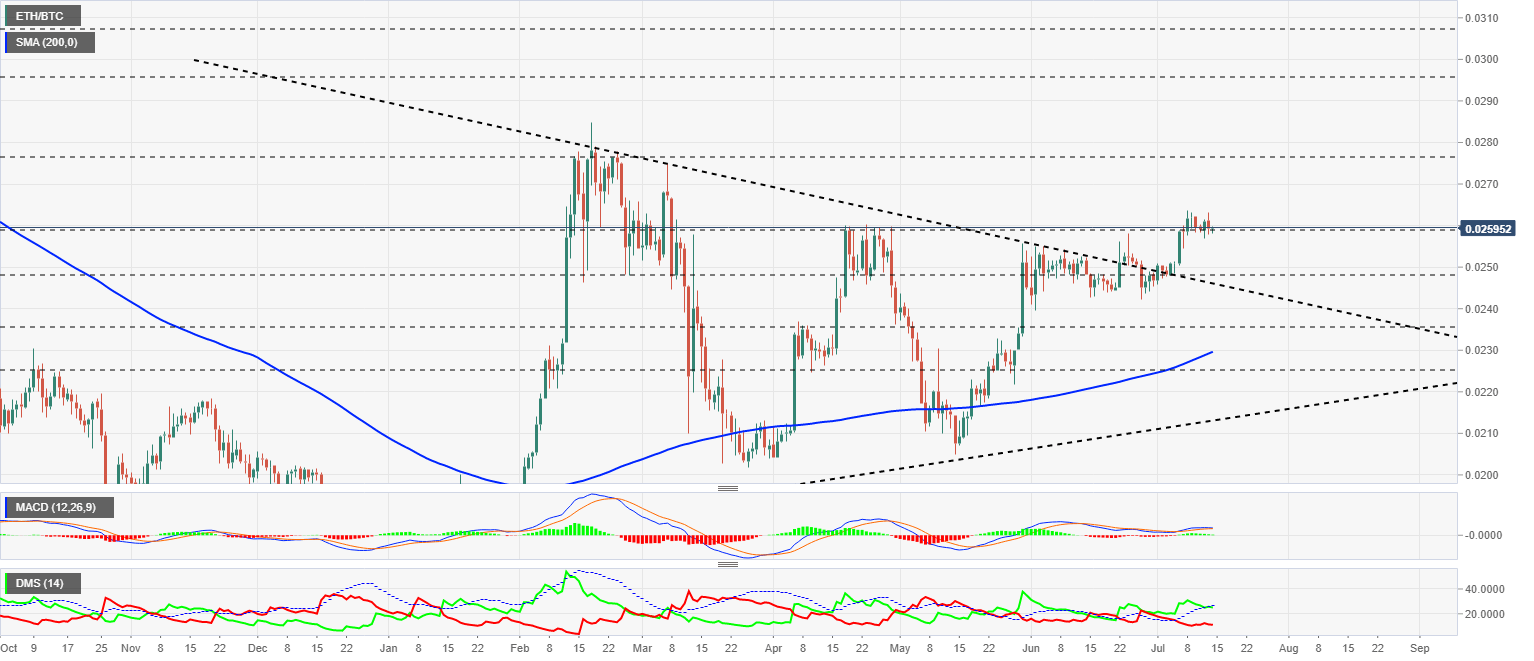
The MACD on the daily chart loses its slightly bullish profile and is set entirely flat. Movements in any direction are possible.
The DMI on the daily chart shows the bulls piercing the ADX line, something that if confirmed at today's close would cancel out the bullish pattern, and we should expect declines in the ETH/BTC price.
.
BTC/USD Daily Chart
The BTC/USD pair is currently trading at the price level of $9185 and remains in the price range of recent weeks. The direction of the next Bitcoin move is entirely dependent on the resolution of the situation on the dominance chart.
Above the current price, the first resistance level is at $9500, then the second at $10450 and the third one at $11400.
Below the current price, the first support level is at $8910, then the second at $8875 and the third one at $8575.
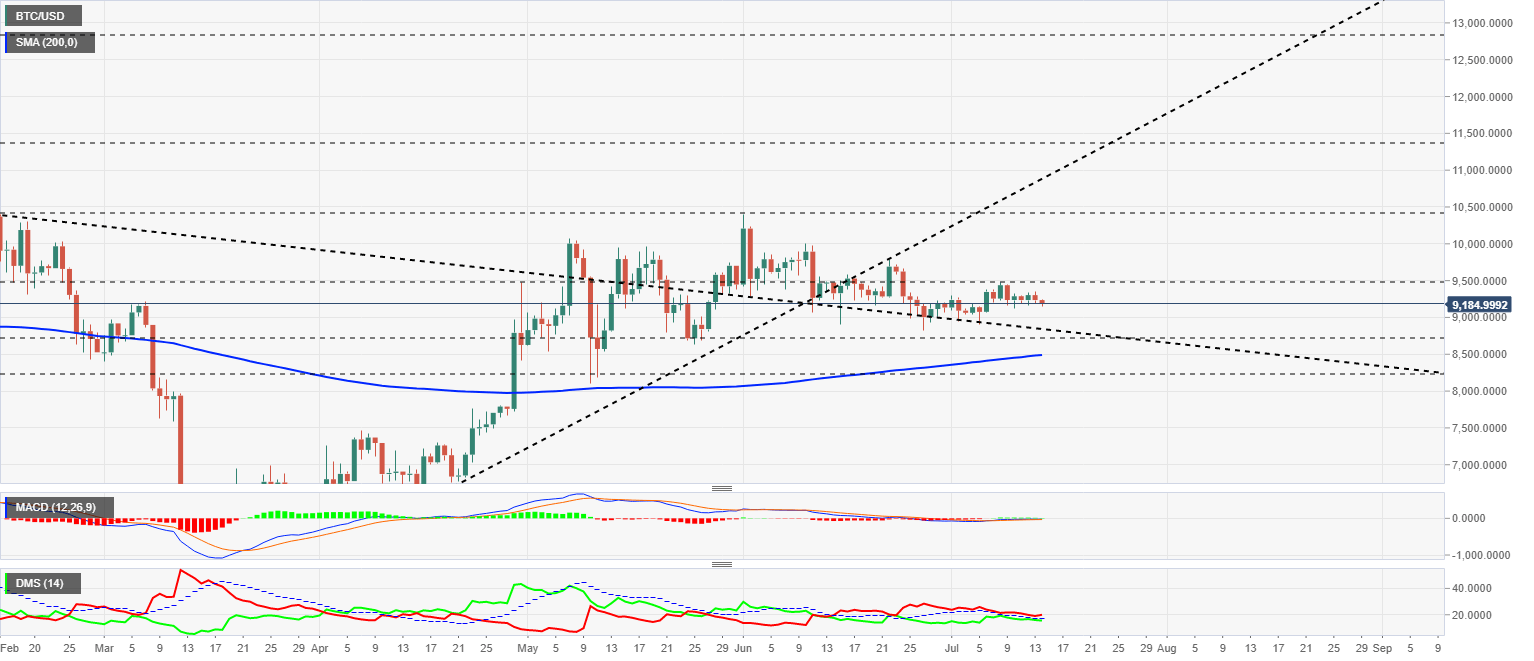
The MACD on the daily chart accurately reflects the situation. The moving averages have a completely flat profile and are just above the level that separates the upside from the downside.
The DMI on the daily chart shows bears with a small advantage over bulls.
Despite the small gap in favor of the sell-side in the BTC/USD pair, at this point, the bears are hinting at an upward movement. The bulls are hinting at a downward shift.
ETH/USD Daily Chart
The ETH/USD pair is currently trading at the price level of $238.60 and replicates the transition moment we already see in the Bitcoin chart. Ethereum moves in the same range as in the past few weeks, very close to, and yet far from, the bullish scenario above the $260 price level.
Above the current price, the first resistance level is at $245, then the second at $260 and the third one at $270.
Below the current price, the first support level is at $235, then the second at $220 and the third one at $200.
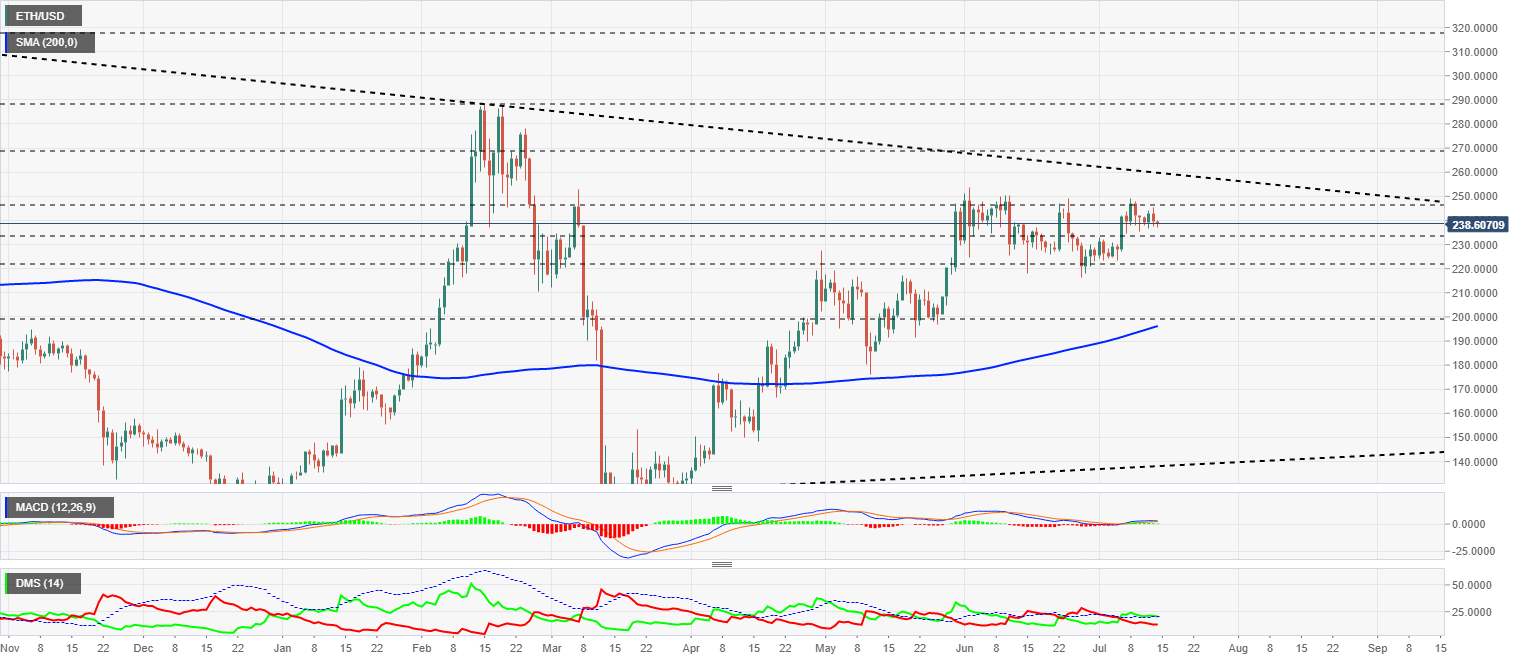
The MACD on the daily chart shows a slightly bullish profile, although it seems to be losing strength and could change course. Volatility in ETH/USD is very low, which increases the risk of a violent movement when the market decides on a direction for the pair.
The DMI on the daily chart shows bulls leading the ETH/USD, but with little advantage over the sell-side. The D+ is supported by the ADX line, from where it should bounce upward to avoid cancellation of the bullish momentum.
XRP/USD Daily Chart
The XRP/USD pair is currently trading at the price level of $0.1974 and is back in the previous bearish scenario. If the price takes as its pivot point the uptrend line from the March lows, it could find traction and continue to rise in price, albeit in a languid and cumbersome manner.
Above the current price, the first resistance level is at $0.198, then the second at $0.202 and the third one at $0.21.
Below the current price, the first support level is at $0.1850, then the second at $0.1630 and the third one at $0.14.
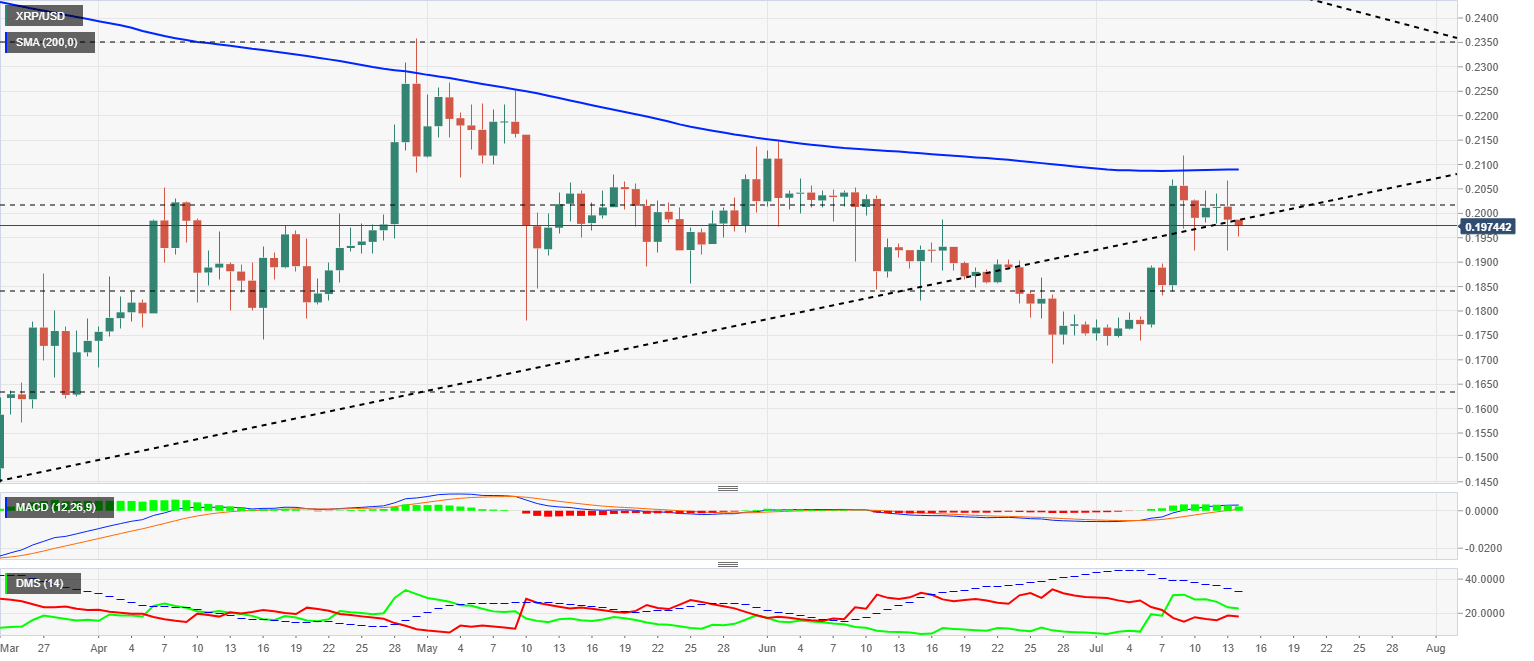
The MACD on the daily chart is entering the bullish zone of the indicator, with a slight upward slope but an interesting averages separation. The distance between the lines favors wide intraday price ranges.
The DMI on the daily chart shows bulls losing strength and approaching bearish levels. Both sides of the market are moving below the ADX line, so there could be a rapid change in leadership.
Author

Tomas Salles
FXStreet
Tomàs Sallés was born in Barcelona in 1972, he is a certified technical analyst after having completing specialized courses in Spain and Switzerland. He expanded his technical training following the guidance of great experts on the financial markets.


