Top 3 Price Prediction Bitcoin, Ethereum, Ripple: 2017 flashback on ETH/BTC
- Technical analysis reveals similar patterns to the ones seen in months leading up to the 2017 boom.
- Bitcoin can struggle against Ethereum before imposing its kingdom domination.
- XRP/USD could move in the current price range for a few more days.

The market is experiencing a day of generalised gains, with Ethereum as the star player with a rise in the ETH/USD pair occasionally higher than 10%.
The strength manifested by Ethereum against all significant pairs raises doubts as to whether the time has come to rotate portfolios back into the Altcoin segment.
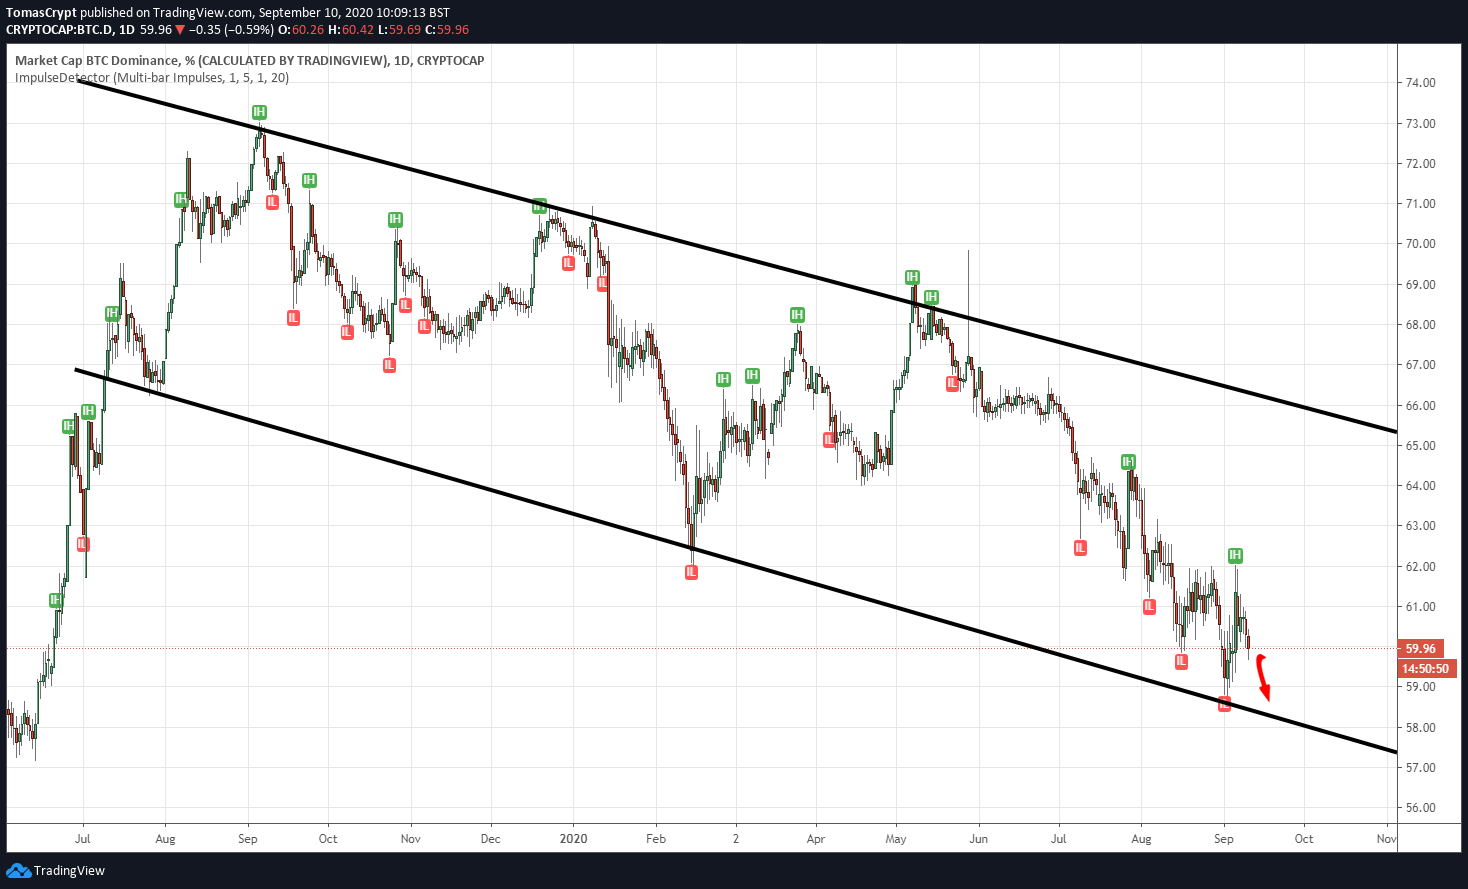
The Bitcoin dominance chart leaves a tiny space for bearish development which projects a scenario where Ether could take market leadership for a few more days.
Looking for more data on the interrelationship of Bitcoin with Ethereum, the weekly ETH/BTC chart shows an extreme position in the trend-setting indicator DMI Minus (Directional Movement Index -).
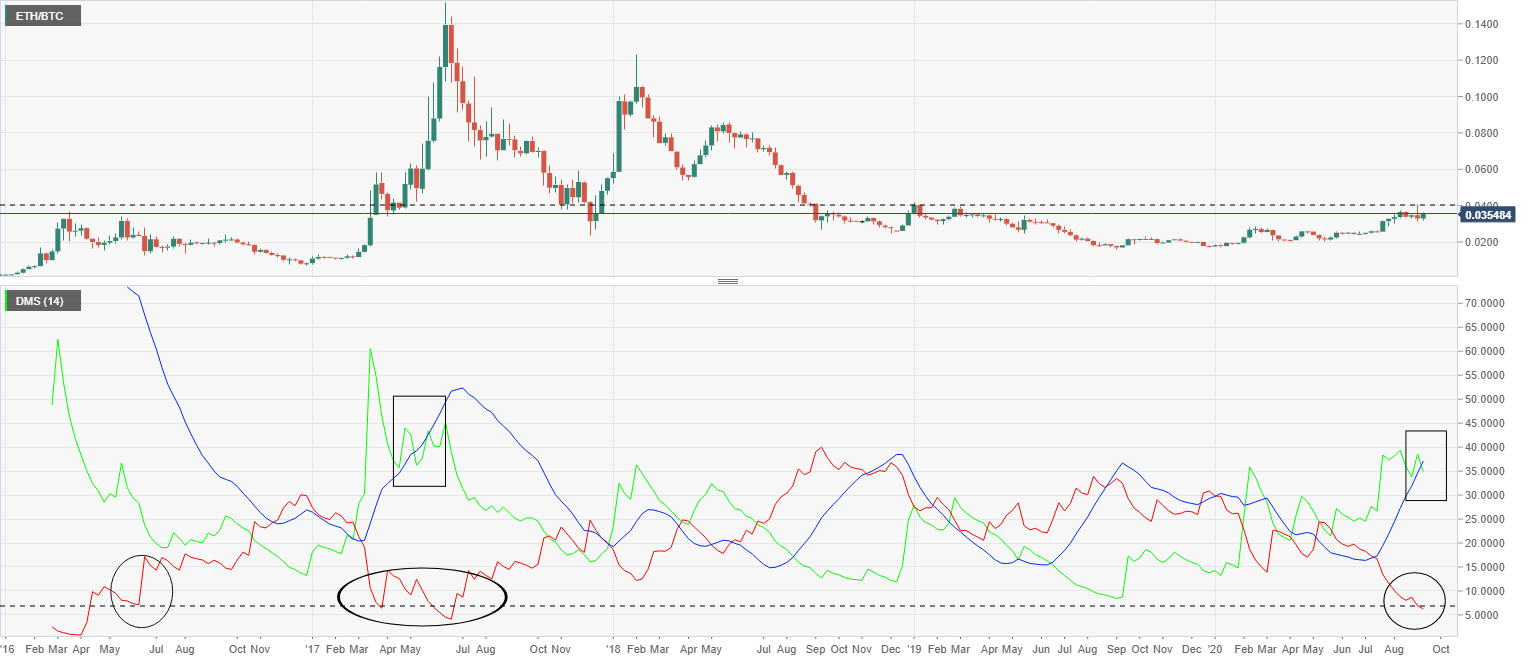
Looking at the chart, we see that the buying side is at rare and significant lows. The last time the bulls showed such a low level of activity was in mid-2017. On that occasion, the market was down for five weeks and then began to climb to record highs at the end of December 2017.
The DMI in the weekly range also shows another significant technical event. The bulls (green line), which in this case represent the relative strength of Ethereum to Bitcoin, pierce the ADX (rectangle) downwards and could indicate the activation of a bullish terminal pattern similar to what happened in the summer of 2017.
ETH/BTC Daily Chart
The ETH/BTC pair is currently trading at the price level of 0.0352 and is back at the top of the price range in recent weeks.
Above the current price, the first resistance level is at 0.0365, then the second at 0.0372 and the third one at 0.040.
Below the current price, the first support level is at 0.0348, then the second at 0.0327 and the third one at 0.0315.
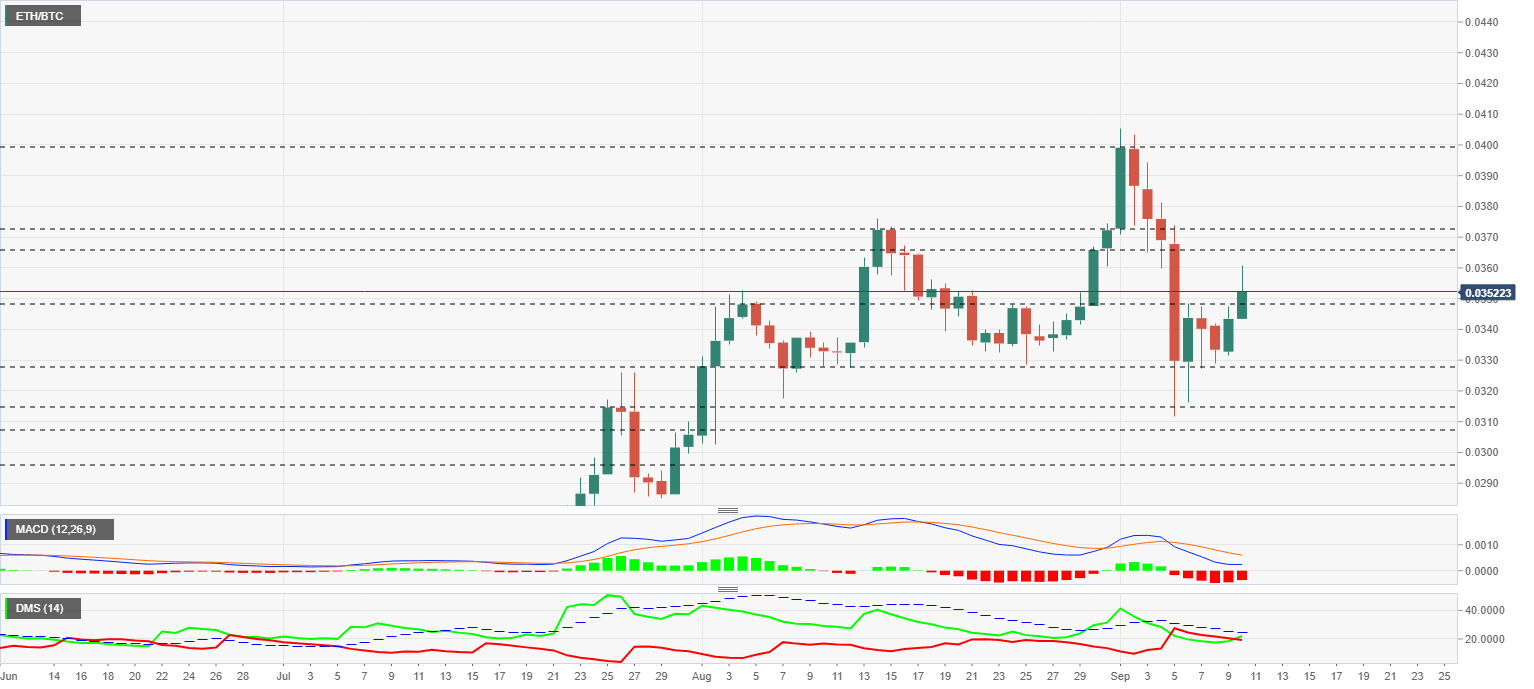
The MACD on the daily chart loses its bearish profile and acquires a flat shape that conveys indecision despite the rise we see today.
The DMI on the daily chart shows the bulls moving above bears, although both are driving below the ADX line. Should the bulls manage to break the ADX line upwards, it would confirm the scenario outlined in the introduction to this article, and we could see a terminal bullish stretch in favour of Ethereum.
BTC/USD Daily Chart
The BTC/USD pair is currently trading at $10268 and lags behind Ethereum.
Above the current price, the first resistance level is at $10450, then the second at $11370 and the third one at $12300.
Below the current price, the first support level is at $9500, then the second at $8725 and the third one at $8250.
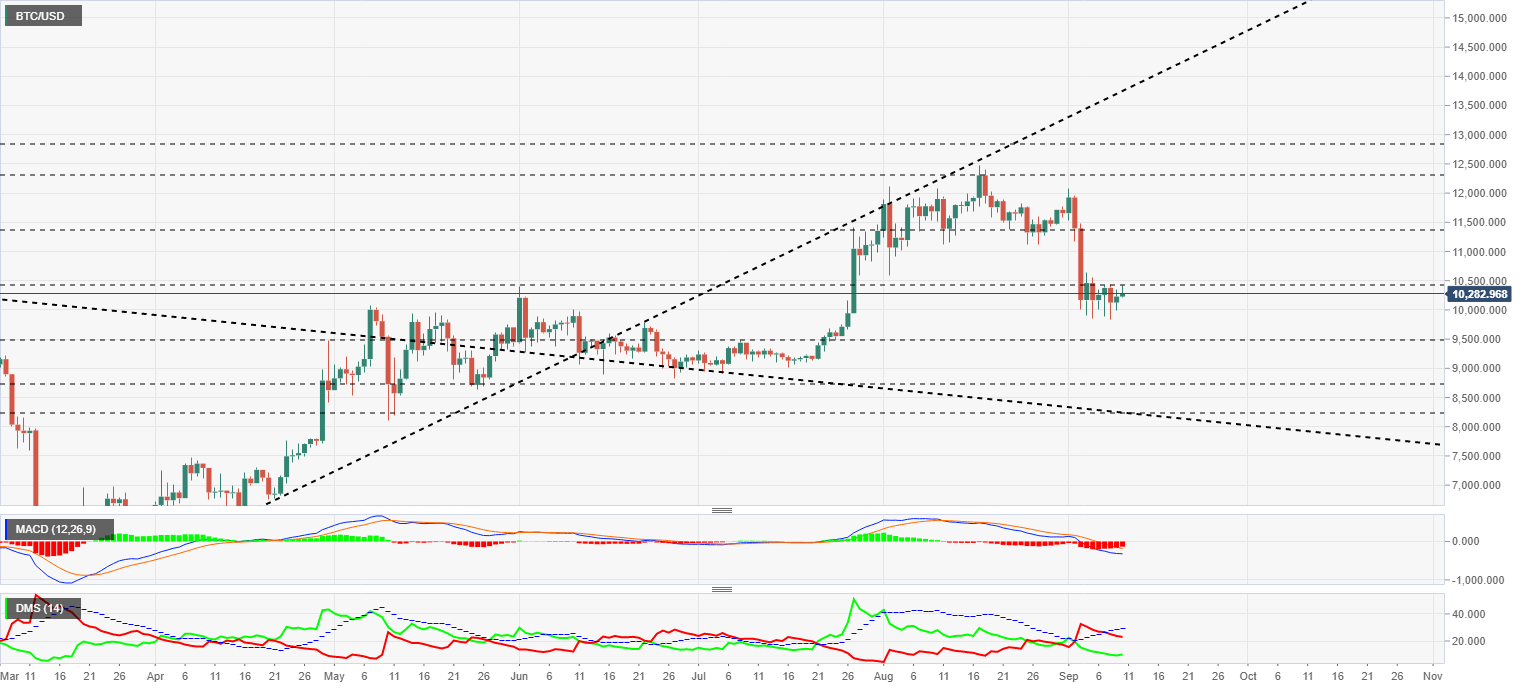
The MACD on the daily chart is losing its downward slope and flattening out the curve in search of a possible upward move.
The DMI on the daily chart shows the bulls turning upward while the bears continue their downward trajectory.
ETH/USD Daily Chart
The ETH/USD pair is currently trading at $371.3 and is returning to the lower end of the upper range.
Above the current price, the first resistance level is at $385, then the second at $405 and the third one at $440.
Below the current price, the first support level is at $360, then the second at $387 and the third one at $408.5.
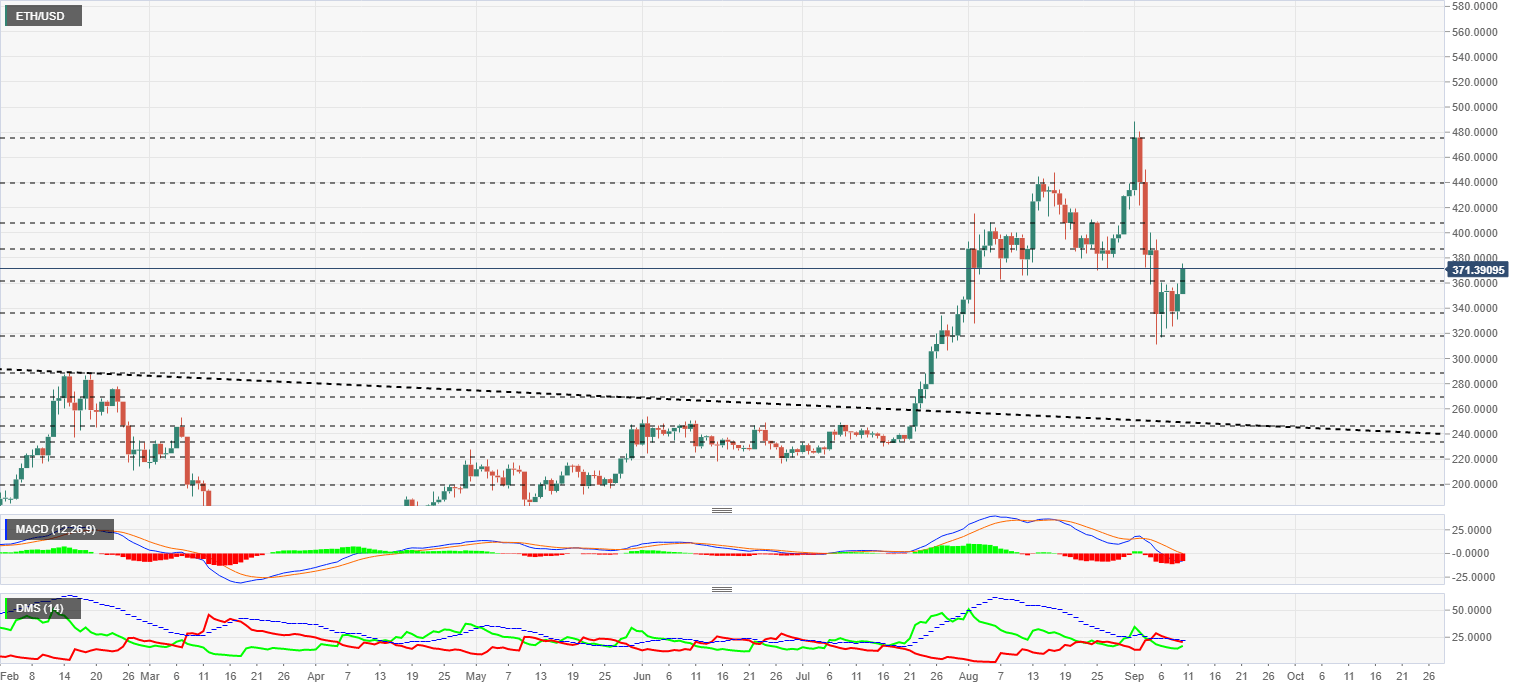
The MACD on the daily chart is losing its downward slope but continues to show a pessimistic profile for the aspirations of the buying side. Despite today's upward movement, the short-term projection remains bearish.
The DMI on the daily chart shows bulls moving upward and very close to the bearish level. The sell-side is above the ADX line, and if the bears are able to cross it, they will deactivate the main bullish pattern.
XRP/USD Daily Chart
The XRP/USD pair is currently trading at the price level of $0.2435 and is rebounding upwards after finding support in the price congestion level at $0.2365.
Above the current price, the first resistance level is at $0.264, then the second at $0.22 and the third one at $0.304.
Below the current price, the first level of support is at $0.236, then the second at $0.227 and the third one at $0.215.
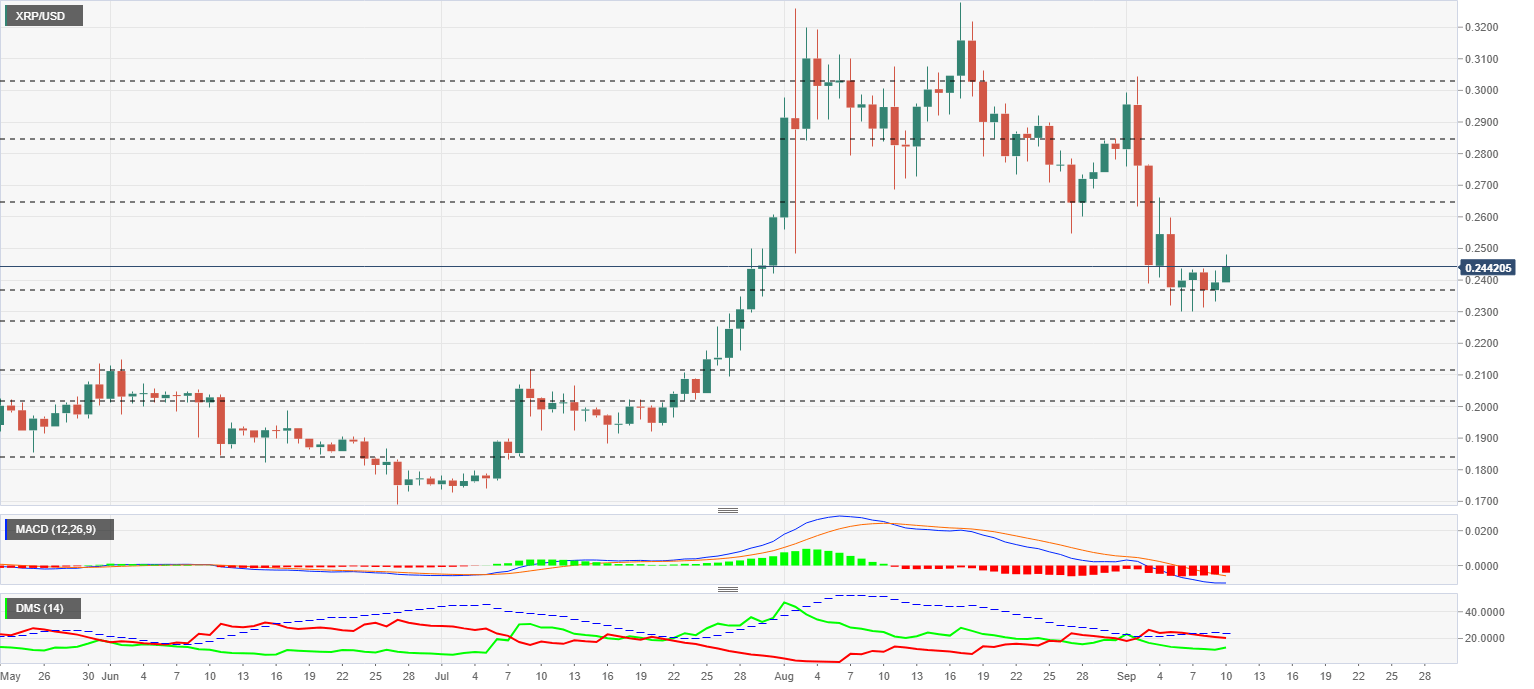
The MACD on the daily chart is losing its downward slope although the line separation is still vast. The current profile suggests a lateral upward trend for the next few sessions.
The DMI on the daily chart shows an improvement on the buy side, which is turning upward and approaching the sellers' level. Both sides of the market are moving below the ADX line, confirming a lack of clear direction in the XRP/USD pair.
Author

Tomas Salles
FXStreet
Tomàs Sallés was born in Barcelona in 1972, he is a certified technical analyst after having completing specialized courses in Spain and Switzerland. He expanded his technical training following the guidance of great experts on the financial markets.


