Top 3 Price Prediction Bitcoin, Ethereum, Ripple: $10 billion of rapid-fire ammunition
- USD Tether capitalization validates the bridge project between two worlds.
- Positions in stable currencies allow us to act quickly in the crypto market without exposure in times of uncertainty.
- Low volatility heralds price shocks, but no date or direction.

The figure of the day is $10 billion in capitalization for the US Dollar Tether (USDT). The third place in the crypto market capitalization ranking has been consolidated by the first of the stablecoins, after it surpassed Ripple at the beginning of the year.
Deposit growth in USD Tether for the year exceeds 140%. Other stablecoin projects, such as Circle's USDC or Binance's BUSD, have seen similar growth.
The business model for cryptocurrency projects linked to fiat currencies is to offer an option that allows investors to be in the crypto market but anchored to the value of fiat currencies.
The USDT has benefited from a crypto market that generates doubts as to which direction to take.
Many investors prefer to move their capital to the stablecoins, seeking to insulate their investment from possible crypto market turbulence but without going outside the ecosystem. Taking these positions allows them to react very quickly when buying opportunities arise, as the money is already in the crypto circuit.
The crypto market continues in pause mode, a pause in the price that conversely accelerates the levels of uncertainty and anxiety in the traders.
It is foreseeable that the way out of this tense situation will be violent, but the direction to follow is unknown.
The market sentiment indicator offered by the site alternative.me follows another day in a "fear" zone from which it has only been able to escape on four occasions in the last year.
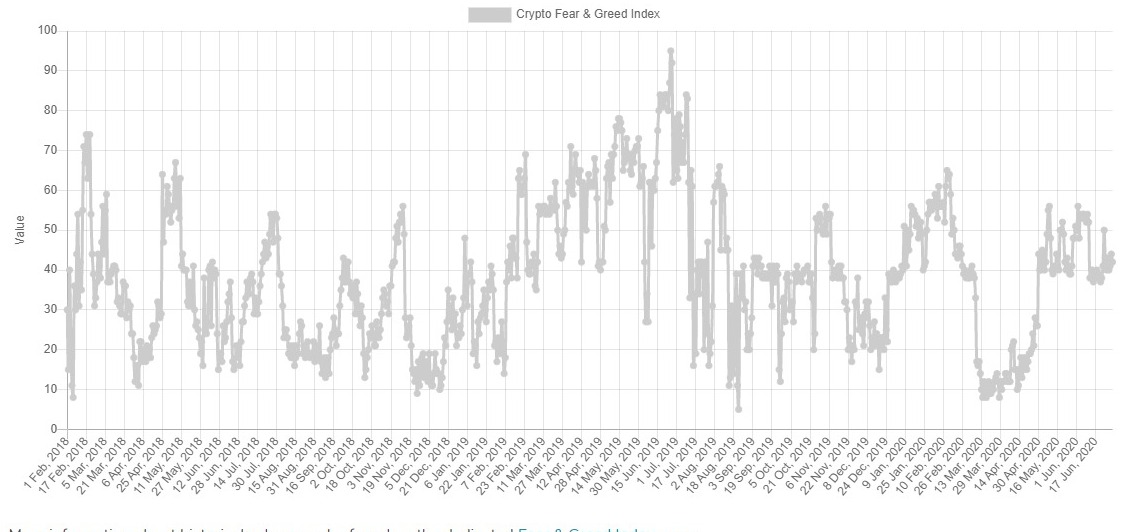
Source: alternative.me
The long crypto winter, between January 2018 and March 2020, has given way to a cold spring that has not convinced a significant part of the traders.
ETH/BTC Daily Chart
The ETH/BTC pair is currently trading at 0.0249 and continues to move along the downward trend line that it briefly broke last week. A valid break of that line would give a bullish signal to the market.
Above the current price, the first resistance level is at 0.0245, then the second at 0.025 and the third one at 0.026.
Below the current price, the first support level is at 0.0235, then the second at 0.0225 and the third one at 0.0211.
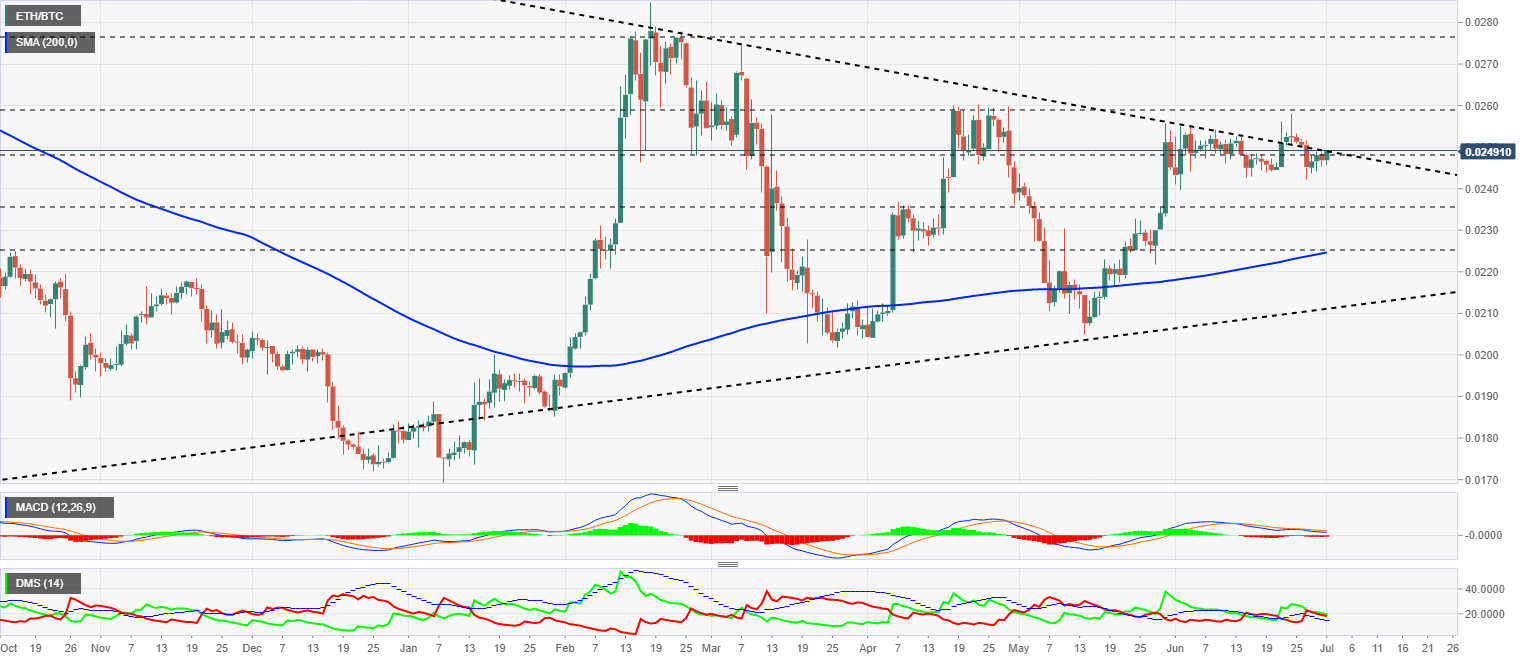
The MACD on the daily chart reflects the lack of movement in the price, with a very flat profile looking for support from the neutral level of the indicator.
The DMI on the daily chart shows the bulls and bears moving in unison, the two groups ready to make the final push that will give them control over the coming months.
BTC/USD Daily Chart
The BTC/USD pair is currently trading at the price level of $9188 and is moving away from the technical support of the current expansive triangle zone. If the price of BTC/USD loses this level and moves to the lower scenario, the market could see very significant sales.
Above the current price, the first resistance level is at $9500, then the second at $10440 and the third one at $11375.
Below the current price, the first support level is at $8950, then the second at $8750 and the third one at $8350.
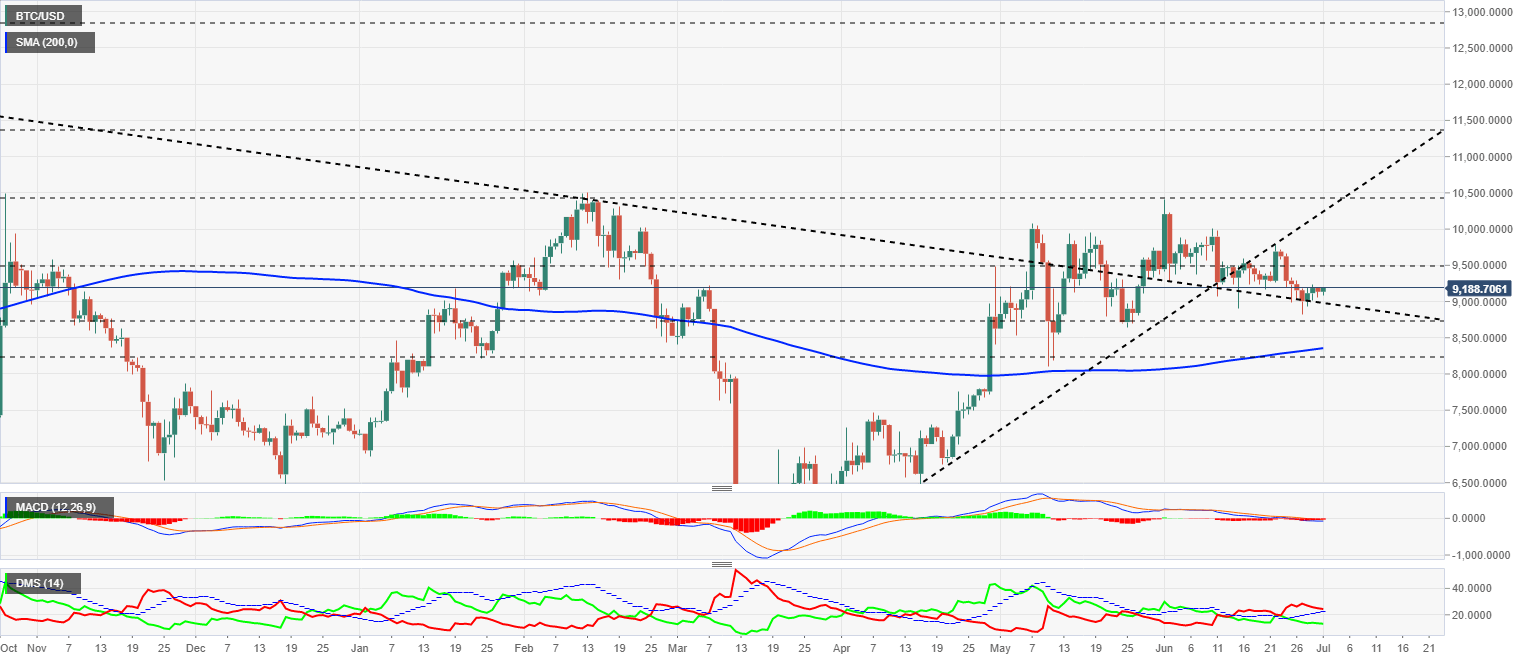
The MACD on the daily chart also shows a very flat profile, lacking direction and strength. The moving averages have penetrated the negative zone of the indicator.
The DMI on the daily chart shows bears controlling the BTC/USD pair while looking for support on the ADX line. Losing this support level would cancel out the current bearish pattern.
ETH/USD Daily Chart
The ETH/USD pair is currently trading at $228.6 and remains within the range of the past few weeks, between $245 and $220.
Above the current price, the first resistance level is at $235, then the second at $245 and the third one at $260.
Below the current price, the first support level is at $220, then the second at $200 and the third one at $190.

The MACD on the daily chart shows a slight bearish profile, a smooth descent in search of support from the indicator's zero levels.
The DMI on the daily chart shows bears controlling ETH/USD while finding support at the ADX line. Losing this support level would disable the current bearish pattern.
XRP/USD Daily Chart
The XRP/USD pair is currently trading at the price level of $0.176 and is still in agony after losing the support of the bullish line that has supported the price since March.
Above the current price, the first resistance level is at $0.165, then the second at $0.22 and the third one at $0.237.
Below the current price, the first support level is at $0.19, then the second at $0.14 and the third one at $0.10.
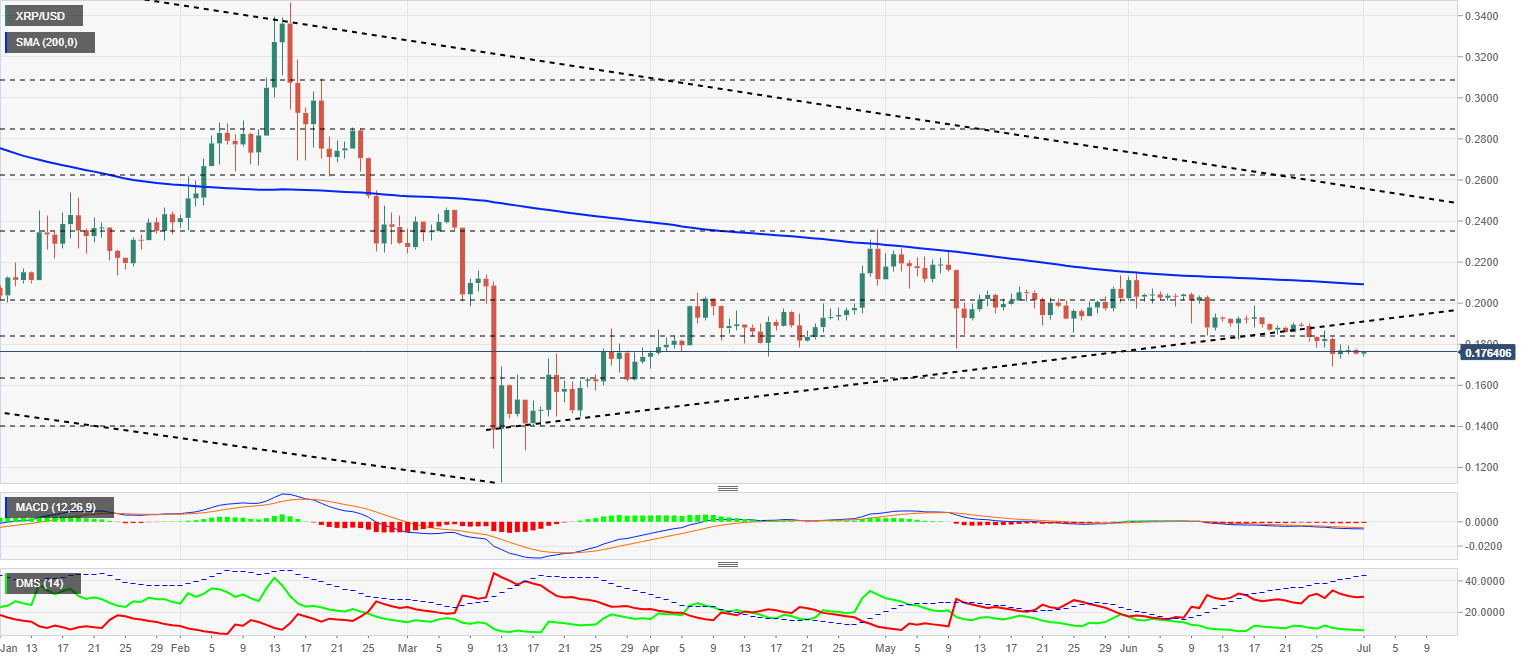
The MACD on the daily chart shows a completely flat profile and deepening in the negative zone of the indicator.
The DMI on the daily chart shows bears controlling the XRP/USD pair even if it is for lack of assistance from the buying side. The bulls are extremely lacking in trend force and will only break out of the range in December 2019.
Author

Tomas Salles
FXStreet
Tomàs Sallés was born in Barcelona in 1972, he is a certified technical analyst after having completing specialized courses in Spain and Switzerland. He expanded his technical training following the guidance of great experts on the financial markets.


