Top 3 Price Prediction Bitcoin, Ether, Ripple: Crypto summer will be back in the next spring


  • Moving averages structures project the consolidation process for several weeks in the future.
  • Forays into recent bearish scenarios cannot be ruled out, but they would be brief in time.
  • Ether is still doing well against Bitcoin in the short term.

The attention of the financial world is right now on the equity segment. The force with which prices are moving down is extraordinary, with terrifying technical details such as a close below 3000 points on the S&P 500… 100 points down!

The crypto universe is still in the process of technical consolidation, an expected development, since after the sharp rises of the past weeks, the moving averages had been left far behind and it was necessary to recover normality before going back up again.

The time projection of this price contraction process indicates that the current downward lateral trend is likely to continue until the end of March. 

As can be seen on this BTC/USD daily chart, the moving averages would start to cross in the middle of next month. This crossing could cause volatility to increase until the beginning of April.


ETH/BTC Daily Chart

The ETH/BTC pair is currently trading at the price level of 0.0256. Ether's relative performance against Bitcoin continues to be very favourable compared to the general trend in the crypto segment.

Above the current price, the first resistance level is at 0.026, then the second at 0.027 and the third one at 0.029.

Below the current price, the first support level is at 0.025, then the second at 0.023 and the third one at 0.022.

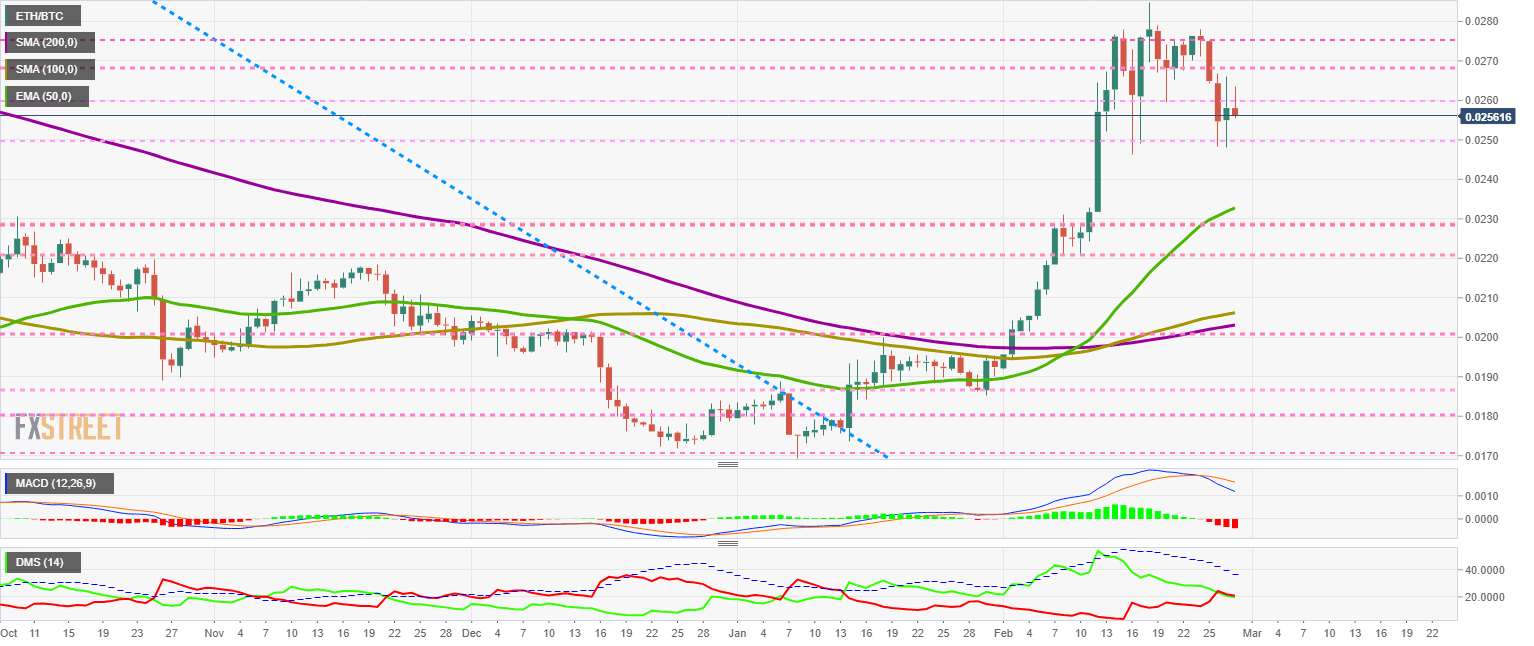
The MACD on the daily chart shows no profile changes. The bearish setup with a lateral bias is still active. 

The DMI on the daily chart shows how bears do not see the current time as an opportunity. The two sides of the market are staying very close together, and both are losing strength. The current setup is conducive to lateral movements and falling volatility.
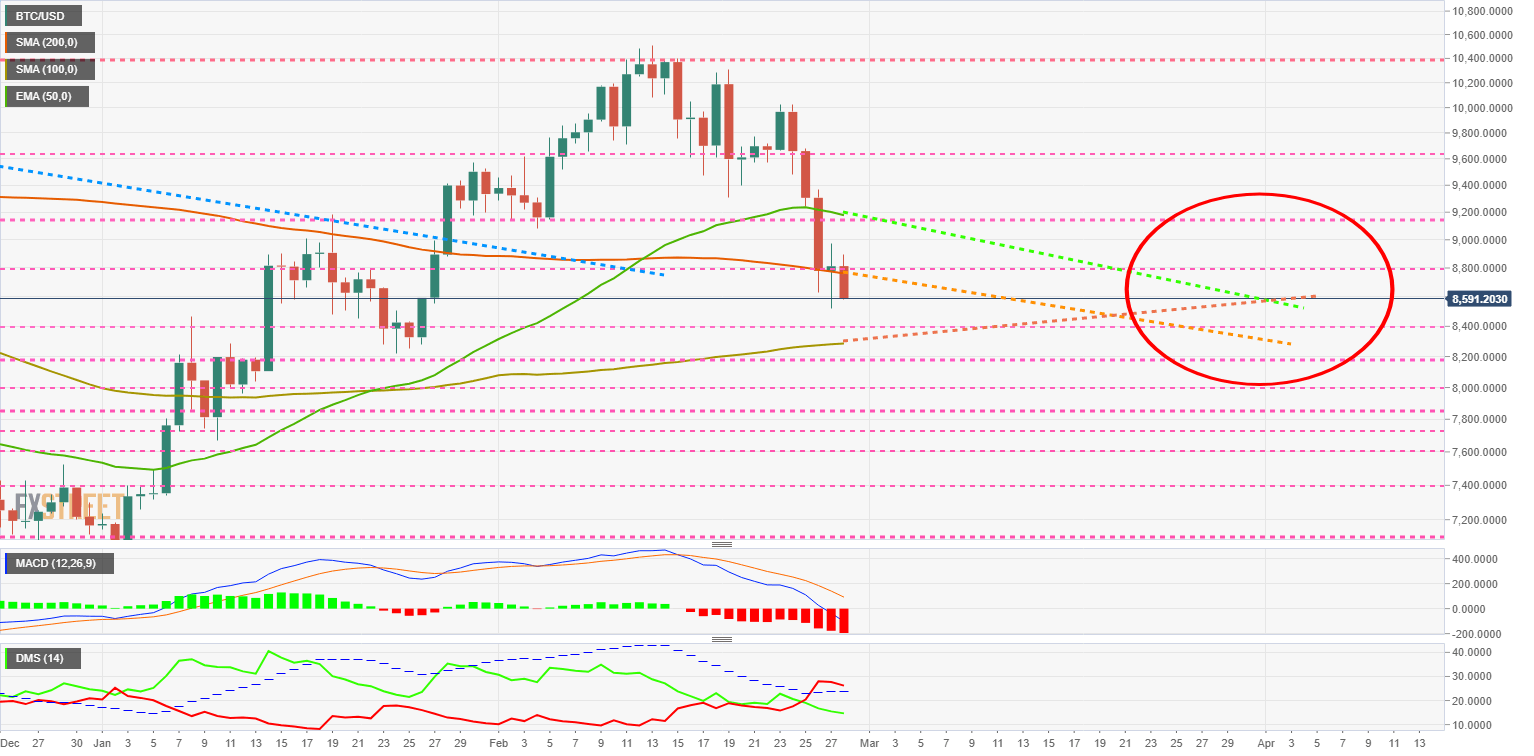
 

BTC/USD Daily Chart

BTC/USD is currently trading at $8607 and continues to be at risk due to the proximity of support separating the previous bearish scenario from the current bullish one.

Above the current price, the first resistance level is at $8800, then the second at $9150 and the third one at $9650.

Below the current price, the first support level is at $8400, then the second at $8200 and the third one at $8000.

The MACD on the daily chart is piercing the 0 levels and entering the bearish zone of the indicator. The current setup indicates the acceleration of the downward movement.

The DMI on the daily chart shows that the bears are dominating the pair even though they have lost strength in the last few hours. The setup is for continued downward movement with a background of lateral movement.


ETH/USD Daily Chart

ETH/USD is currently trading at the price level of $219.9 and finds support at the price congestion support level of $220.

Above the current price, the first resistance level is at $230, then the second at $240 and the third one at $250.

Below the current price, the first support level is at $215, then the second at $208 and the third one at $200.

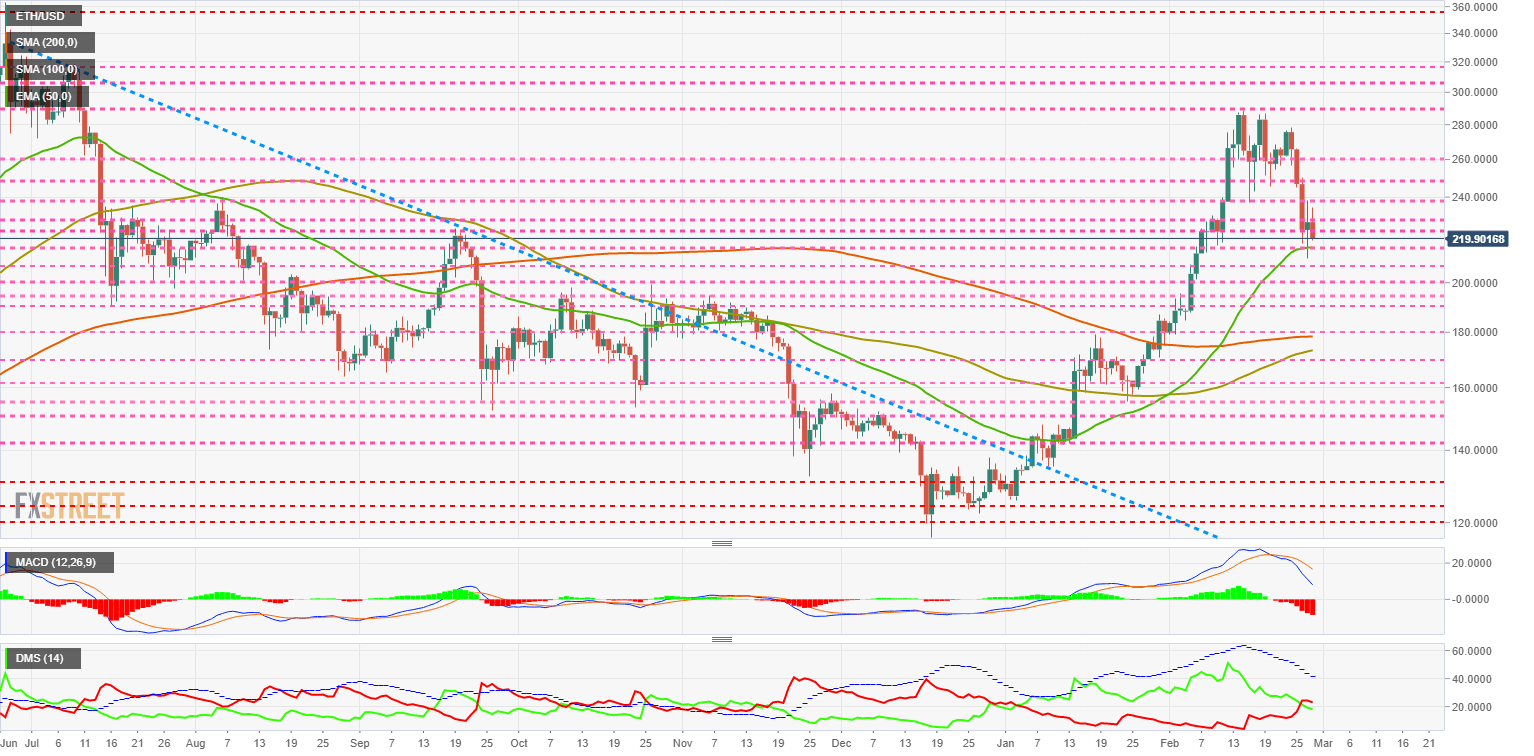
The MACD on the daily chart is increasing the bearish profile but still well within the positive side of the indicator. The setup suggests a lateral downward movement.

The DMI on the daily chart shows the bears gaining on the bullish side. The current setup doesn't make clear the future development in the short term.


XRP/USD Daily Chart

The XRP/USD pair is currently trading at the price level of $0.231 with the SMA100 acting as support. The clean moving average zone is above the price level at $0.26.

Above the current price, the first resistance level above the current price is at $0.24, then the second at $0.254 and the third one at $0.267.

Below the current price, the first support level is at $0.22, then the second at $0.20 and the third one at $0.19.

The MACD on the daily chart is now entering the bearish channel. The MACD on the daily chart penetrates the indicator's downward slope, increasing the probability of a rebound to the 0 levels.

The DMI on the daily chart shows bears controlling the pair but not being able to break the ADX line. The set up shows undefinition in the short term.


Get 24/7 Crypto updates in our social media channels: Give us a follow at @FXSCrypto and our FXStreet Crypto Trading Telegram channel


Information on these pages contains forward-looking statements that involve risks and uncertainties. Markets and instruments profiled on this page are for informational purposes only and should not in any way come across as a recommendation to buy or sell in these assets. You should do your own thorough research before making any investment decisions. FXStreet does not in any way guarantee that this information is free from mistakes, errors, or material misstatements. It also does not guarantee that this information is of a timely nature. Investing in Open Markets involves a great deal of risk, including the loss of all or a portion of your investment, as well as emotional distress. All risks, losses and costs associated with investing, including total loss of principal, are your responsibility. The views and opinions expressed in this article are those of the authors and do not necessarily reflect the official policy or position of FXStreet nor its advertisers. The author will not be held responsible for information that is found at the end of links posted on this page.

If not otherwise explicitly mentioned in the body of the article, at the time of writing, the author has no position in any stock mentioned in this article and no business relationship with any company mentioned. The author has not received compensation for writing this article, other than from FXStreet.

FXStreet and the author do not provide personalized recommendations. The author makes no representations as to the accuracy, completeness, or suitability of this information. FXStreet and the author will not be liable for any errors, omissions or any losses, injuries or damages arising from this information and its display or use. Errors and omissions excepted.

The author and FXStreet are not registered investment advisors and nothing in this article is intended to be investment advice.

Join Telegram

Recommended content


Recommended Content

Editors’ Picks

TRON gains 10% in 2024, supply of stablecoins reaches over $50 billion in Q1

TRON gains 10% in 2024, supply of stablecoins reaches over $50 billion in Q1

TRON, a blockchain-based digital platform, has seen positive growth in the first quarter of 2024, as seen in a Messari report. TRON noted gains across several metrics like market capitalization, revenue and total value locked. 

More Tron News

XRP hovers near $0.50 as Ripple CTO addresses concerns related to stablecoin launch

XRP hovers near $0.50 as Ripple CTO addresses concerns related to stablecoin launch

XRP is hovering near $0.53 on Friday, spending nearly all week below $0.55. Ripple CTO David Schwartz addressed concerns on stablecoin and XRP utility on Thursday. 

More Ripple News

Terraform Labs set to restrict access for users in the US after recent ruling in SEC lawsuit

Terraform Labs set to restrict access for users in the US after recent ruling in SEC lawsuit

Blockchain company Terraform Labs said Thursday that it will restrict access to some of its products and services for US-based users as it expects to receive a court order soon in light of its legal battle against the US Securities and Exchange Commission (SEC).

More Terra News

Bitcoin Weekly Forecast: BTC’s next breakout could propel it to $80,000 Premium

Bitcoin Weekly Forecast: BTC’s next breakout could propel it to $80,000

Bitcoin’s (BTC) recent price consolidation could be nearing its end as technical indicators and on-chain metrics suggest a potential upward breakout. However, this move would not be straightforward and could punish impatient investors. 

More Bitcoin News

Bitcoin: BTC post-halving rally could be partially priced in Premium

Bitcoin: BTC post-halving rally could be partially priced in

Bitcoin (BTC) price briefly slipped below the $60,000 level for the last three days, attracting buyers in this area as the fourth BTC halving is due in a few hours. Is the halving priced in for Bitcoin? Or will the pioneer crypto note more gains in the coming days? 

Read full analysis

BTC

ETH

XRP