Toncoin price surges 11% as Binance announces listing
- Toncoin price finds support around the daily level of $4.83, with an impending rally eyed.
- Binance exchange announces listing of TON token on Thursday.
- On-chain data shows TON's capitulation event occurred on Monday.
- A daily candlestick close below $4.83 would invalidate the bullish thesis.

Toncoin (TON) trades 11.8% higher at $6.07 on Thursday following Binance’s announcement of the TON token listing. TON’ price retested the daily support level at $4.83 on Monday and surged 9.5% the following day, as on-chain data also reveals a capitulation event that day, suggesting the potential for a rally in the coming days.
Binance exchange announces listing of Toncoin
Binance announced it will list Toncoin (TON) tokens on Thursday at 10:00 (UTC), with trading pairs including TON/BTC, TON/USDT, and TON/FDUSD, and will also add a seed tag. This listing follows Binance's launch of TON futures trading on March 1.
The move is expected to be bullish for Toncoin, as it will enhance the coin's visibility and accessibility to a broader audience, potentially increasing the trading volume and liquidity while also boosting its credibility and legitimacy in the market.
Binance will list $TON and open spot trading at 10:00 UTC today https://t.co/wV9JCdgj44
— TON (@ton_blockchain) August 8, 2024
Toncoin shows potential for a rally
Toncoin's price retested the daily support level at $4.83 on Monday and bounced 9.5% the next day. At the time of writing on Thursday, it trades higher by 11.8% at $6.07.
The daily support level at $4.83 aligns with a bullish order block from May 1, extending between $5.18 and $4.89, where institutional traders likely placed significant buy orders. Additionally, this support level coincides with the 61.8% Fibonacci retracement level of the rise from the March 17 low of $3.31 to the June 15 high of $8.34, at $5.23, making it a critical support zone.
If the support zone at $4.83 holds and TON breaks above the daily resistance at $6.23, it could rally 11% to retest the July 31 high of $6.94.
The Relative Strength Index (RSI) on the daily chart has rebounded from the oversold threshold of 30, while the Awesome Oscillator (AO) remains below the neutral zero level. If bulls are indeed making a comeback, both momentum indicators must maintain their positions above their respective mean levels of 50 and zero. This would add a tailwind to the recovery rally.
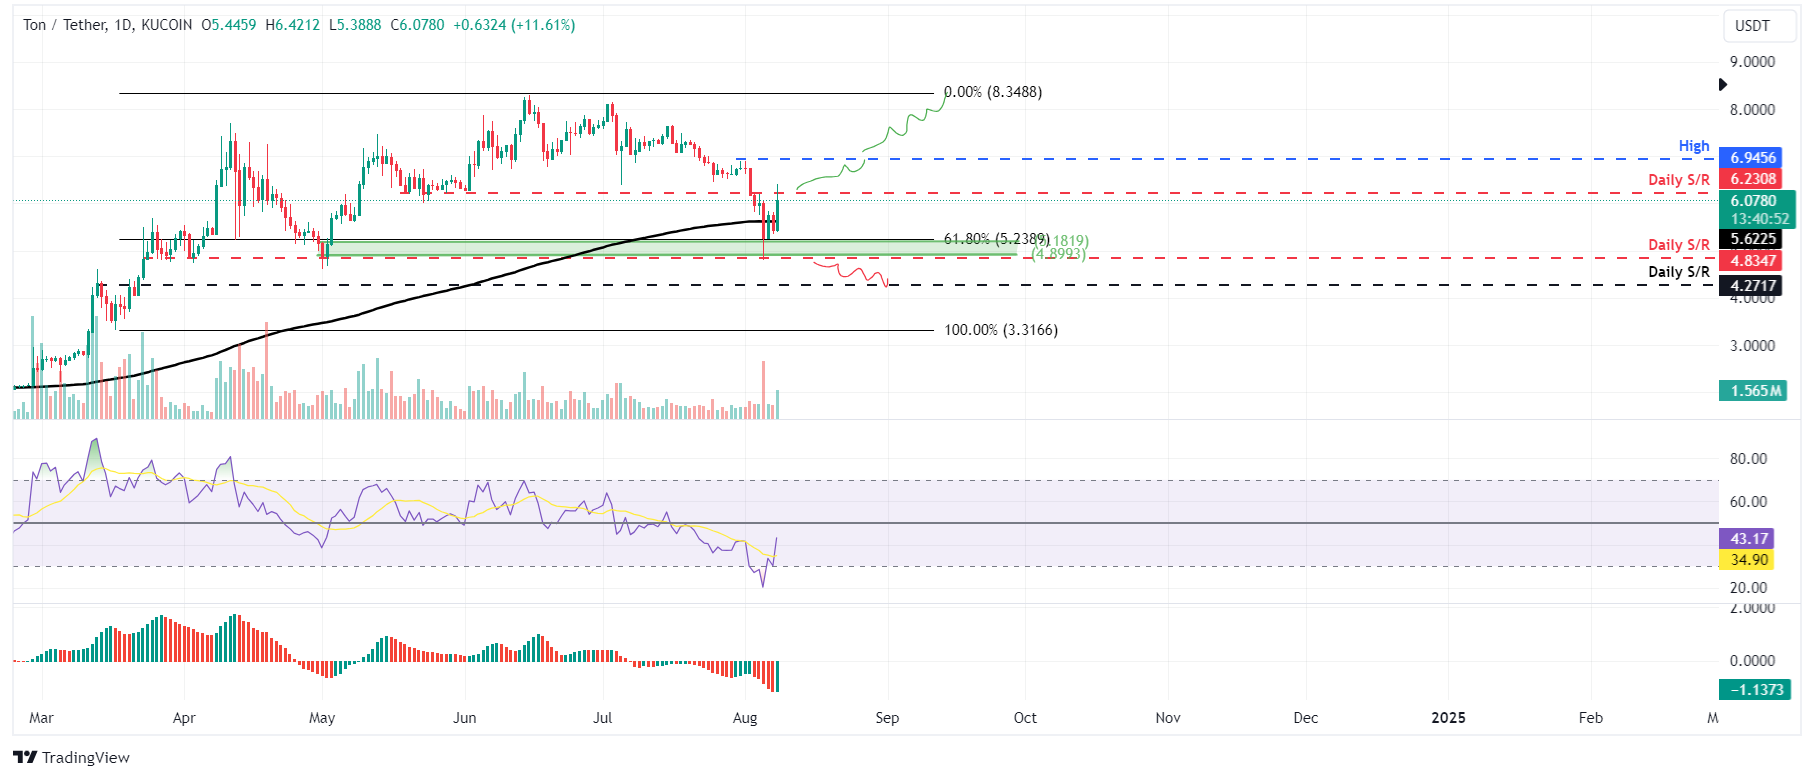
TON/USDT daily chart
On-chain data provider Santiment's Network Realized Profit/Loss (NPL) indicator computes a daily network-level Return On Investment (ROI) based on the coin's on-chain transaction volume. Simply put, it is used to measure market pain. Strong spikes in a coin's NPL indicate that its holders are, on average, selling their holdings at a significant profit. On the other hand, strong dips imply that the coin's holders are, on average, realizing losses, suggesting panic sell-offs and investor capitulation.
In TON's case, the NPL indicator dipped from -85,629 to -455,340 from Sunday to Monday, coinciding with a 12.5% price crash. This negative downtick indicates that the holders were, on average, realizing losses, suggesting panic sell-offs and investor capitulation.
%20[16.25.52,%2008%20Aug,%202024]-638587150155453280.png)
TON Network Realized Profit/Loss chart
On the other hand, during this event, Santiment's Supply Distribution metric shows that whales with 10,000 to 100,000 TON tokens dropped from 3.75 million to 3.55 million. Meanwhile, wallets holding 100,000 to 1 million TON surged from 3.69 million to 3.94 million in the same period.
This interesting development shows that the first cohort of whales could have fallen prey to the capitulation event. In contrast, the second set of wallets seized the opportunity and accumulated TON at a discount.
%20[16.25.18,%2008%20Aug,%202024]-638587150567138591.png)
TON Supply Distribution chart
Despite the Binance listing, bullish technical analysis, and favorable on-chain data, a daily candlestick close below $4.83 would invalidate the bullish thesis by creating a lower low on a higher timeframe, potentially leading Toncoin's price to drop 12% to the next daily support level at $4.27.
Author

Manish Chhetri
FXStreet
Manish Chhetri is a crypto specialist with over four years of experience in the cryptocurrency industry.


