Top 3 Price Prediction Bitcoin, Ethereum, Ripple: Bitcoin likely to crash 19% as dead-cat scenario unfolds
- Bitcoin price shows signs of slight recovery before resuming its downward trend.
- Ethereum price is set for a brief rise before the downtrend continues.
- Ripple price suggests a modest recovery, although a potential decline remains on the horizon.

Bitcoin (BTC), Ethereum (ETH), and Ripple (XRP) are currently showing indications of modest recoveries, with each cryptocurrency experiencing brief upward movements. However, these recoveries appear to be temporary, as technical analysis and market conditions suggest that the broader downward trends for these assets are likely to resume in the coming days.
Bitcoin price is likely to have a relief rally
Bitcoin price broke below the ascending trendline (drawn from multiple swing lows starting July 5) on August 2, leading to a 12% decline over the following three days. However, it tested support at $49,917, bounced back with a 3.7% increase on Tuesday, and showed a slight recovery to trade 1.5% higher at $56,694 by Wednesday.
In this scenario, BTC might see a dead-cat bounce — a short-lived price increase amid a broader downtrend — potentially encountering resistance at the 61.8% Fibonacci retracement level of $62,066 (drawn from the swing high of $70,079 on July 29 to Monday's low of $49,101). This level aligns with the broken trendline and the 100-day Exponential Moving Average (EMA) at around $63,022, marking it a critical reversal zone.
Failure to break above $62,066 might trigger a 19% crash, back to retest the $49,917 daily support level.
The daily chart's Relative Strength Index (RSI) indicator is around 36, just above the oversold threshold. This indicates the possibility of a temporary relief rally before the downward trend resumes.
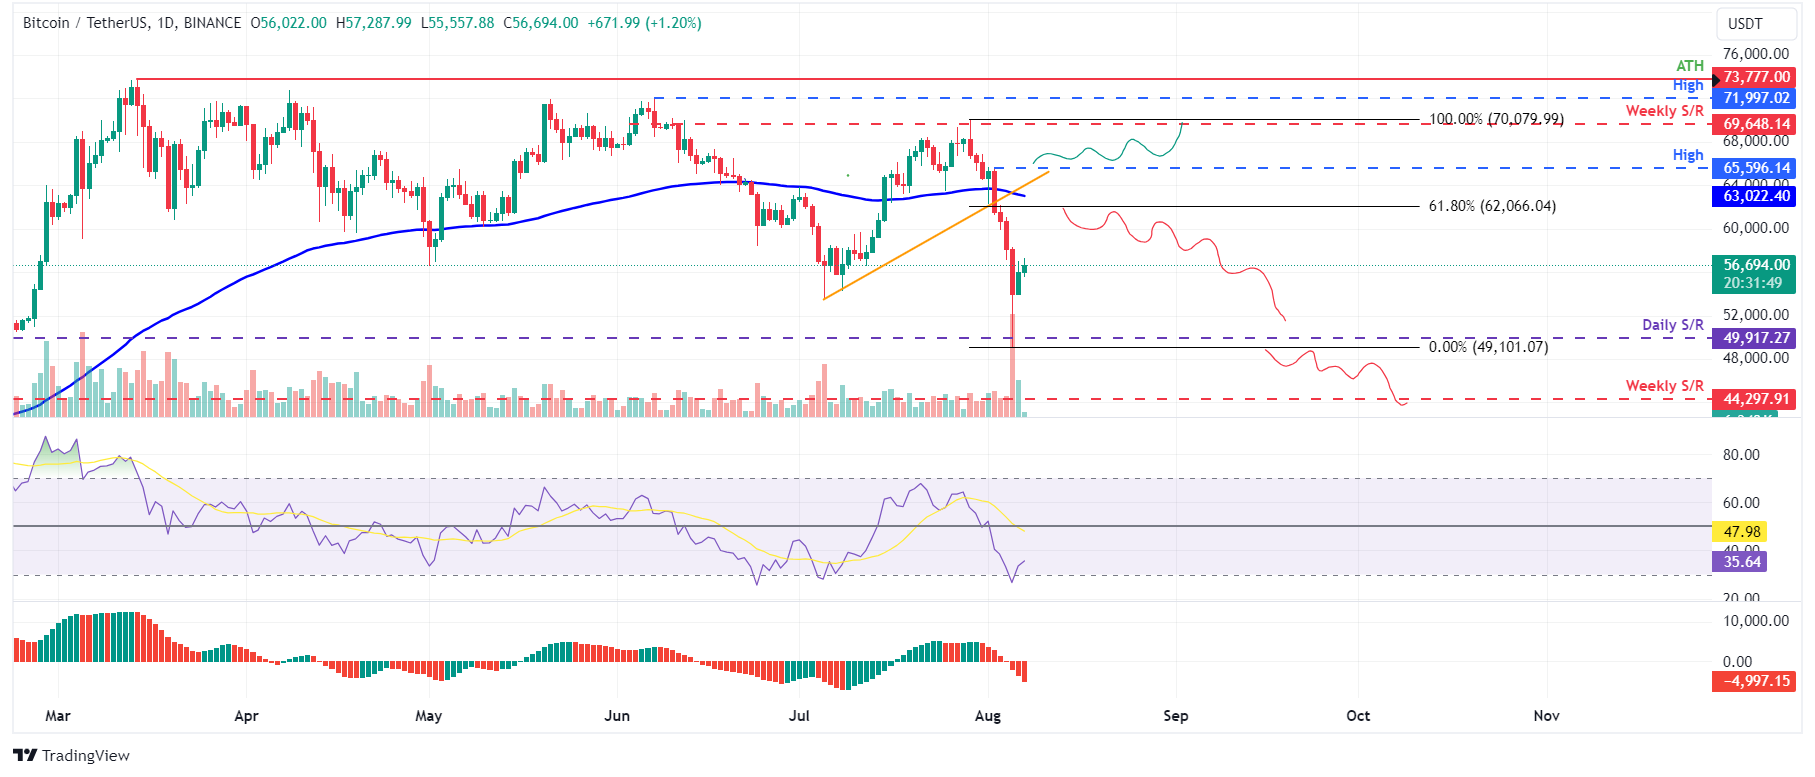
BTC/USDT daily chart
However, a close above the August 2 high of $65,596 would change the market structure by forming a higher high on the daily timeframe. Such a scenario might drive a 6% rise in Bitcoin's price to retest its weekly resistance at $69,648.
Ethereum price primed for temporary upsurge before downtrend resumes
Ethereum price closed below the daily support level of $2,927 on August 3, dropping 16.5% over the next two days. However, after testing the weekly support at $2,118, it bounced back with a 1.7% increase on Tuesday and showed further recovery, trading 1.8% higher at $2,505 by Wednesday.
If Ethereum's price continues to recover, it could face a rejection around the 50% retracement level (drawn from the swing high of $3,562 on July 22 to Monday's low of $2,124) at $2,843. This level roughly aligns with the daily resistance level at $2,927, making it a key reversal zone to watch.
If ETH fails to surpass the $2,843 level, it could crash 25% to retest its weekly support at $2,118.
The RSI and the Awesome Oscillator (AO) on the daily chart have fallen below their neutral levels of 50 and zero, respectively, indicating an overarching bearish trend based on these momentum indicators.
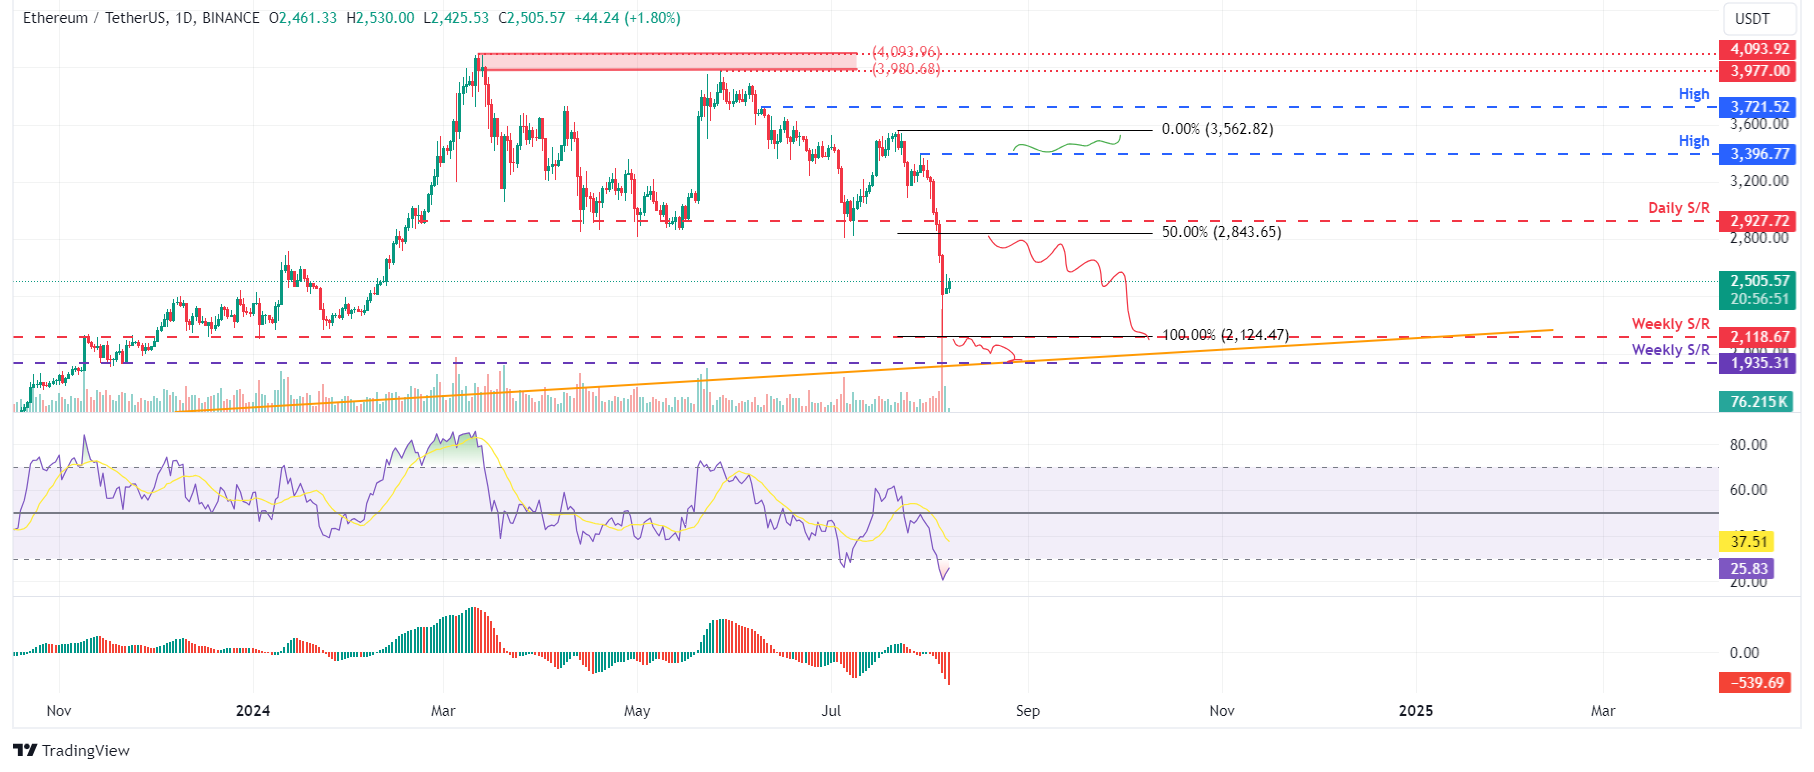
ETH/USDT daily chart
On the other hand, if Ethereum's price closes above the $3,396 daily high of July 29, it would change the market structure by forming a higher high on the daily timeframe. Such a scenario might drive a 5% rise in Ethereum's price to retest the July 22 high of $3,562.
Ripple price poised for relief rally before potential resumption of downtrend
Ripple's price fell below the daily support level of $0.544 on August 4, resulting in a 6.7% drop on Monday. However, it rebounded with a 3.7% increase on Tuesday after testing support of roughly $0.413. As of Wednesday, it shows signs of recovery, trading 0.6% higher at $0.509.
In this situation, XRP may undergo a dead-cat bounce, possibly encountering resistance at the previous daily support level of $0.544. This level now coincides with the 200-day Exponential Moving Average at approximately $0.539, highlighting it as a key reversal point.
If XRP fails to surpass the $0.544 level, it could lead to a 25% decline, potentially revisiting the $0.413 weekly support level.
The RSI and the AO on the daily chart have fallen below their neutral levels of 50 and zero, respectively, indicating a primarily bearish trend based on these momentum indicators.
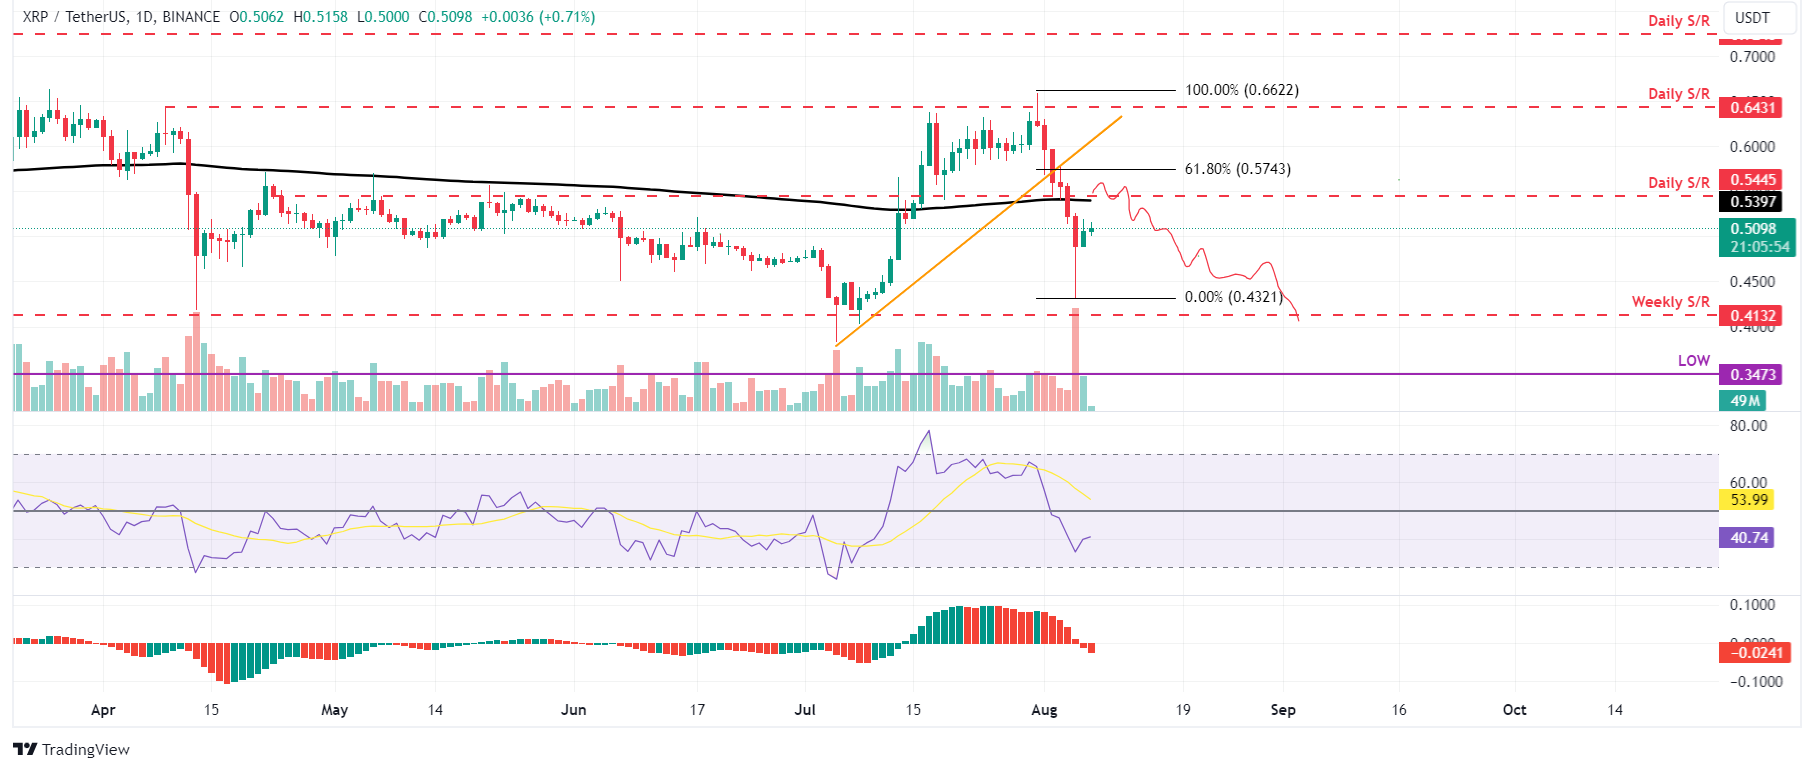
XRP/USDT daily chart
Conversely, if Ripple's price closes above the $0.643 daily resistance level, it would alter the market structure by establishing a higher high on the daily chart. This could lead to a 12% increase in XRP's price, targeting the next daily resistance at $0.724.
Author

Manish Chhetri
FXStreet
Manish Chhetri is a crypto specialist with over four years of experience in the cryptocurrency industry.


