Three reasons why Solana could see a double-digit decline
- Solana network has observed a drop in the number of active addresses and new addresses in September.
- Open interest in Solana has dropped nearly 20% between September 30 and October 4, suggesting capital is likely flowing out from SOL.
- Technical indicators show the likelihood of a correction in SOL when analyzing price action in different time frames.
- SOL could erase nearly 15% of its value if it falls to support at $120.

Solana (SOL) price appears to have found some support on Friday, recovering slightly from the sharp sell-off registered earlier this week. However, on-chain metrics and technical indicators show increasing chances of a further decline in prices, suggesting that the rebound could be short-lived.
These three factors signal Solana could suffer double-digit correction
Address activity in the Solana blockchain has dropped during September, both in terms of active and new addresses, according to data from The Block. While address activity remains well above its 2024 average levels, the recent decline suggests waning demand among market participants.
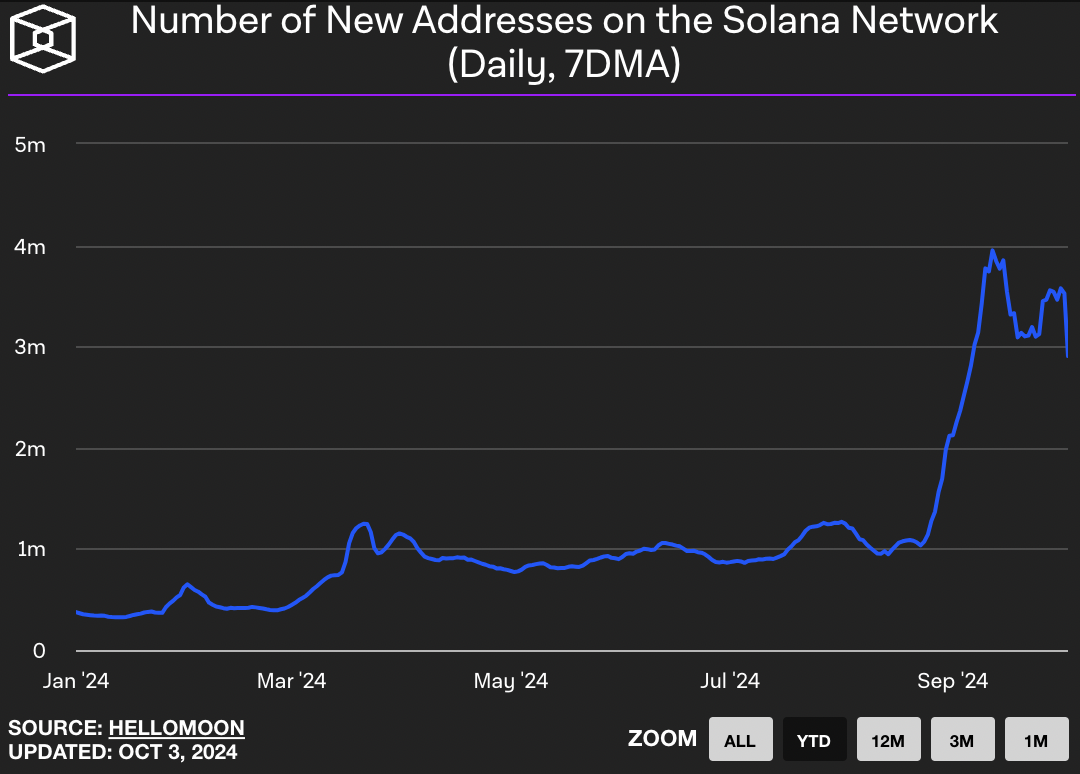
Number of new addresses on the Solana network
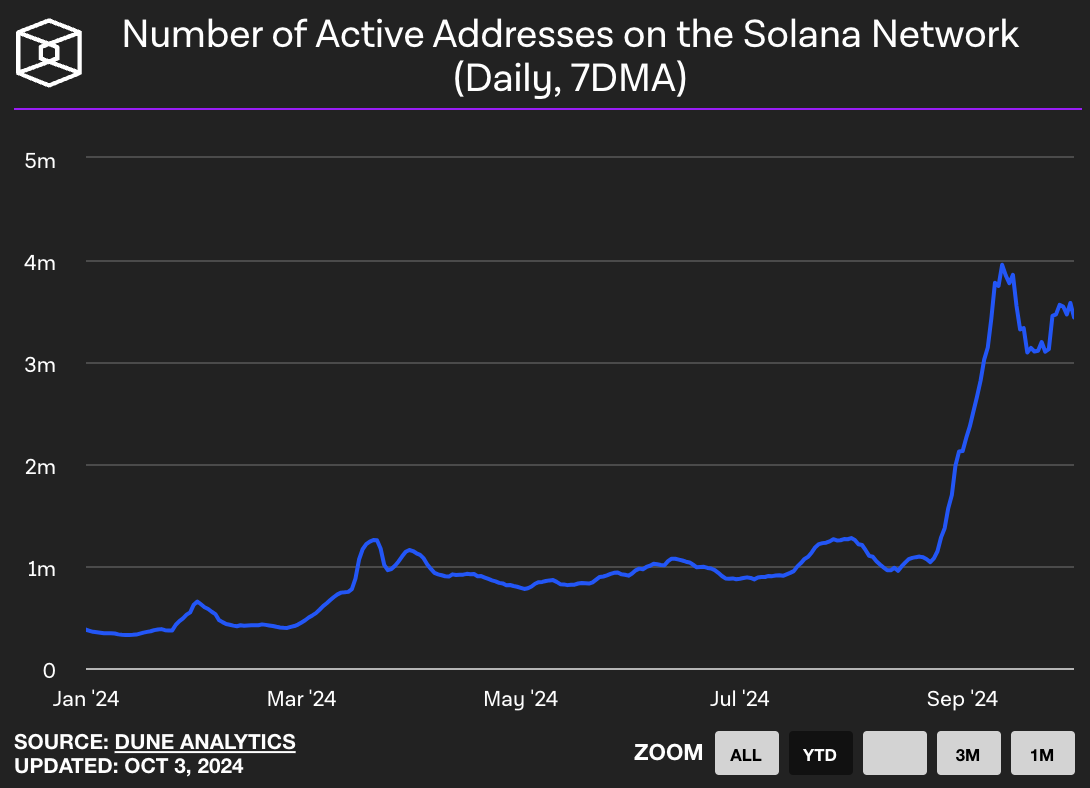
Number of active addresses on the Solana network
The second key factor is Open Interest (OI). The metric identifies the total number of active contracts in the options market that are currently “open” or awaiting expiration. Traders use the indicator to gauge interest and demand for an asset among market participants.
The OI in Solana dropped nearly 20% between September 30 and October 4, according to Coinglass data.
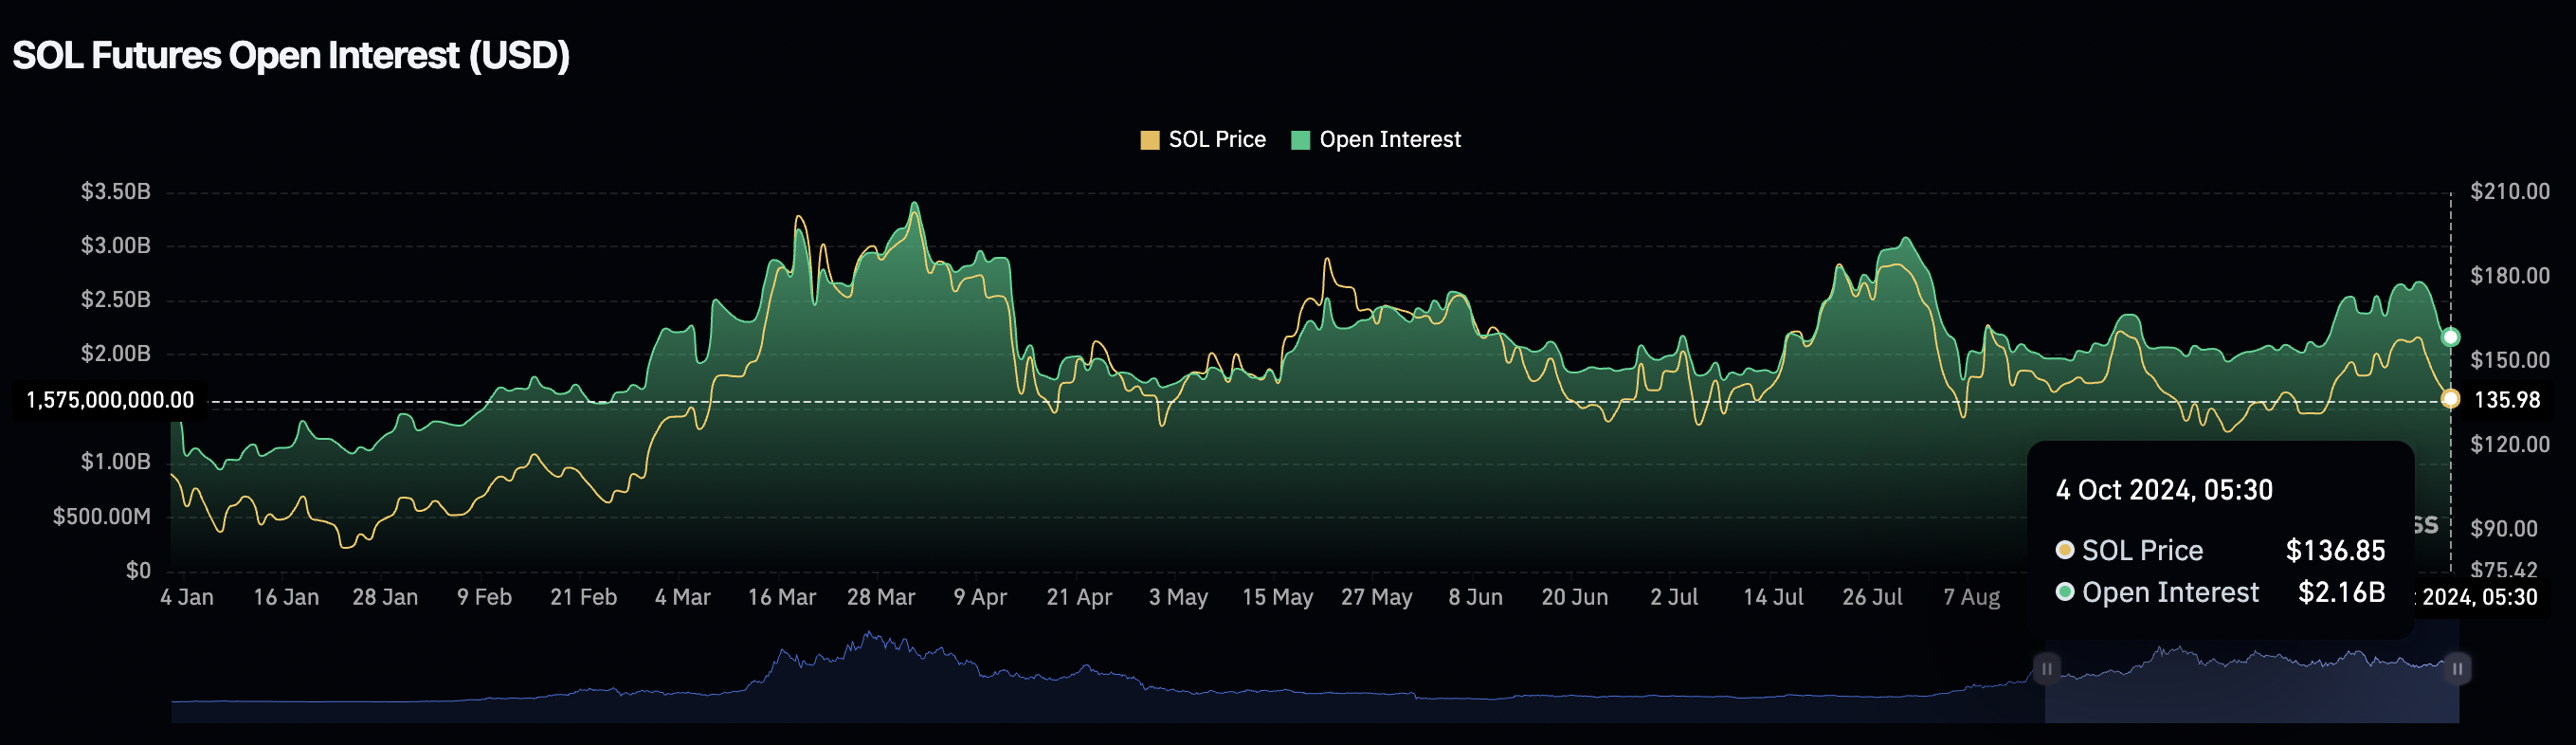
Solana Open Interest
The third factor is technical indicators on Solana price charts in different time frames.
Solana could suffer nearly 15% decline
Solana hovers around $140 on Friday. The altcoin is down 12% this week and, from a technical perspective, another double-digit decline is likely.
The Moving Average Convergence Divergence (MACD) indicator on two different time frames (daily and 4-hour) shows underlying negative momentum in SOL’s price trend.
On the daily chart, Solana has traded within a tight range between $163 and $120 since August, and an outlier is the asset’s decline to $110 low on August 5.
SOL is currently close to $140, near the midpoint of the range. If SOL corrects further, the altcoin could slip to the range low of $120 (nearly 15% decline) or sweep liquidity at the August 5 low of $110.
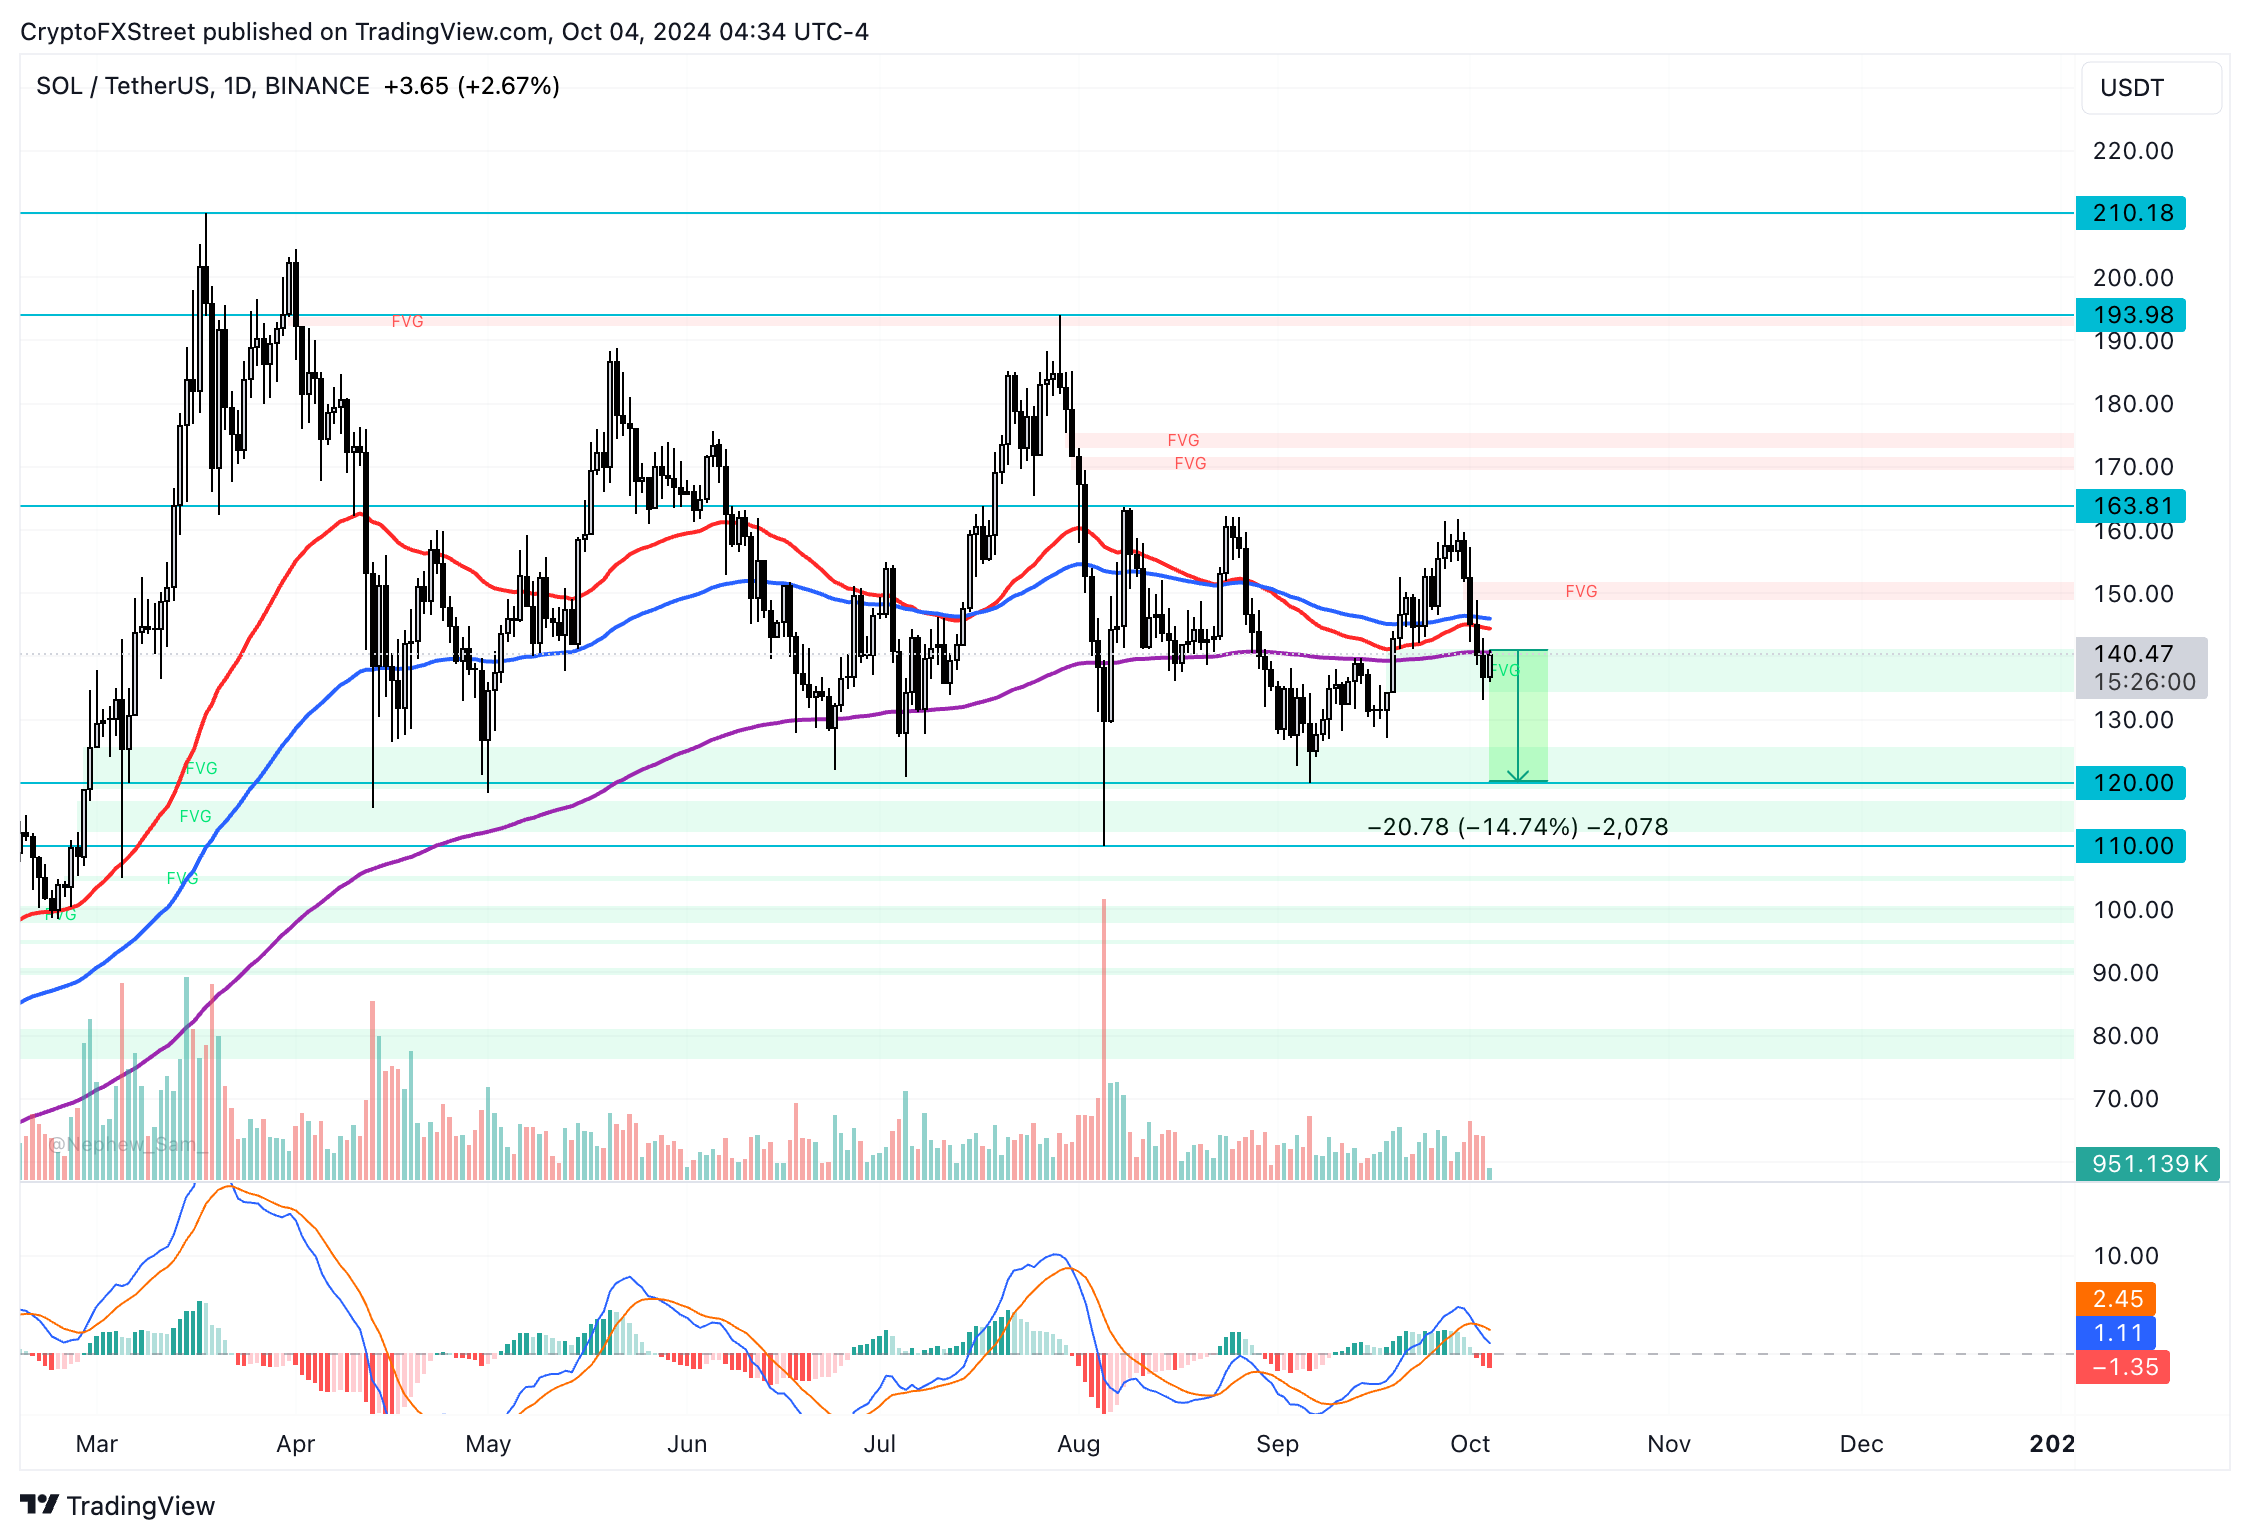
SOL/USDT daily chart
If Solana sees a daily candlestick close above Monday’s open at $158, the bearish thesis would be invalidated, and the altcoin could start climbing toward the psychologically important $160 level.
On the 4-hour SOL/USDT chart, Solana’s price is holding the medium-term uptrend and could find support in the Fair Value Gap (FVG) between $134.45 and $137.60 if there is a correction.
On the other side, if SOL closes above the 200-day EMA at $144.76, it could invalidate the bearish thesis and then rally towards the resistance zone between $149.99 and $155.93, an imbalance zone on the 4-hour chart.
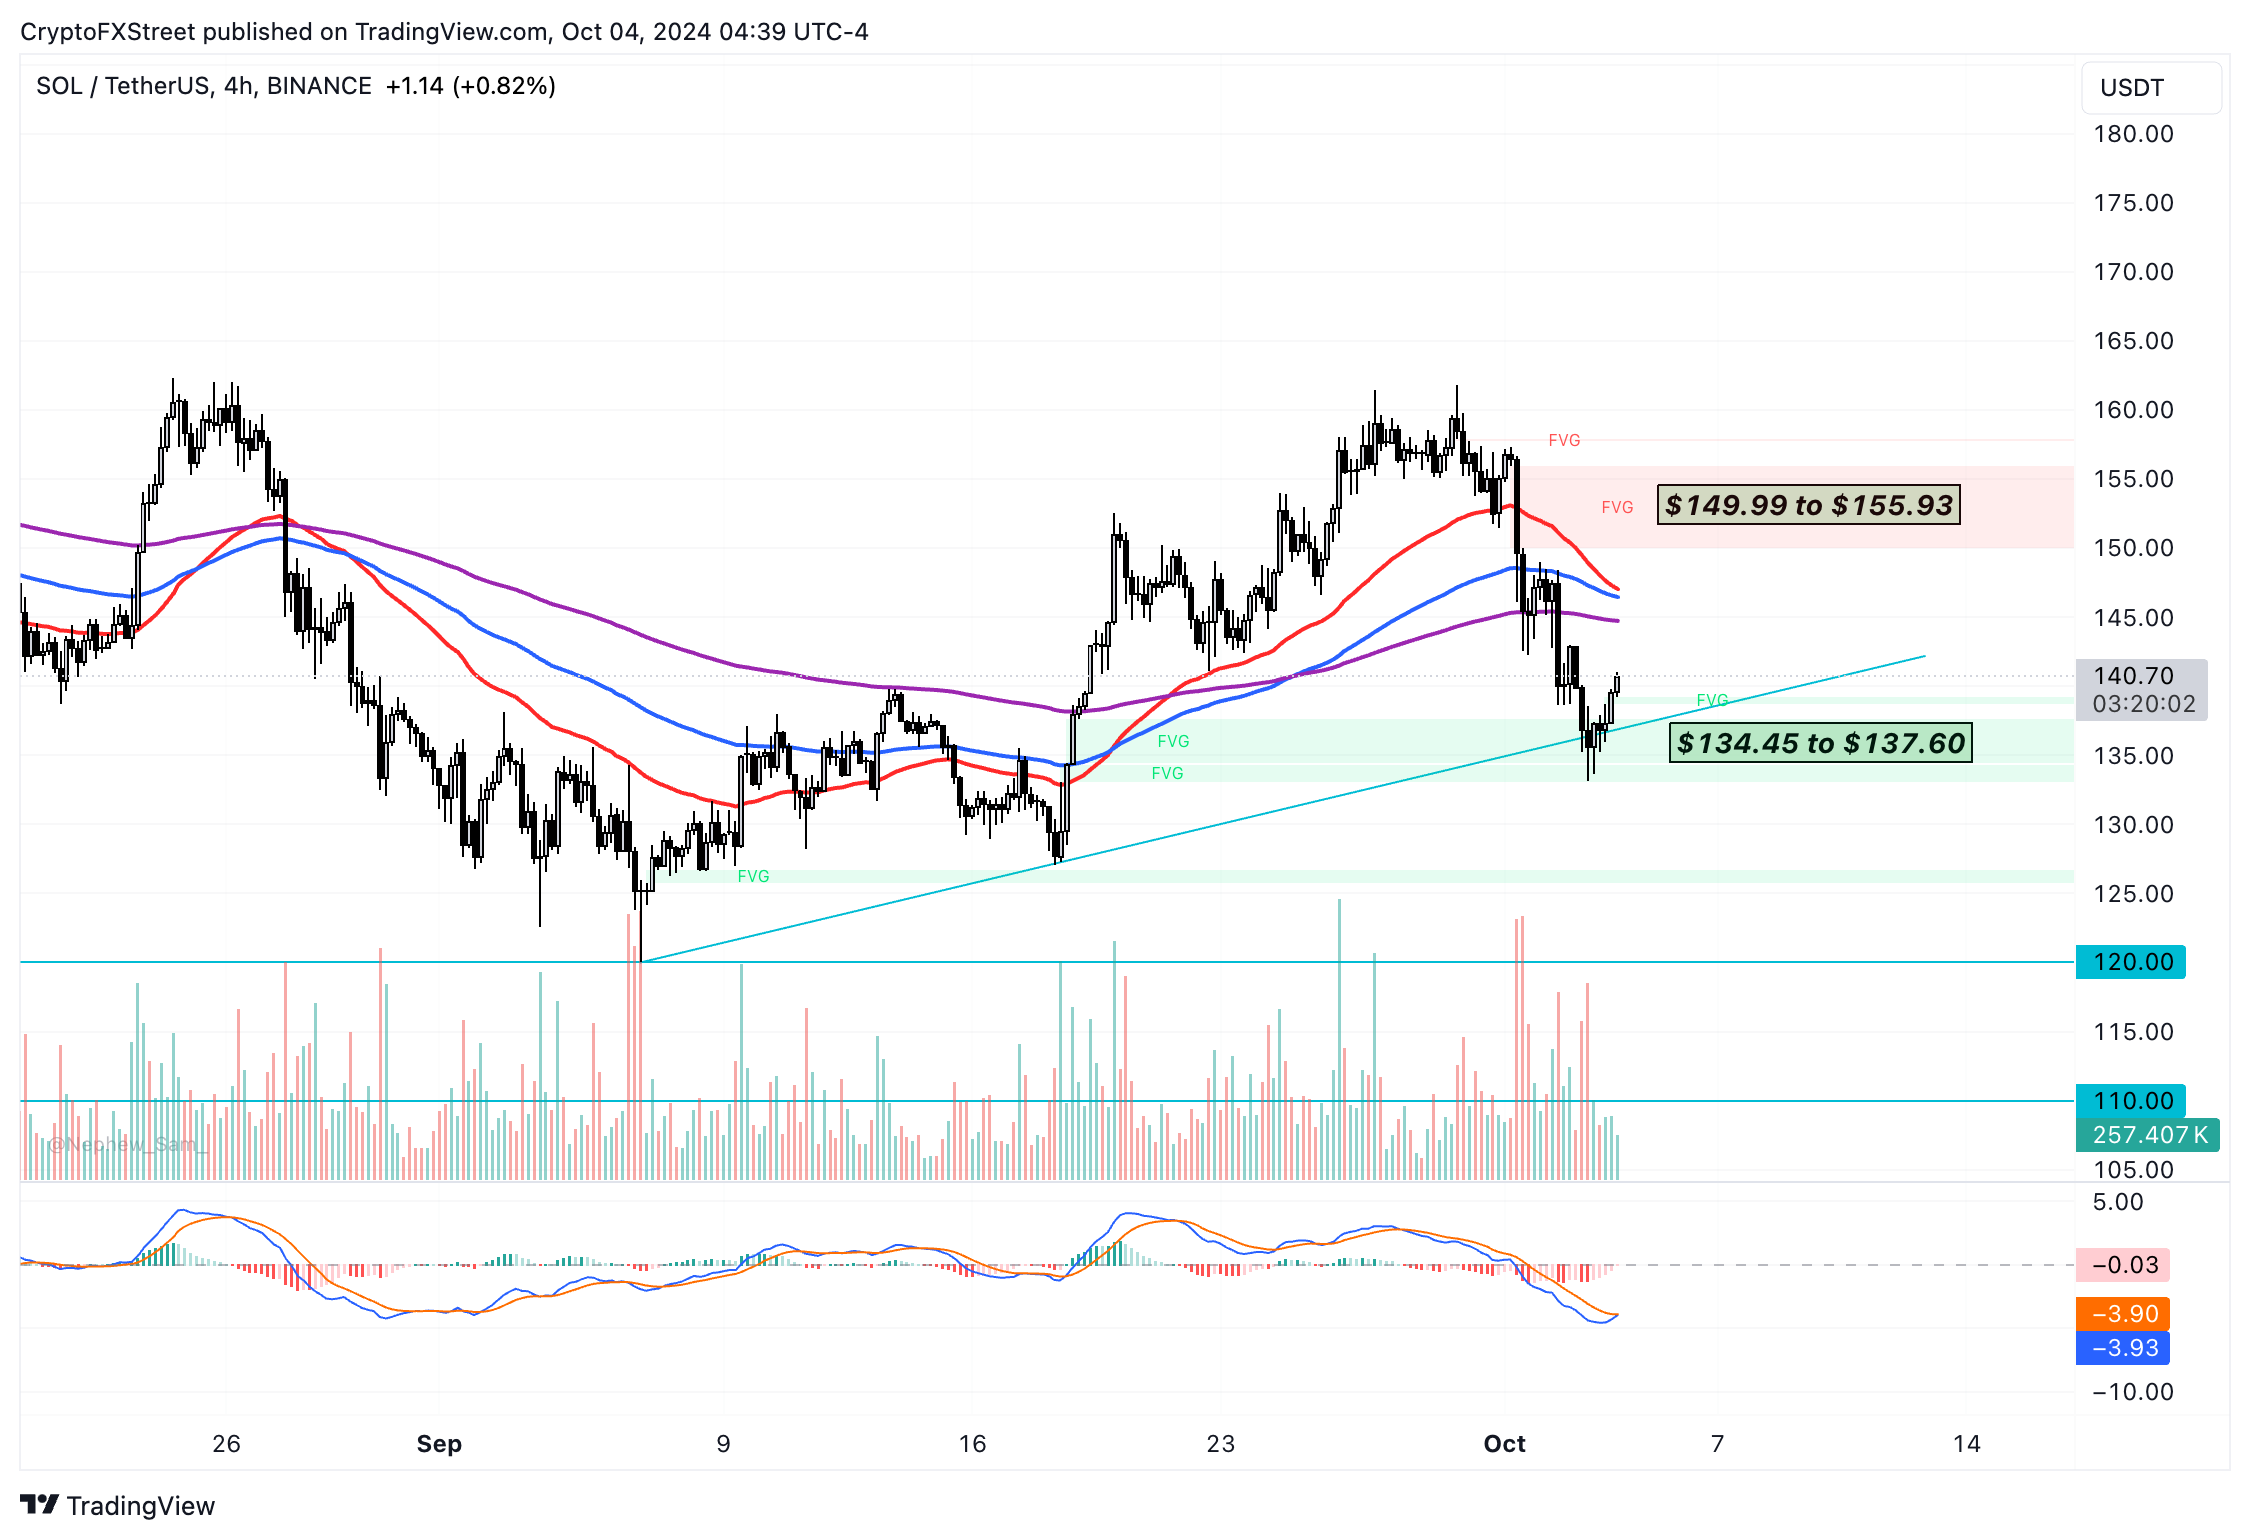
SOL/USDT 4-hour chart
Solana could sweep liquidity at $120, the lower boundary of the range where the asset has traded for nearly two months, before correcting or beginning its recovery.
Author

Ekta Mourya
FXStreet
Ekta Mourya has extensive experience in fundamental and on-chain analysis, particularly focused on impact of macroeconomics and central bank policies on cryptocurrencies.




