Solana rally to $160 likely, even as executives face off on whether the Solana Foundation should be dissolved
- Solana Breakpoint crypto conference hosts Solana Executive Director and CEO of VC firm, leaders debate on future of the Foundation.
- Solana eyes nearly 9% gains, targets $160 level.
- SOL trades at $146.90 early on Sunday.

Solana (SOL) hovers near $146 on Sunday, as SOL traders digest the debate between executives at the Breakpoint crypto conference. The event has taken place every year since 2021 and this year, two executives built the case for the dissolution and preservation of the Solana Foundation.
Technical indicators point at potential for gain in Solana price.
Solana price gain likely even as debate rages on The Solana Foundation
During the Solana Breakpoint crypto conference, Solana Foundation’s executive director Dan Albert suggested the dissolution of the entity. The executive built a case for the Foundation’s end and said what the entity can do, the ecosystem can do as well. If SOL token’s value soars and the Foundation continues to grow as well, it could become “an inefficient, bureaucratic monstrosity,” according to Albert.
Albert’s stance was met with opposition from CEO of venture capital firm RockawayX, Viktor Fischer. Fischer said that a dissolution of the foundation would end up net negative for the project as Solana Foundation helps provide a strategic direction for the network. The community comes together at hackathons and steer Solana towards kinship and growth, according to Fischer.
Dissolving the foundation would mean no organization would protect SOL community of holders from censorship, discrimination and subversion.
SOL eyes rally to $160
Solana is a multi-month upward trend. SOL started its climb to its March 2024 top in October 2023. The altcoin has since corrected to $146.88. The Ethereum competitor could rally to $160, the 50% Fibonacci retracement level of the decline from $210 March 2024 top to $110 low in August 2024.
SOL faces resistance in the imbalance zone between $149.30 and $155.53.
The Moving Average Convergence Divergence (MACD) indicator shows there is positive underlying momentum in SOL price trend.
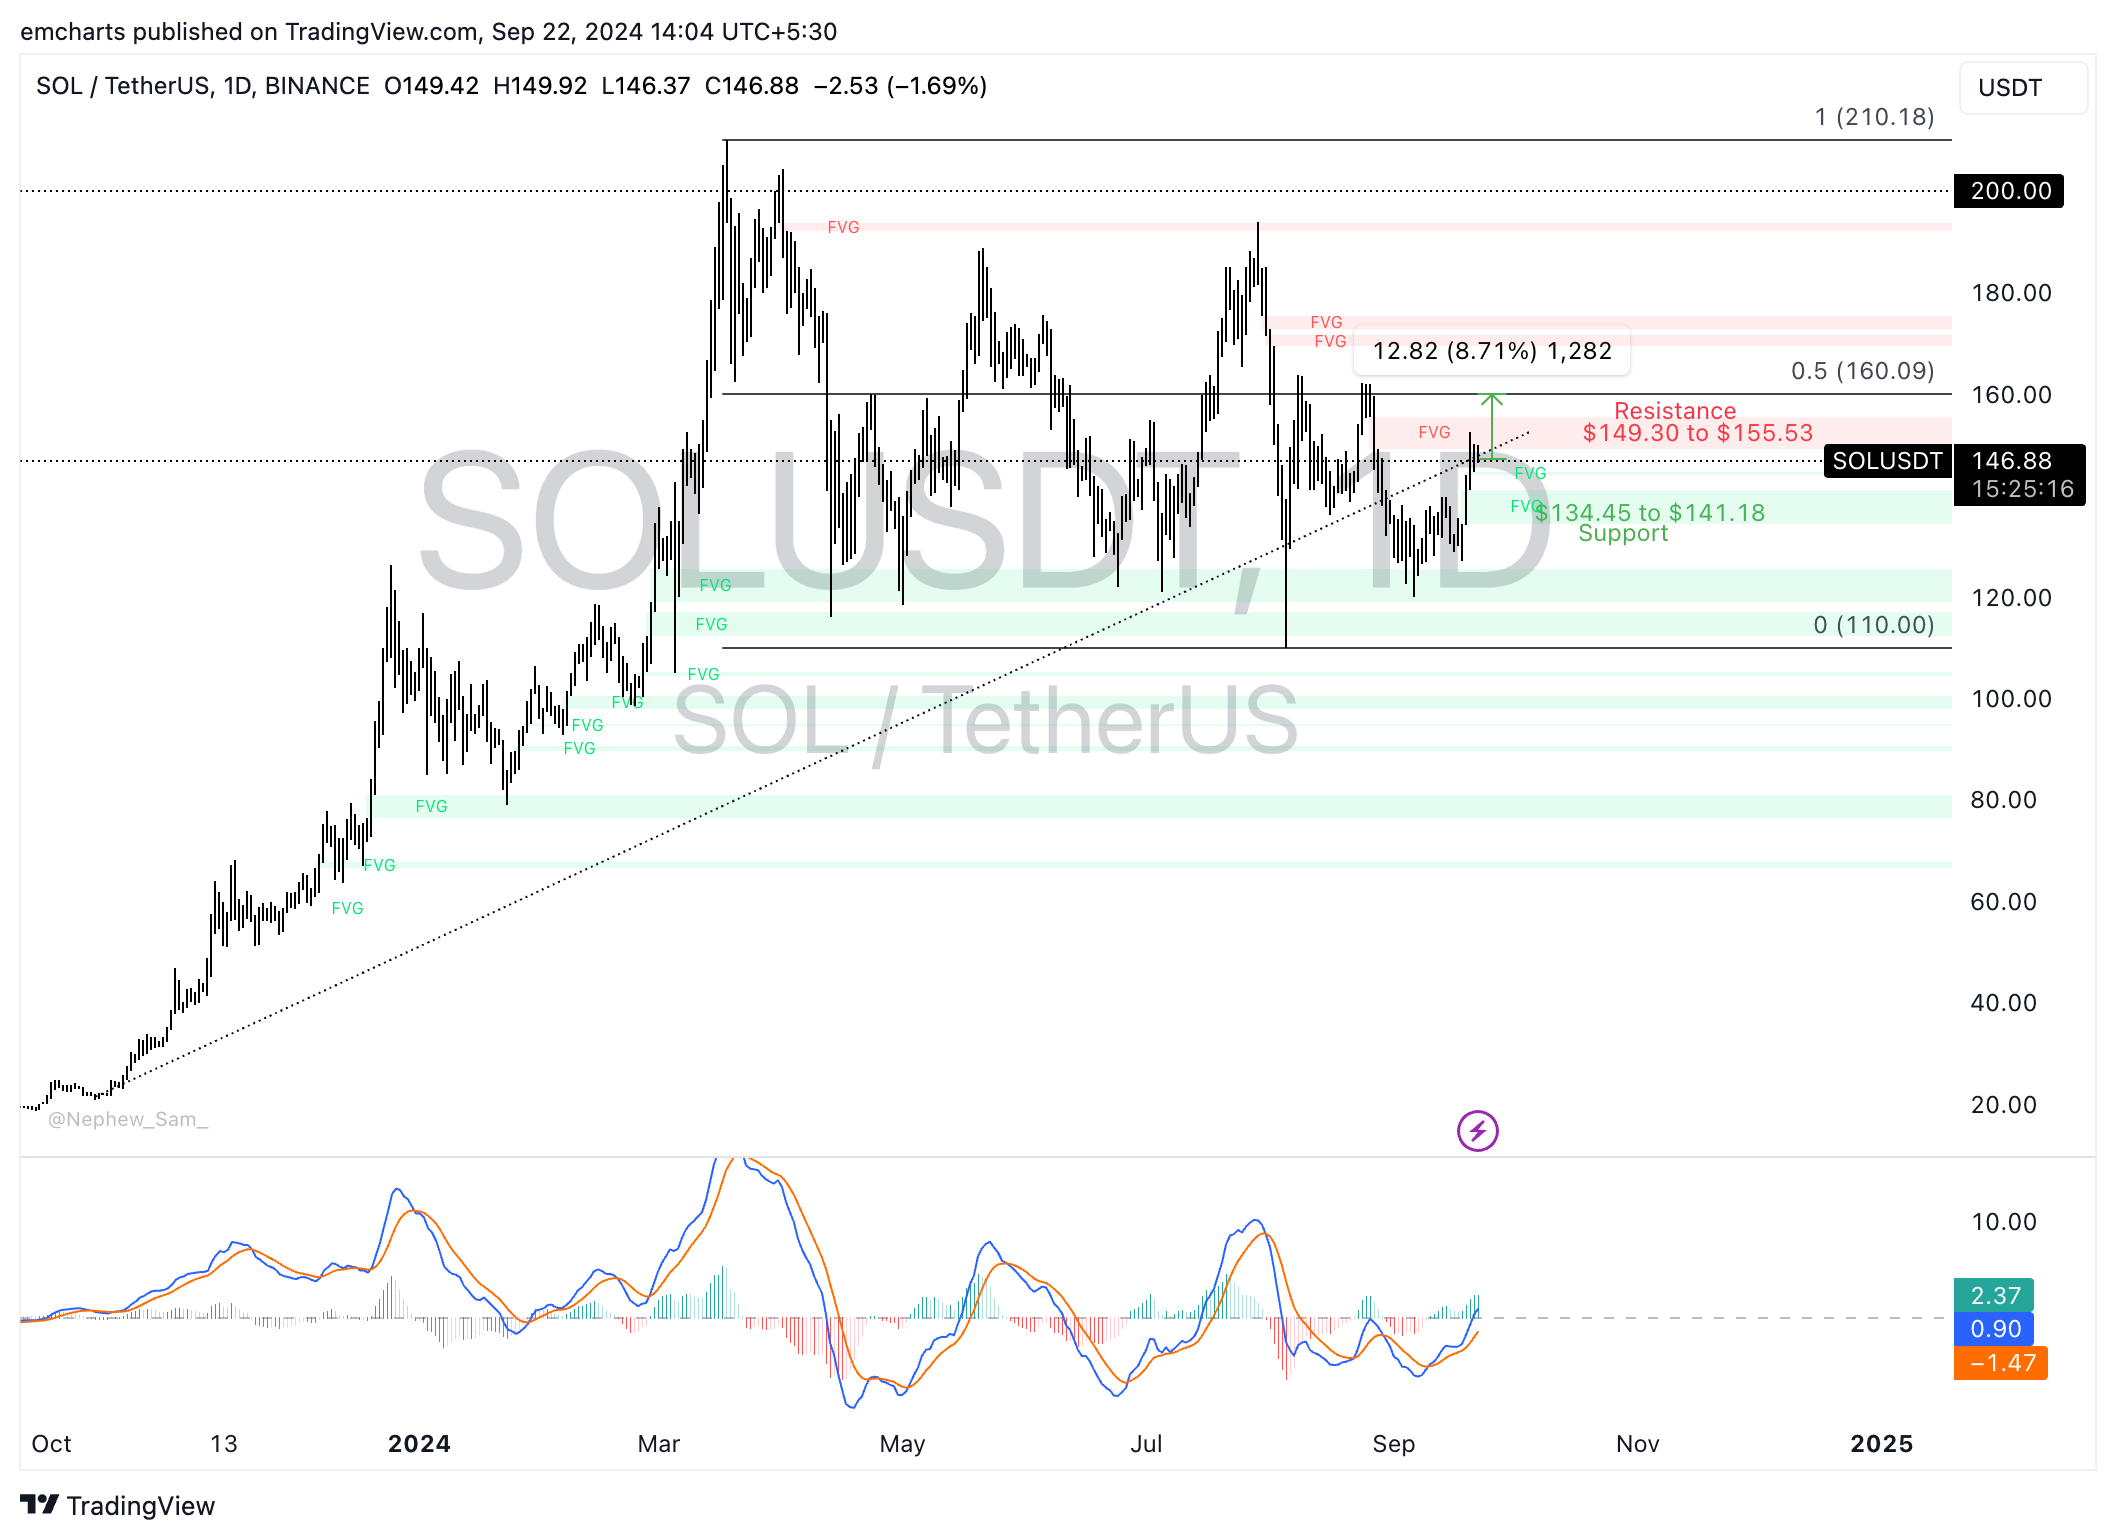
SOL/USDT daily chart
Solana could find support in the zone between $134.45 and $141.18, as seen in the daily chart. Looking down this imbalance zone acts as a key support area for Solana.
Cryptocurrency metrics FAQs
The developer or creator of each cryptocurrency decides on the total number of tokens that can be minted or issued. Only a certain number of these assets can be minted by mining, staking or other mechanisms. This is defined by the algorithm of the underlying blockchain technology. Since its inception, a total of 19,445,656 BTCs have been mined, which is the circulating supply of Bitcoin. On the other hand, circulating supply can also be decreased via actions such as burning tokens, or mistakenly sending assets to addresses of other incompatible blockchains.
Market capitalization is the result of multiplying the circulating supply of a certain asset by the asset’s current market value. For Bitcoin, the market capitalization at the beginning of August 2023 is above $570 billion, which is the result of the more than 19 million BTC in circulation multiplied by the Bitcoin price around $29,600.
Trading volume refers to the total number of tokens for a specific asset that has been transacted or exchanged between buyers and sellers within set trading hours, for example, 24 hours. It is used to gauge market sentiment, this metric combines all volumes on centralized exchanges and decentralized exchanges. Increasing trading volume often denotes the demand for a certain asset as more people are buying and selling the cryptocurrency.
Funding rates are a concept designed to encourage traders to take positions and ensure perpetual contract prices match spot markets. It defines a mechanism by exchanges to ensure that future prices and index prices periodic payments regularly converge. When the funding rate is positive, the price of the perpetual contract is higher than the mark price. This means traders who are bullish and have opened long positions pay traders who are in short positions. On the other hand, a negative funding rate means perpetual prices are below the mark price, and hence traders with short positions pay traders who have opened long positions.
Author

Ekta Mourya
FXStreet
Ekta Mourya has extensive experience in fundamental and on-chain analysis, particularly focused on impact of macroeconomics and central bank policies on cryptocurrencies.


