Three reasons why Bitcoin price analysis hints at a pullback to this level
- Bitcoin price shows cracks in its bullish ascent, suggesting an imminent sell-off.
- Bearish divergence, combined with other developments on the daily chart, reveals that a 7% to 15% retracement is likely.
- Invalidation of the bearish outlook will occur if BTC produces a daily candlestick close above $24,000.

Bitcoin price has been on a steady uptrend since January 1 and has shown no signs of stopping so far. However, things are starting to change with January 29’s daily candlestick close and could point to an incoming sell-off.
Bitcoin price could crumble soon
Bitcoin price has risen from $16,499 on January 1 to $23,860 on January 29. This ascent constitutes a 45% gain and could be coming to an end due to three reasons.
- Bearish engulfing candlestick: The daily chart shows that January 29 produced a ‘down’ candlestick with a -3.86% return. Since this candlestick completely overshadowed the previous ‘up’ candlestick, a bearish engulfing candlestick is formed. Typically, if this structure forms at the end of a rally, it denotes the start of a retracement or a steep correction.
- RSI Divergence: The bearish engulfing candlestick is not a standalone pattern, with the Relative Strength Index (RSI) also continuing to slip lower since January 14, signaling a declining momentum while the asset continued to soar higher. This non-conformity eventually results in a trend reversal favoring bears.
- Risk line: Lastly, we have the Momentum Reversal Indicator (MRI)’s risk line (blue) that has been breached by the Bitcoin price on the daily time frame. This level is present at $23,000 and is crucial in determining the direction of BTC. A flip of the risk line into a support floor often opens the path for the underlying asset to rally toward the next state trend resistance level, and a breakdown could catalyze a move toward the immediate support barrier.
Due to these bearish factors, Bitcoin price could be preparing for a correction, steep or otherwise. The 50-, 100- and 200-day Exponential Moving Averages (EMA) at $21,211, $19,959 and $19,384, respectively, are immediate support levels. A sudden spike in selling pressure that pushes the largest crypto by market capitalization will send BTC down to these levels.
The breakdown of these support structures will open Bitcoin price to retest the buying climax at $18,199. This level is where the sell-off should subside and provide a perfect opportunity for sidelined buyers to accumulate.
In case of cascading sell orders driven by frenzy bears, the state trend support level (green dotted) at $16,499 will be tagged next.
The most bearish outlook to come out after a 45% ascent would be if Bitcoin price breaches the $16,499 support level and sweeps the equal lows formed at $15,588 to collect the sell-stop liquidity.
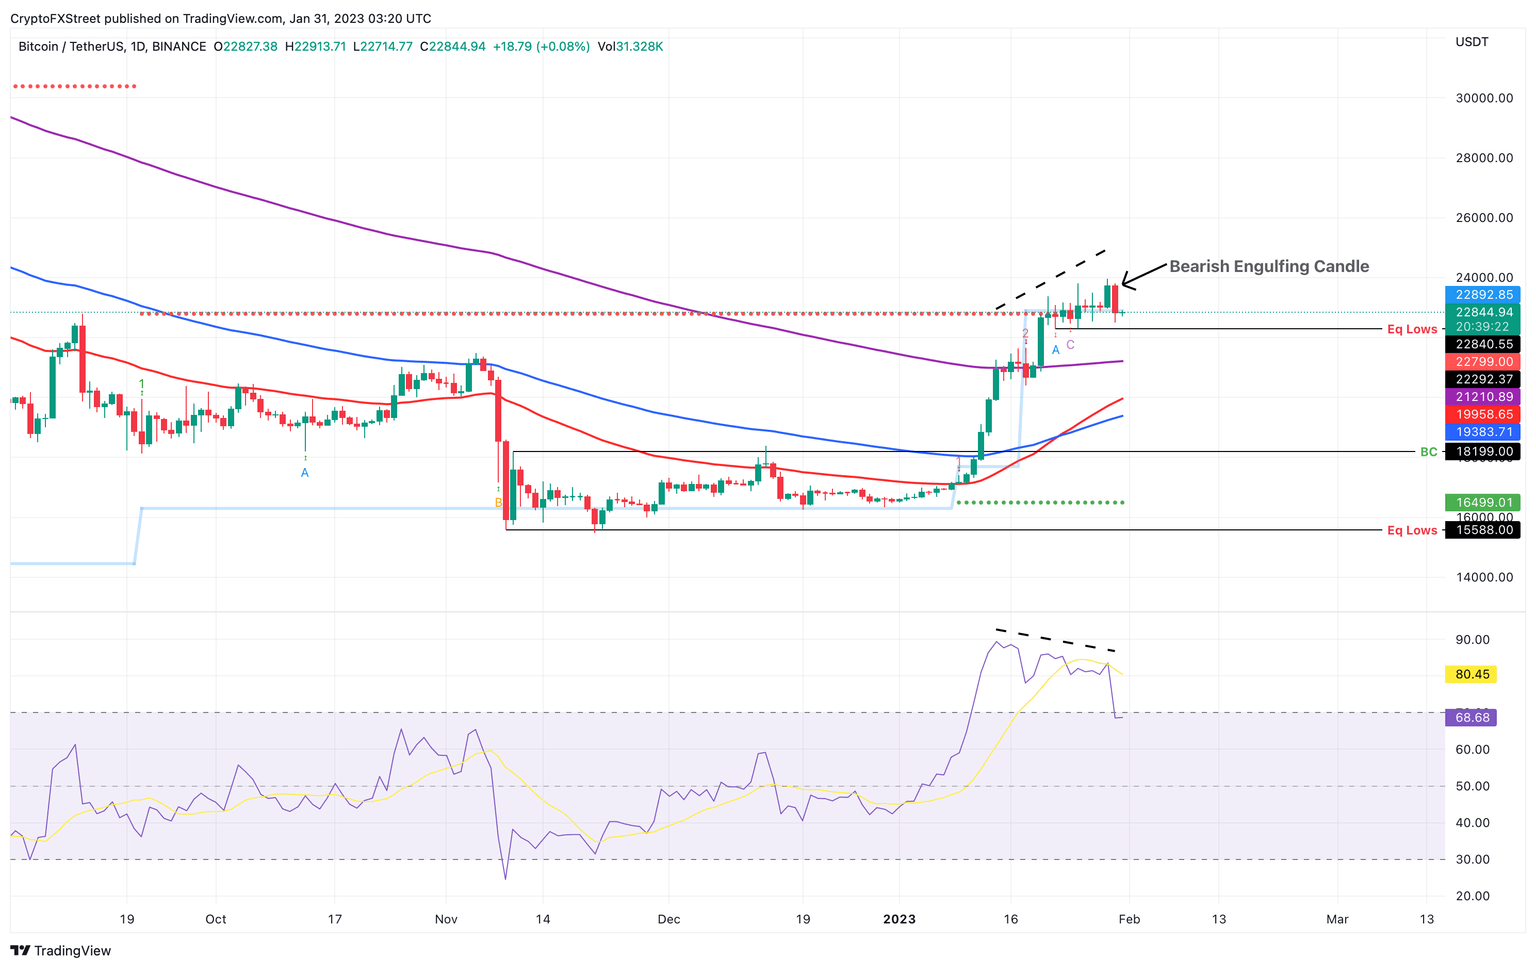
BTC/USDT 1-day chart
On the other hand, the Federal Open Meeting Committee (FOMC) Meeting scheduled to take place on February 1 could influence Bitcoin price to continue its ascent. If BTC decides to ignore these blatant bearish signals and produces a higher high above $24,000, it will invalidate the pessimistic outlook.
In such a case, Bitcoin price could attempt to retest the next state trend resistance level (red dotted) at $30,444.
Author

Akash Girimath
FXStreet
Akash Girimath is a Mechanical Engineer interested in the chaos of the financial markets. Trying to make sense of this convoluted yet fascinating space, he switched his engineering job to become a crypto reporter and analyst.


