This Shiba Inu price move has the potential to be the best trade of 2022
- Shiba Inu price is trading around the highest-traded level, aka Point of Control (POC), at $0.0000118.
- This level is a make-or-break point that will influence investors’ stances.
- A weekly candlestick close below $0.0000083 will invalidate the bullish thesis for SHIB.

Shiba Inu price shows a dual outlook where it could go either way depending on the overall market bias. However, since many altcoins are relatively underperforming a bunch of altcoins, SHIB could see a different outlook.
Shiba Inu price with the duality it presents
Shiba Inu price dropped 76% between April and June 2022. This downswing pushed it from a high of $0.0000300 to a low of $0.0000071. Since this local bottom, SHIB has risen an incredible 68%.
The volume profile extending from the peak of the aforementioned crash to August 4 shows that the highest volume was traded at $0.0000118. An interesting observation here is that the recovery has pushed Shiba Inu price to move past this level, which is now serving as a support level.
The dual nature of the trading is clearer from this vantage point and shows that as long as the $0.0000118 support level holds, the chances of a bullish move are high. A breakdown, on the other hand, would indicate a possibility of a correction.
A move on either side makes sense especially considering the lack of high-volume nodes. From a bullish perspective, no major resistance levels are present up to $0.0000198. Beyond this level, a weekly resistance level at $0.0000211 could hinder an up move.
To the downside, a price inefficiency exists at $0.0000083, which could potentially harm early investors hoping to capitalize on the bullish move.
Due to this ambiguity, the best result can be obtained by looking at the Bitcoin price, which is the driver and the provider of the directional bias to the crypto ecosystem, at least for the majority of the time.
From a traders’ perspective, a fill of the FVG as soon as possible would be the signal that triggers a buying opportunity for Shiba Inu price, especially if the overall market condition looks bullish.
In such a case, a swing long position at $0.0000083 with a target of $0.0000198 and $0.0000211 would be the best asymmetric risk/reward trade a trader could hope for. This move, if it manifests, would be a 154% gain.
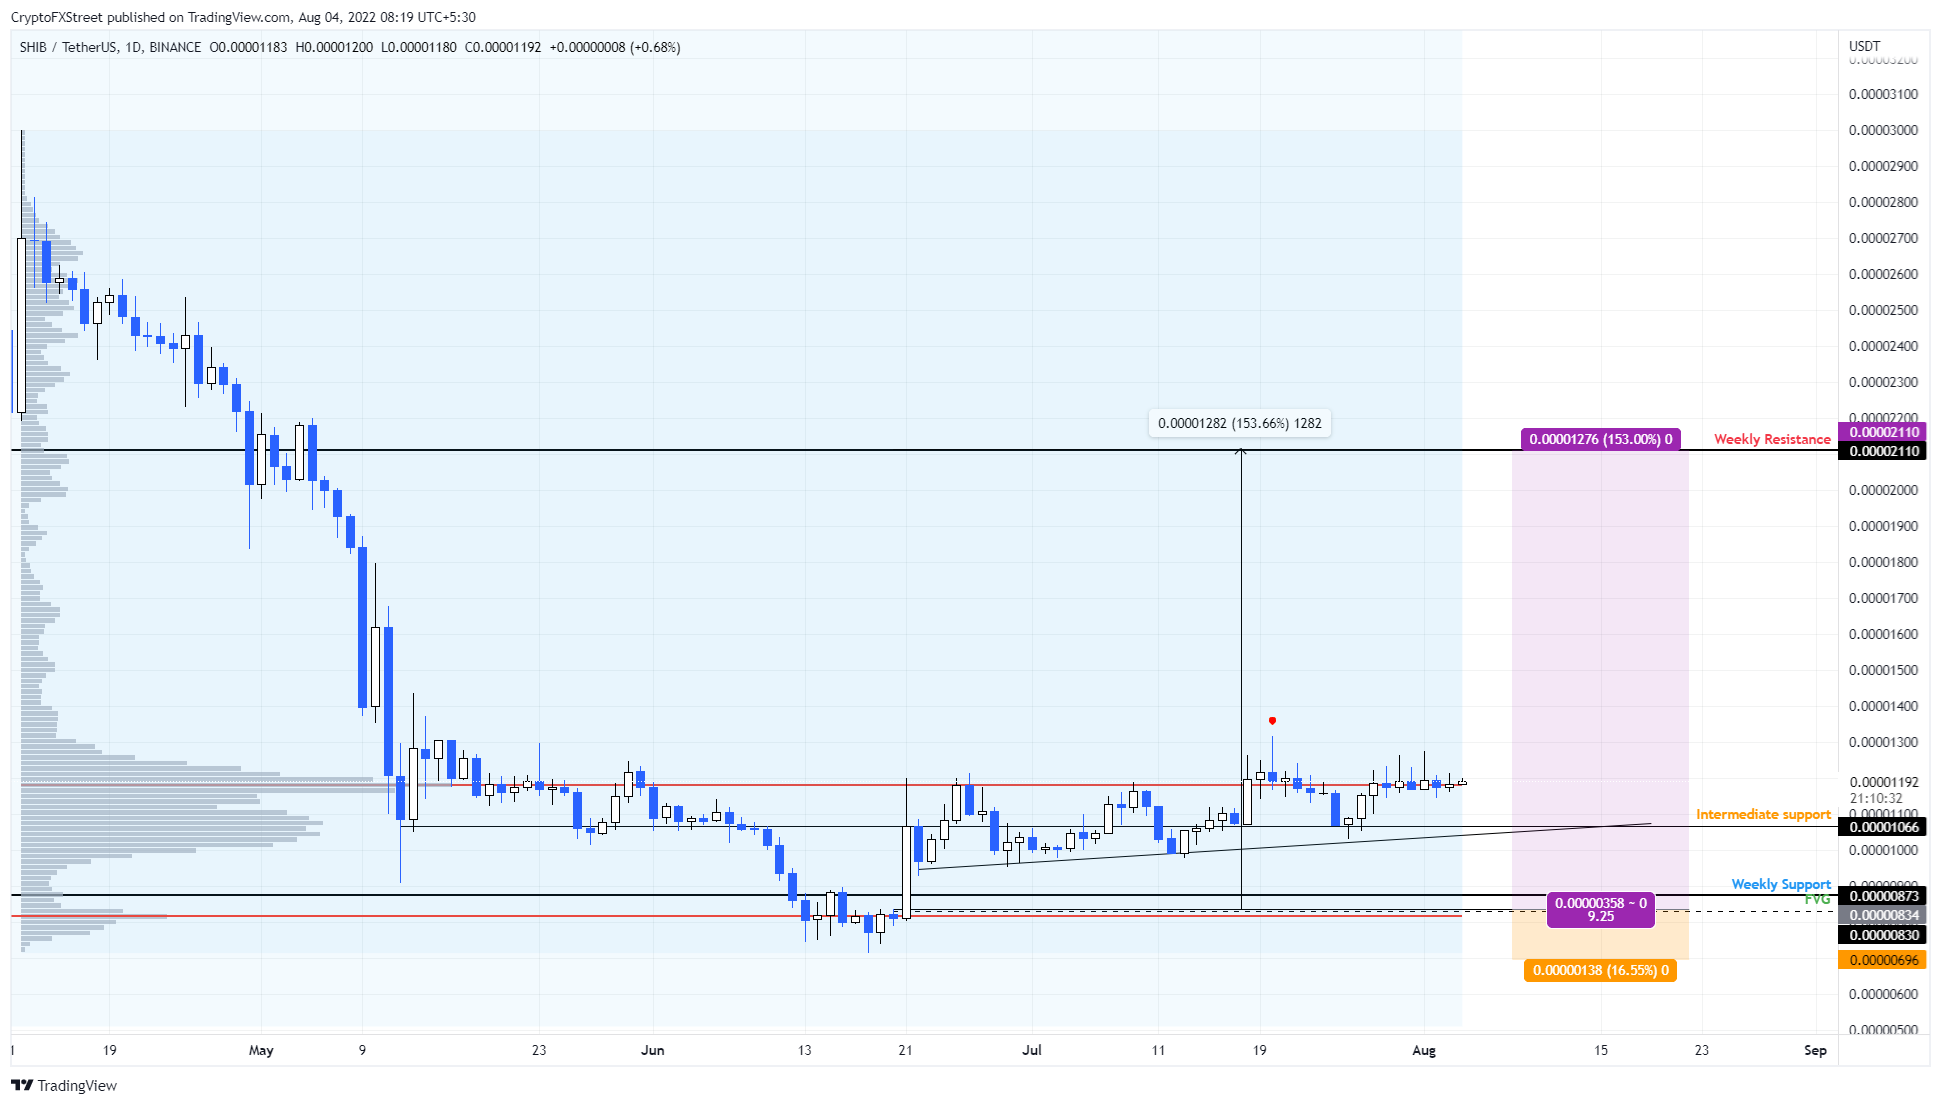
SHIB/USDT 1-day chart
While things might be looking up for Shiba Inu price due to its position above the POC at $0.0000118, the winds might shift, favoring the bears quickly if the Bitcoin price triggers a sell-off. Hence, investors need to be mindful of the big crypto and its directional bias.
A weekly candlestick close below $0.0000083 will invalidate the bullish thesis for Shiba Inu price and potentially trigger a crash to June 18 swing low at $0.0000071.
Author

Akash Girimath
FXStreet
Akash Girimath is a Mechanical Engineer interested in the chaos of the financial markets. Trying to make sense of this convoluted yet fascinating space, he switched his engineering job to become a crypto reporter and analyst.



