The Sandbox price could be setting up for a monstrous move targeting $1.00
- SAND price witnessed a 23% rally since the start of November.
- The bears have wiped 90% of the monthly gains, but the volume profile index remains sparse.
- Invalidation of the bullish thesis is a breach below $0.80.

The Sandbox price is showing eye-candy-like technicals during the second trading week of November. As price coils between two indicators, traders are speculating whether or not to jump into the market. Key levels have been defined to gauge SAND's next move.
SAND price could soar
SAND price should be on every trader's watch list in November as a very profitable opportunity could arise. SAND, the Ethereum-based virtual world token, witnessed a 23% rally to kick off the month. After the impressive rise, the bears stepped in and wiped out 90% of November's gains. Still, there are subtle cues within the technicals hinting that the uptrend will eventually continue.
SAND price currently auctions at $0.84 as the bulls and bears wrestle between the 8-day exponential and 21-day simple moving averages. The coiling effect of the moving averages around the price signals a big move is coming. If the move is bullish, the SAND price could rally towards $1.00 and potentially the $1.06 congestion zone.
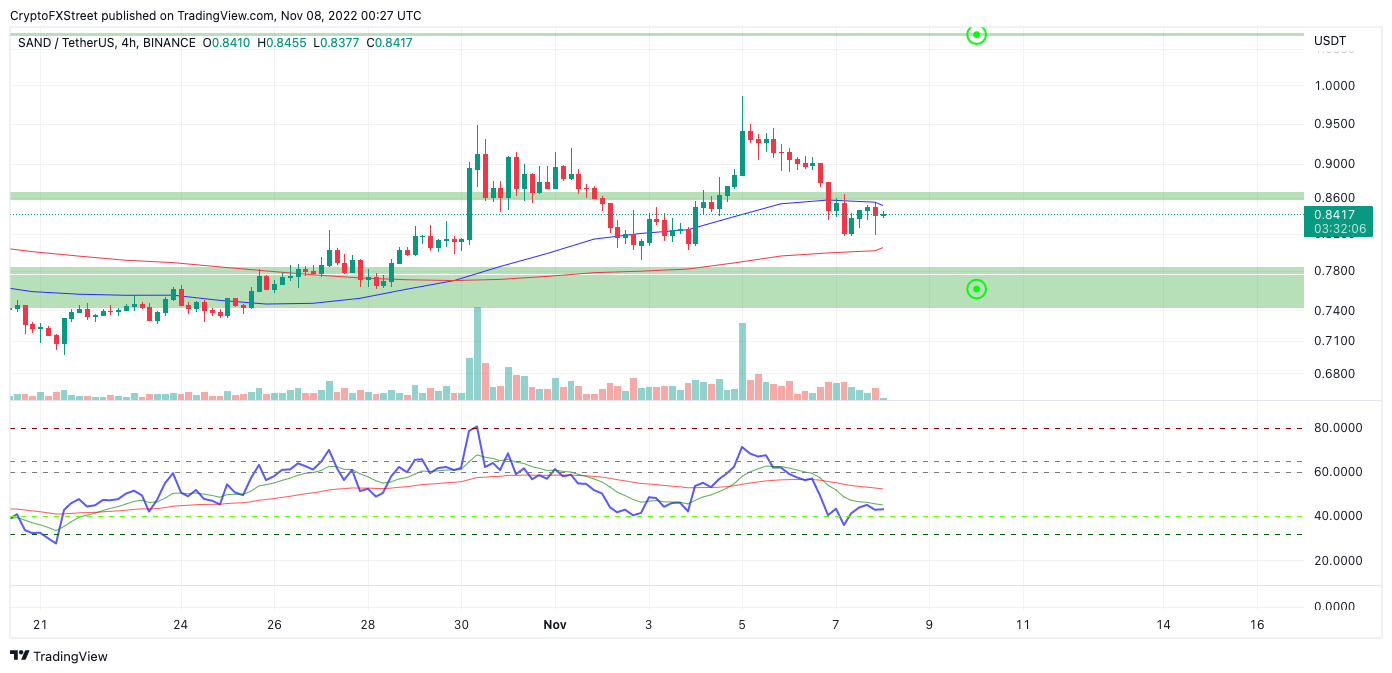
SANDUSDT 4-Hour Chart
The Volume Profile Index is lenient towards a bullish bias as the current downtrend has been ongoing with less volume than the previous rally. Additionally, the Relative Strength Index is back within bounds of a healthy uptrend after breaching extremely over-bought conditions earlier in the month.
Invalidation of the bullish thesis could occur if the bears breach the liquidity under $0.80. A sellers' frenzy could occur in doing so, targeting the $0.74 liquidity zone. Such a move would result in a 10% decline from the current SAND price.
In the following video, our analysts deep dive into the price action of Bitcoin, analyzing key levels of interest in the market. -FXStreet Team
Author

Tony M.
FXStreet Contributor
Tony Montpeirous began investing in cryptocurrencies in 2017. His trading style incorporates Elliot Wave, Auction Market Theory, Fibonacci and price action as the cornerstone of his technical analysis.


