The Graph Price Prediction: GRT price on the verge of a 65% breakout
- The Graph price hints at a 65% upswing as it nears the apex of a bull pennant.
- GRT needs to slice through a crucial supply barrier at $2.45 to kick start the new uptrend.
- A bearish scenario will come into play if this cryptocurrency slices through the 50 four-hour moving average around $2.20.

The Graph price has been consolidating in a bull pennant for almost ten days, waiting to establish a clear trend. As GRT squeezes within this technical formation, the chances increase for a volatile breakout soon.
The Graph price prepares for an explosive breakout
The Graph price saw a 190% uptrend between February 10 and February 12, which took it from $0.98 to a new all-time high of $2.86.
Since then, GRT has been consolidating in a bull pennant pattern before the next leg up.
The parabolic advance to $2.86 formed the “flagpole,” while the ongoing sideways trend is creating the “pennant.” This technical formation is considered a continuation pattern, and the target is measured by adding the length of the flag pole to the breakout point.
Slicing through the pennant’s upper trendline at $2.45 could see the Graph price surge by 65.45%. If this were to happen, GRT would likely test the 161.8% Fibonacci retracement level at $4.
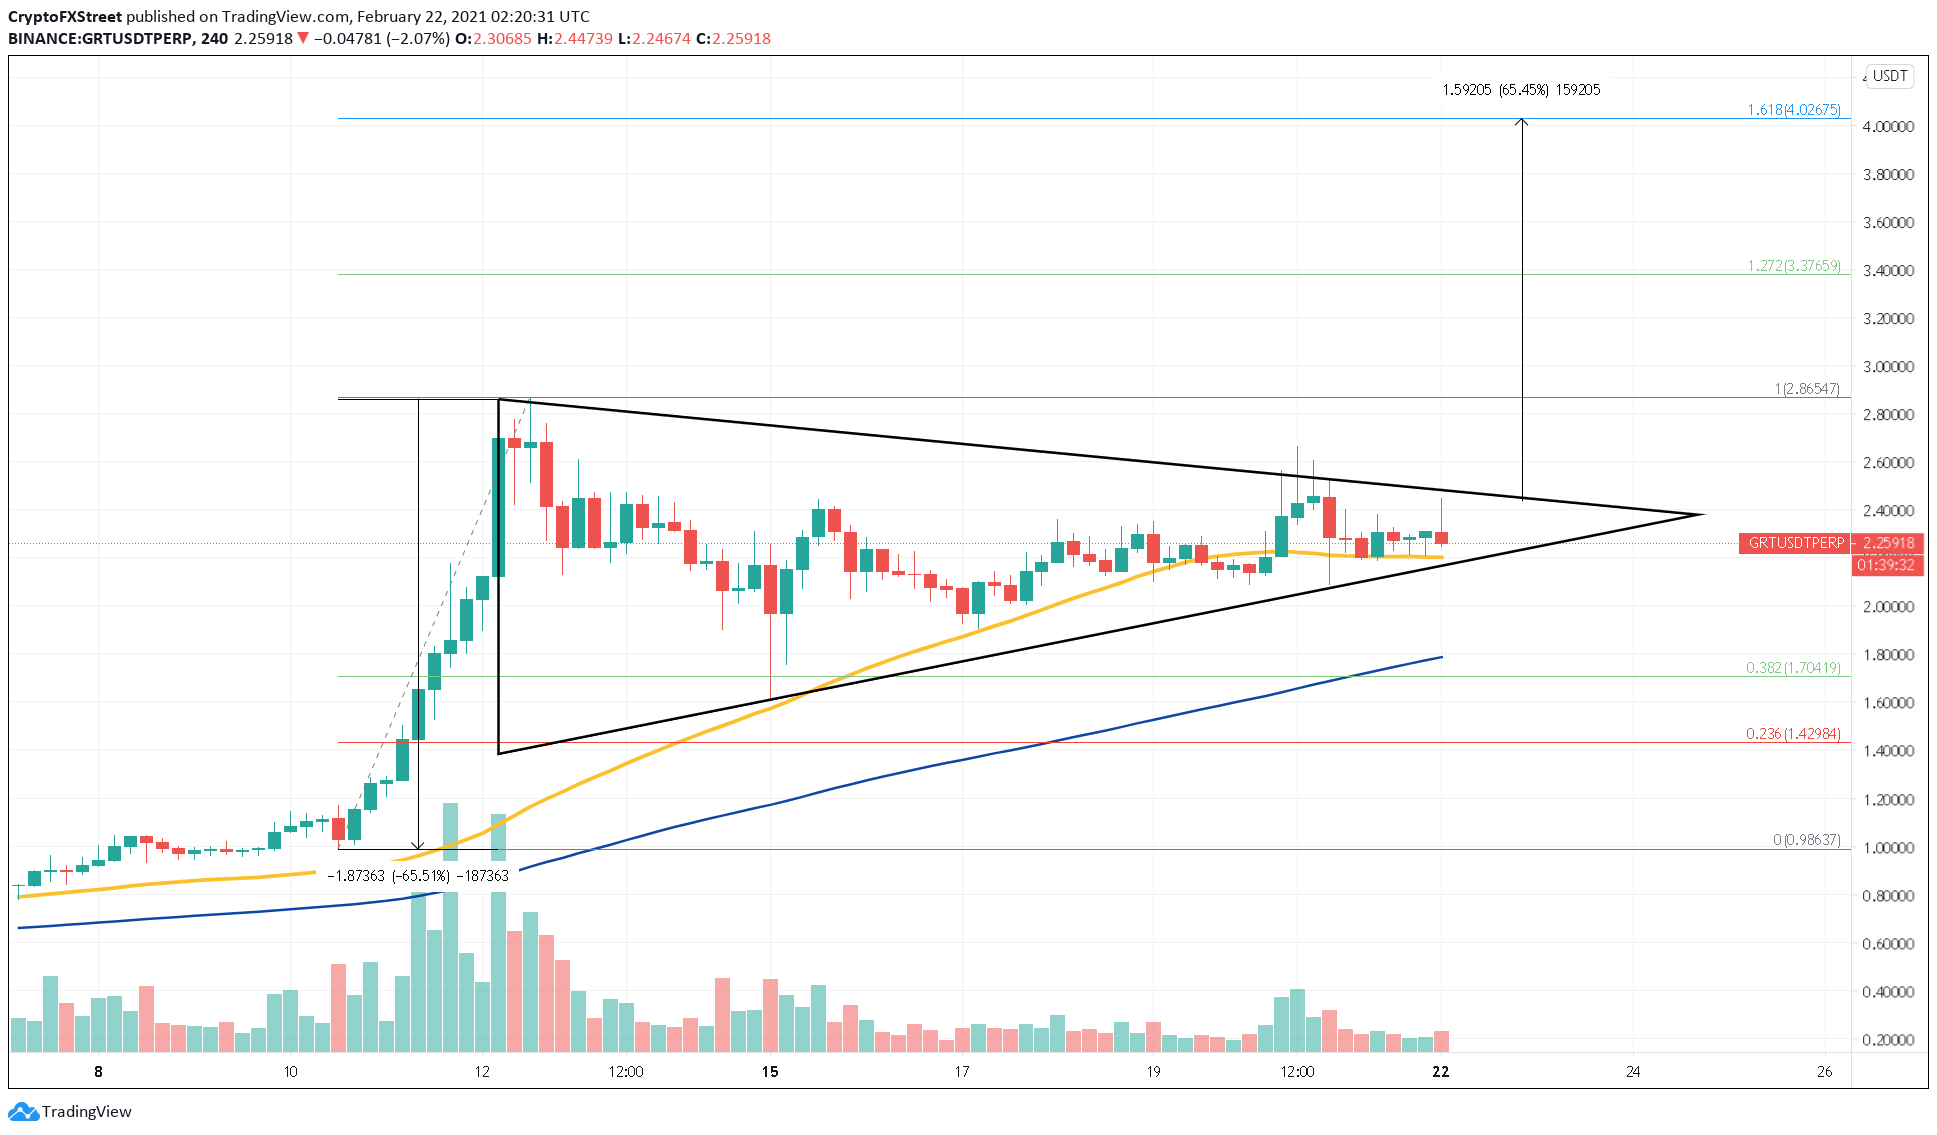
GRT/USDT 4-hour chart
It is worth noting that the Graph price must hold above the 50 four-hour moving average for the bullish outlook to remain intact.
Failing to do so could be catastrophic for the bulls as it would lead to a steep correction.
Indeed, a spike in selling pressure that sends GRT below $2.20 might be followed by a pullback to the 100 four-hour moving average at $1.78 or the 38.2% Fibonacci retracement level at $1.70.
Author

Akash Girimath
FXStreet
Akash Girimath is a Mechanical Engineer interested in the chaos of the financial markets. Trying to make sense of this convoluted yet fascinating space, he switched his engineering job to become a crypto reporter and analyst.


