The Graph Price Prediction: GRT looks north towards $3 amid healthy support levels
- The Graph steadies after Saturday’s wild swings.
- The token trends in a symmetrical triangle on the 4H chart.
- The path of least resistance appears to the upside.

GRT/USD is trading in a narrow range so far this Sunday, consolidating Saturday’s good two-way businesses while holding above the $2 mark.
The Graph drew strong bids amid a broad buying wave seen across the crypto space, as Bitcoin reached an all-time-highs above $57,000 despite the world’s richest man, Elon Musk, tweet – “BTC & ETH do seem high.”
Earlier this week, the developers of The Graph said that “it’s just a matter of time before we begin to see even more institutional investors moving into platforms focused on Web 3.0, which is an evolving set of standards (mostly open-source) that aim to support the Internet of the future.”
Web 3.0 platforms will attract the same level of interest from institutions that Bitcoin is getting at the moment, the Graph team predicted.
GRT/USD: Awaits a triangle breakout amid favorable indicators
The four-chart of the Graph shows that the price is awaiting a breakout from the symmetrical triangle formation on either side.
Although the odds of an upside break appear convincing amid a stack of healthy support levels.
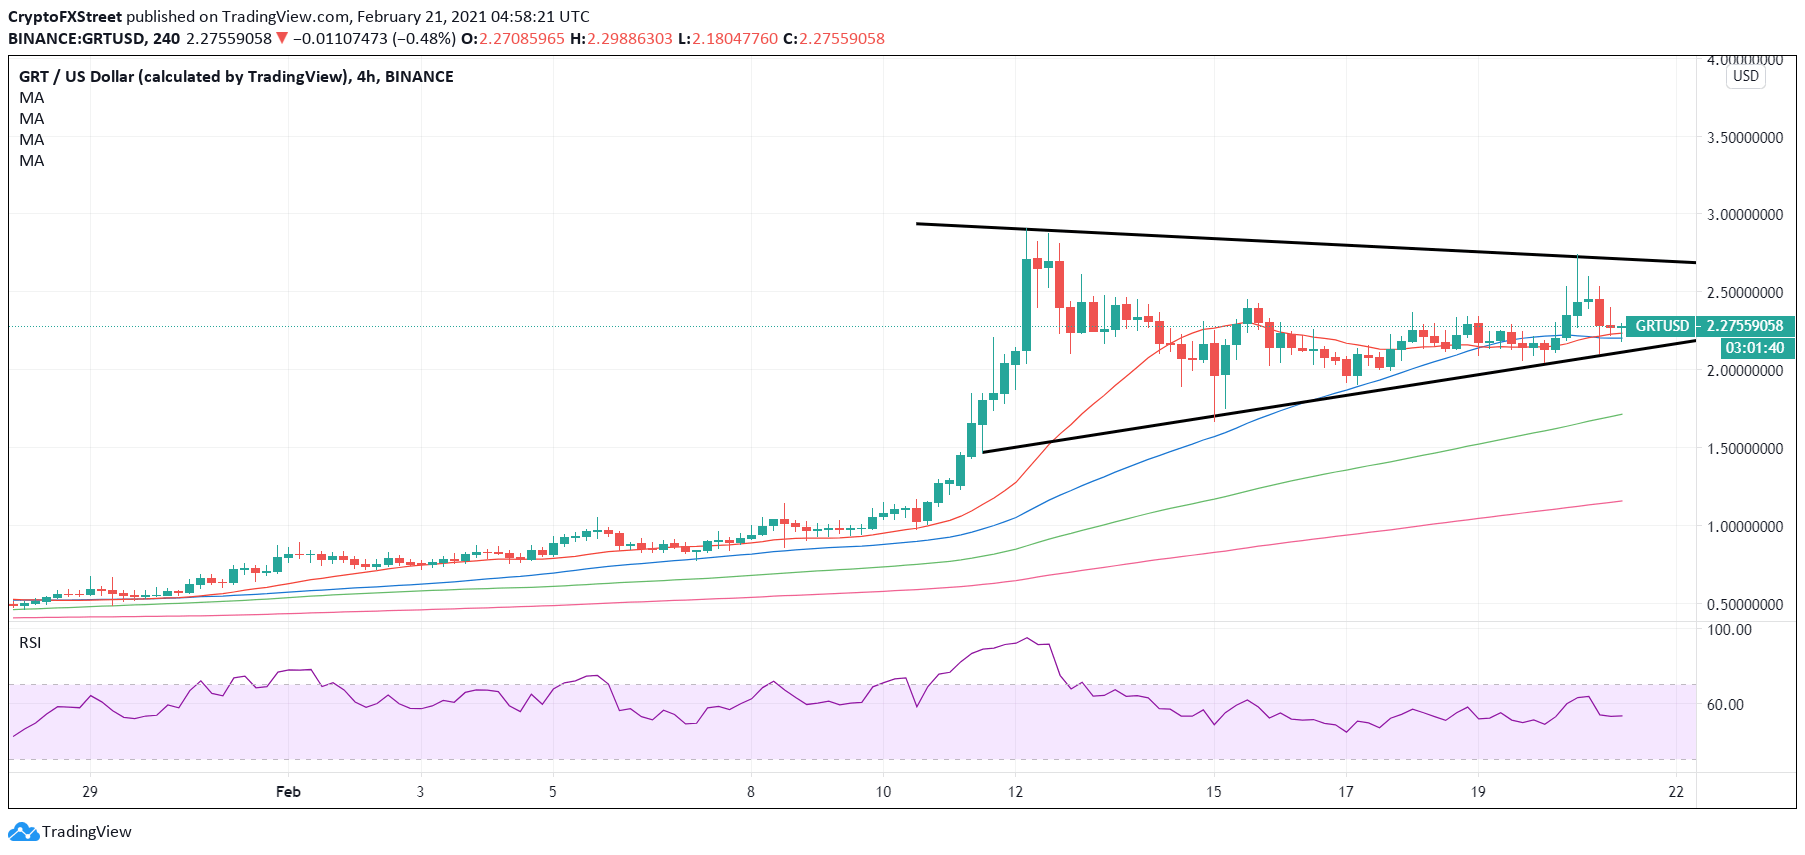
GRT/USD: Four-hour chart
The bull cross spotted in early Sunday dealing, with the 21-simle moving average (SMA) piercing the 50-SMA from below, remains supportive of the bullish bias.
GRT/USD needs to close above the falling trendline resistance at $2.70 on the four-hour candlestick to confirm a triangle breakout, opening doors for a retest of the record highs of $2.9072.
The psychological $3 level could challenge the bulls’ commitments. The relative strength index (RSI) is edging lower, as of writing, although trades above the 50 level, keeping the buyers hopeful.
Strong support around $2.20 is likely to limit the downside attempts. A sustained move below the falling trendline support at $2.11 could yield a downside break.
The next relevant cushion awaits at the rising 100-SMA at $1.7155.
Author

Dhwani Mehta
FXStreet
Residing in Mumbai (India), Dhwani is a Senior Analyst and Manager of the Asian session at FXStreet. She has over 10 years of experience in analyzing and covering the global financial markets, with specialization in Forex and commodities markets.


