The Graph’s support to four different blockchains could send GRT price to new all-time highs
- TheGraph price is contained inside a descending triangle pattern on the 4-hour chart.
- The digital asset is on the verge of a massive 22% breakout towards $2.7.
- On-chain metrics indicate that investors should buy as the platform plans to support Polkadot and Solana

TheGraph has been under consolidation since its new all-time high of $2.88, established on February 12. The digital asset is on the verge of a potential breakout as on-chain metrics show it is a fair buy territory for investors.
TheGraph foundation announced that it will be supporting several protocols including Polkadot, Solana, NEAR, and Celo. These four blockchains will join GRT in the near future. TheGraph ecosystem has grown significantly again in 2021 after a 100x growth during 2020. Eva Beylin, director at The Graph Foundation stated:
With over 8,000 subgraphs already deployed for Ethereum, IPFS and POA, we’re excited to unlock this next phase of ecosystem growth with multi-blockchain support, enabling a truly open data economy
TheGraph price will quickly jump towards $2.7
On the 4-hour chart, GRT has established a descending triangle pattern with the resistance trendline located at $2.22. A breakout above this point should push TheGraph price towards its previous all-time high at $2.88 and above as resistance ahead is fairly weak.
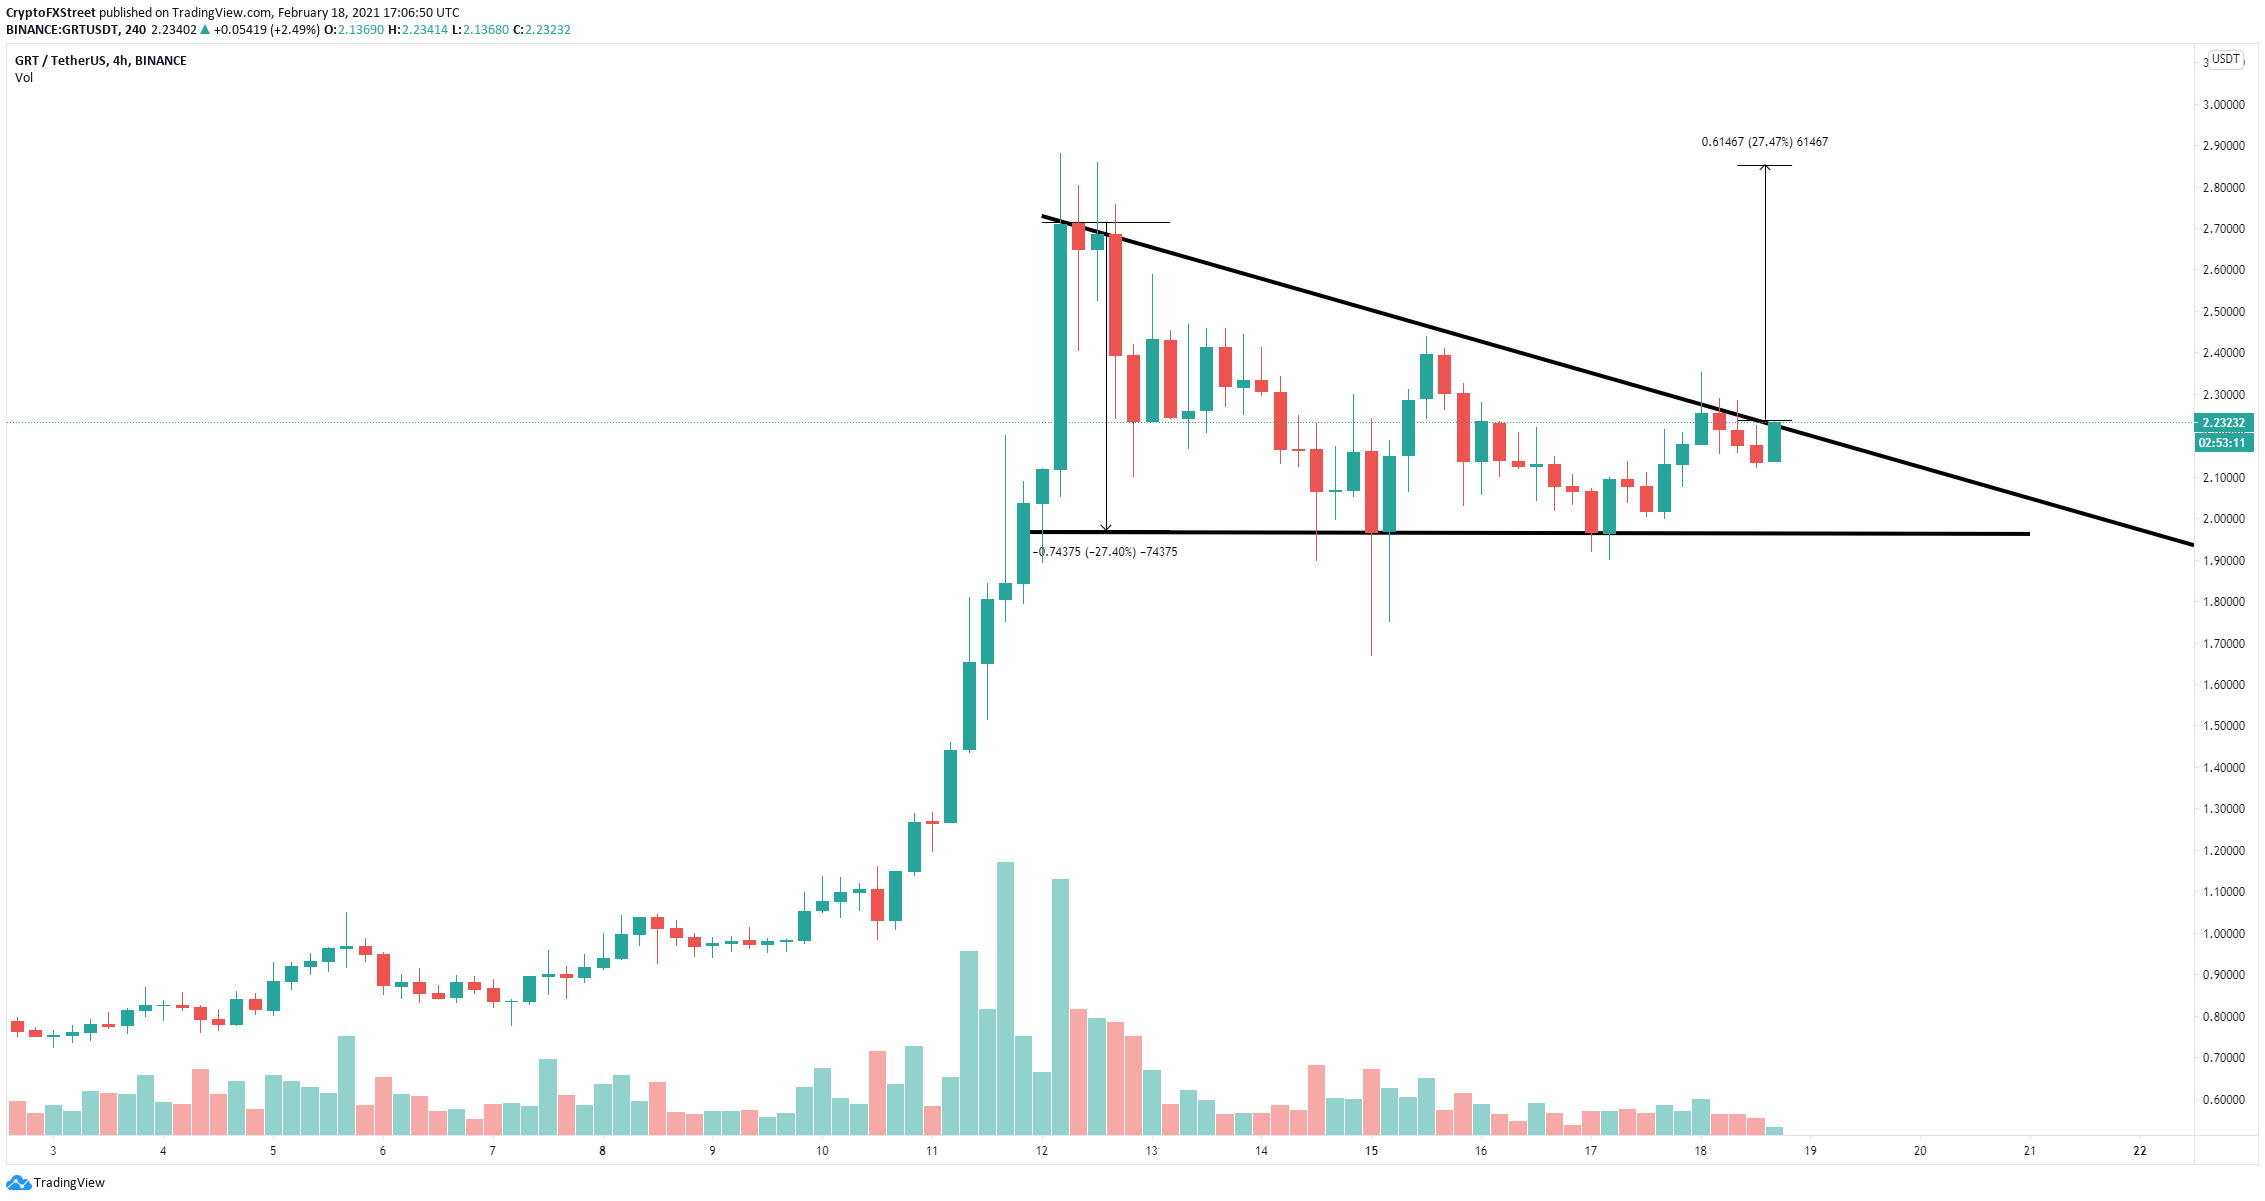
GRT/USD 4-hour chart
The MVRV (7d) is currently in the buy zone below 0%, which in the past has shown to be an accurate indicator of local bottoms. This gives more credence to the bullish outlook above.
%20[18.07.38,%2018%20Feb,%202021]-637492652232029019.png)
GRT MVRV (7d) chart
However, a rejection from the upper trendline resistance level could quickly send GRT down to the lower support boundary established at $1.96. Losing this key level will drive TheGraph price down by 27% towards $1.4.
Author

Lorenzo Stroe
Independent Analyst
Lorenzo is an experienced Technical Analyst and Content Writer who has been working in the cryptocurrency industry since 2012. He also has a passion for trading.




