The Graph Price Prediction: GRT eyes a 40% drop due to major S/R flip
- The Graph Price in dire straits as major support at $1.79 is breached, hinting at a sell-off.
- GRT could drop 40% as this flip coincides with a rejection at the parallel channel’s upper trendline.
- A bearish invalidation scenario will come into place if GRT price sees a decisive close above $2.

The Graph Price has been consolidating in a descending parallel channel pattern for almost 20 days. GRT’s recent upswing faced rejection from the channel’s upper trendline, which has resulted in a 17% drop so far.
The Graph Price eyes a lower low
Since its all-time high at $2.86, the Graph price has formed a series of lower highs and lower lows. By drawing trendlines along the swing highs and swing lows, a descending parallel channel forms.
GRT’s 47% upswing between February 28 to March 3 seems to have failed to move beyond the channel’s upper trendline. This rejection has caused a critical support barrier at $1.79 to be flipped into resistance (S/R flip). Now, the Graph Price could drop 40% as it heads towards the technical formation's lower trendline.
Adding credence to this bearish outlook is the Moving Average Convergence Divergence (MACD) indicator. The MACD’s 12 exponential moving average (EMA) shows signs of sliding below the 26 EMA, if completed, it represents a bearish crossover and signals a downtrend.
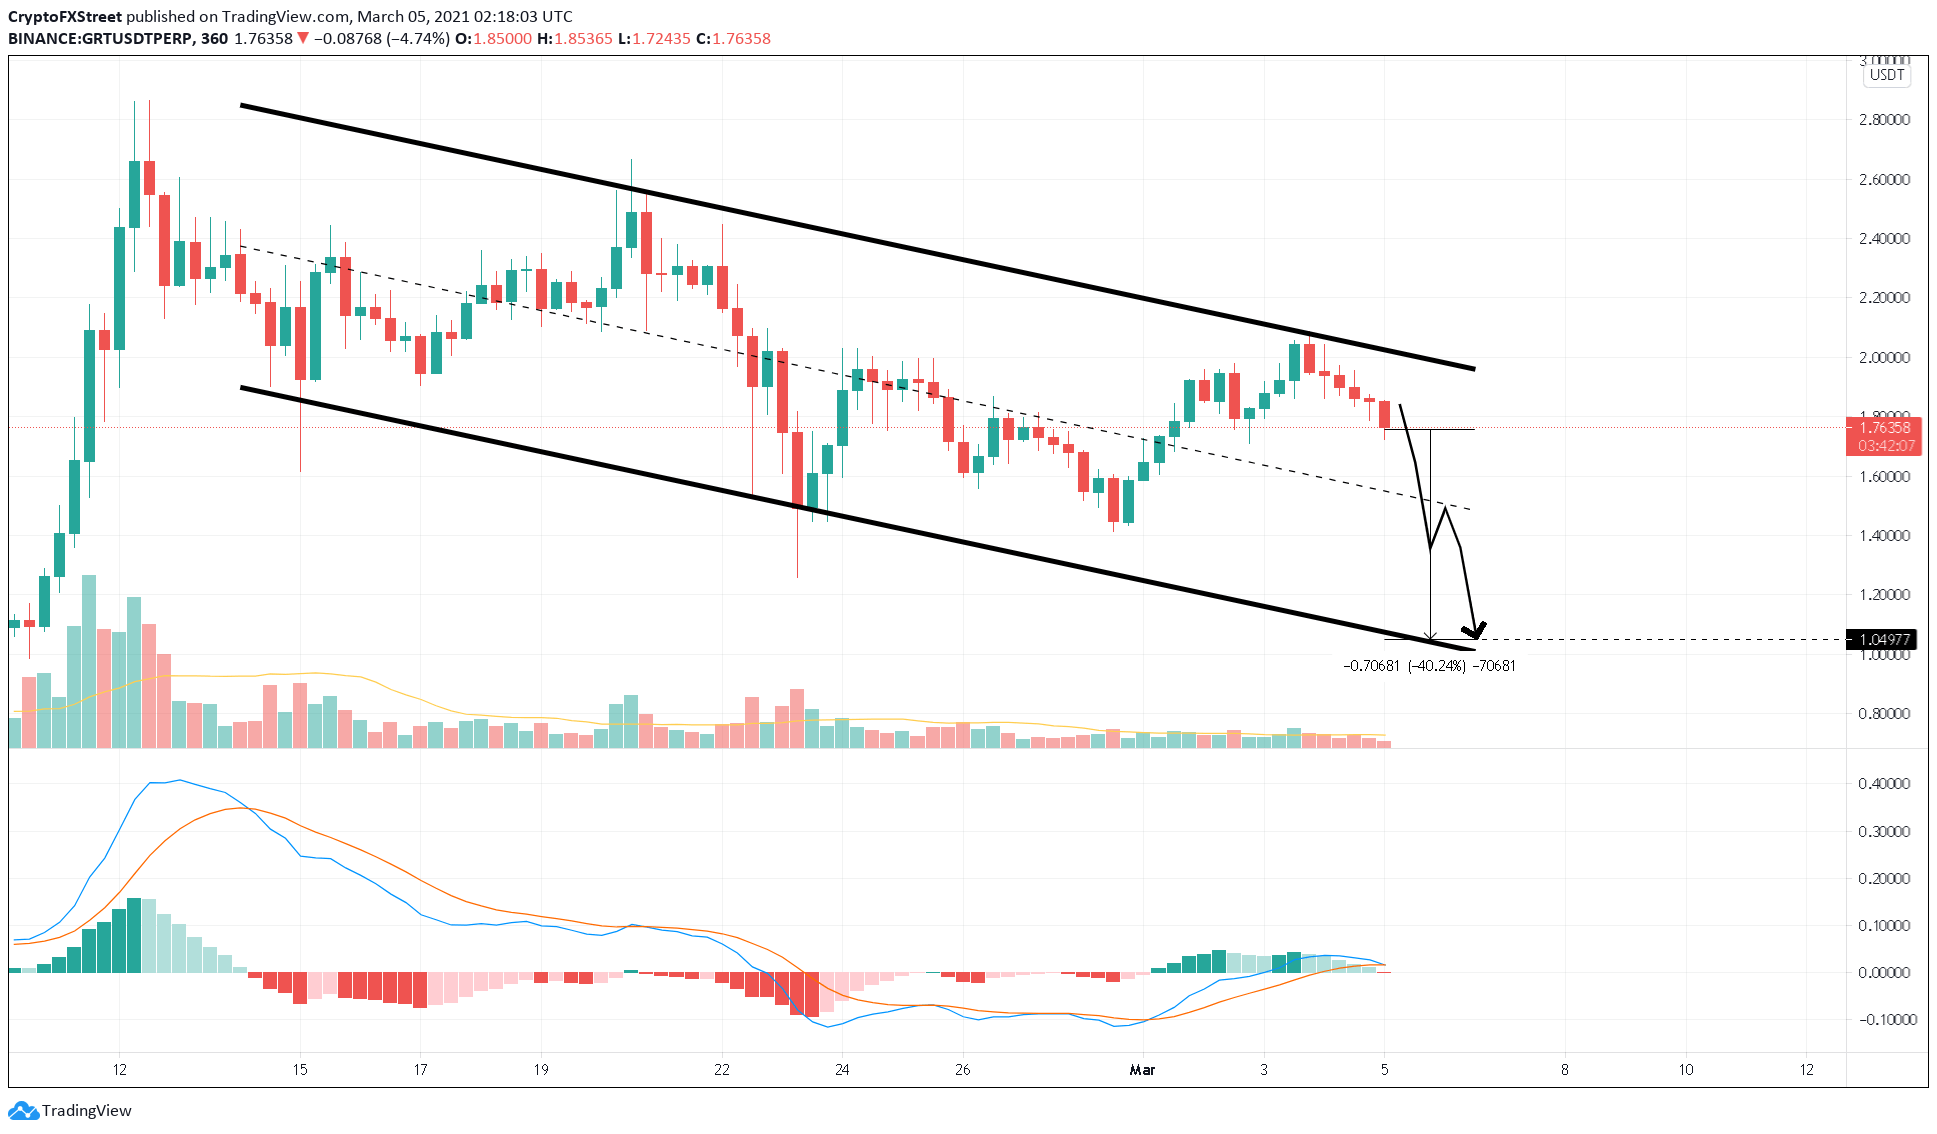
GRT/USDT 6-hour chart
Based on IntotheBlock’s In/Out of the Money Around Price (IOMAP) model, the aforementioned rejection has put 1,900 addresses holding nearly 34.38 million GRT at $1.79 "Out of the Money." Hence, any short-term buying pressure could be absorbed by these underwater investors who might want to break even.
To make matters worse, there is virtually no demand barrier beyond $1.69. IOMAP cohorts show that roughly 560 addresses hold nearly 5.76 million GRT here. Hence, a six-hour candlestick close below this level could spell disaster for the Graph price.
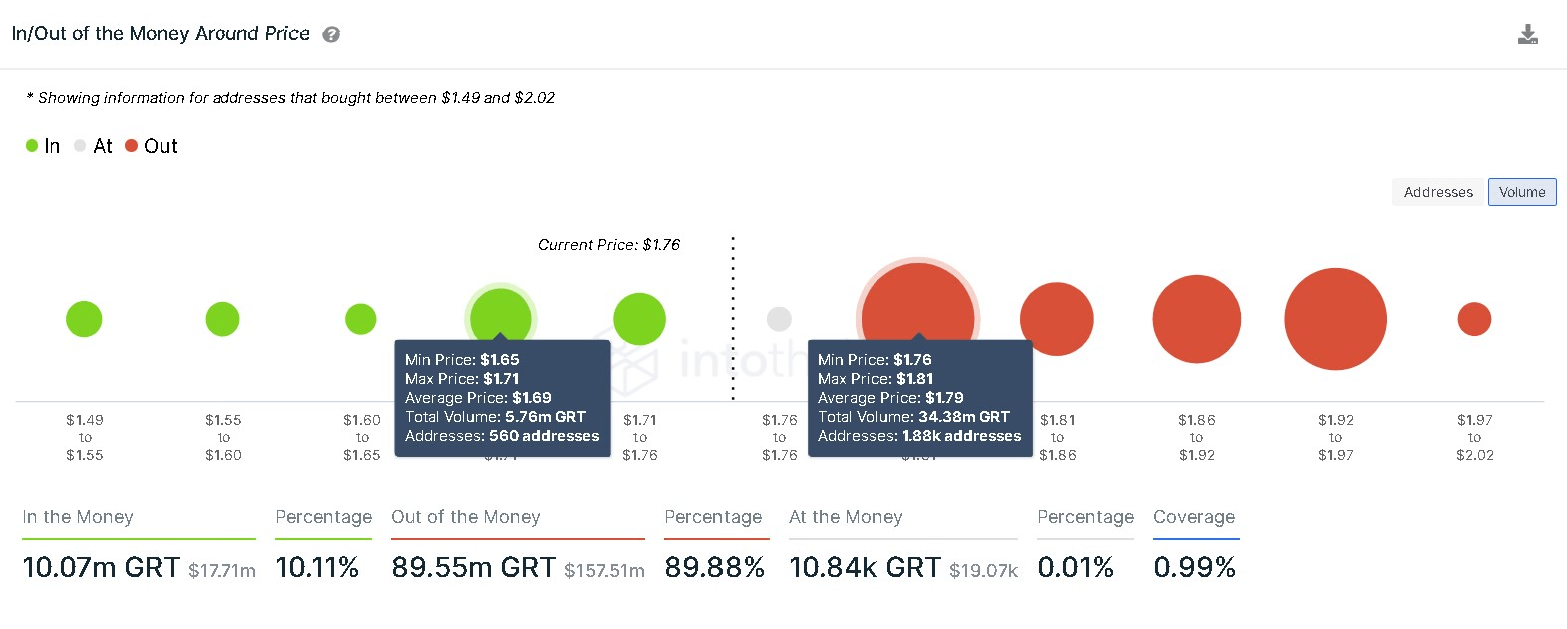
The Graph Price IOMAP chart
On the other hand, a spike in buying pressure leading to a six-hour candlestick close above $2 will invalidate the bearish outlook. In such a case, GRT could propel 45% towards its all-time high at $2.86.
Author

Akash Girimath
FXStreet
Akash Girimath is a Mechanical Engineer interested in the chaos of the financial markets. Trying to make sense of this convoluted yet fascinating space, he switched his engineering job to become a crypto reporter and analyst.


