The Graph Price Forecast: GRT edges closer to a 50% drop from a bearish pennant pattern
- The Graph price is consolidating in a pennant pattern after dropping nearly 50% between February 20 and 23.
- A breakdown of the pennant’s lower trendline at $1.46 will trigger a sell-off to $0.68.
- The presence of a 200 four-hour moving average around the $0.68 level could deter the downswing.

The Graph price saw a 190% upswing in less than 48 hours between February 10 and 12. However, GRT bulls have failed to sustain this growth, which has resulted in a pullback. Now, the indexing protocol token is stuck in a bearish pennant pattern, hinting at a 50% drop soon.
The Graph price at a make-or-break moment
The Graph price saw its price decline from $2.66 to $1.26 between February 20 and 23. This sudden drop formed the “flag pole” of the bearish pennant. However, the consolidation that followed this was a series of lower highs and higher lows, known as a “pennant.” The bearish pennant is a continuation pattern and indicates a 50% downswing, which is the flag pole’s height added to the breakout point at $1.45. This target puts GRT at $0.68.
Adding credence to this bearish thesis is the movement of 50 four-hour moving average (MA) below the 100 four-hour MA, indicating a bearish crossover. So, if the Graph price slices through the support provided by the pennant’s lower trendline and the 200 four-hour MA at $1.46, it will confirm the breakout of the bearish pennant formation. In such a case, GRT will drop 50% to hit its intended target at $0.68.
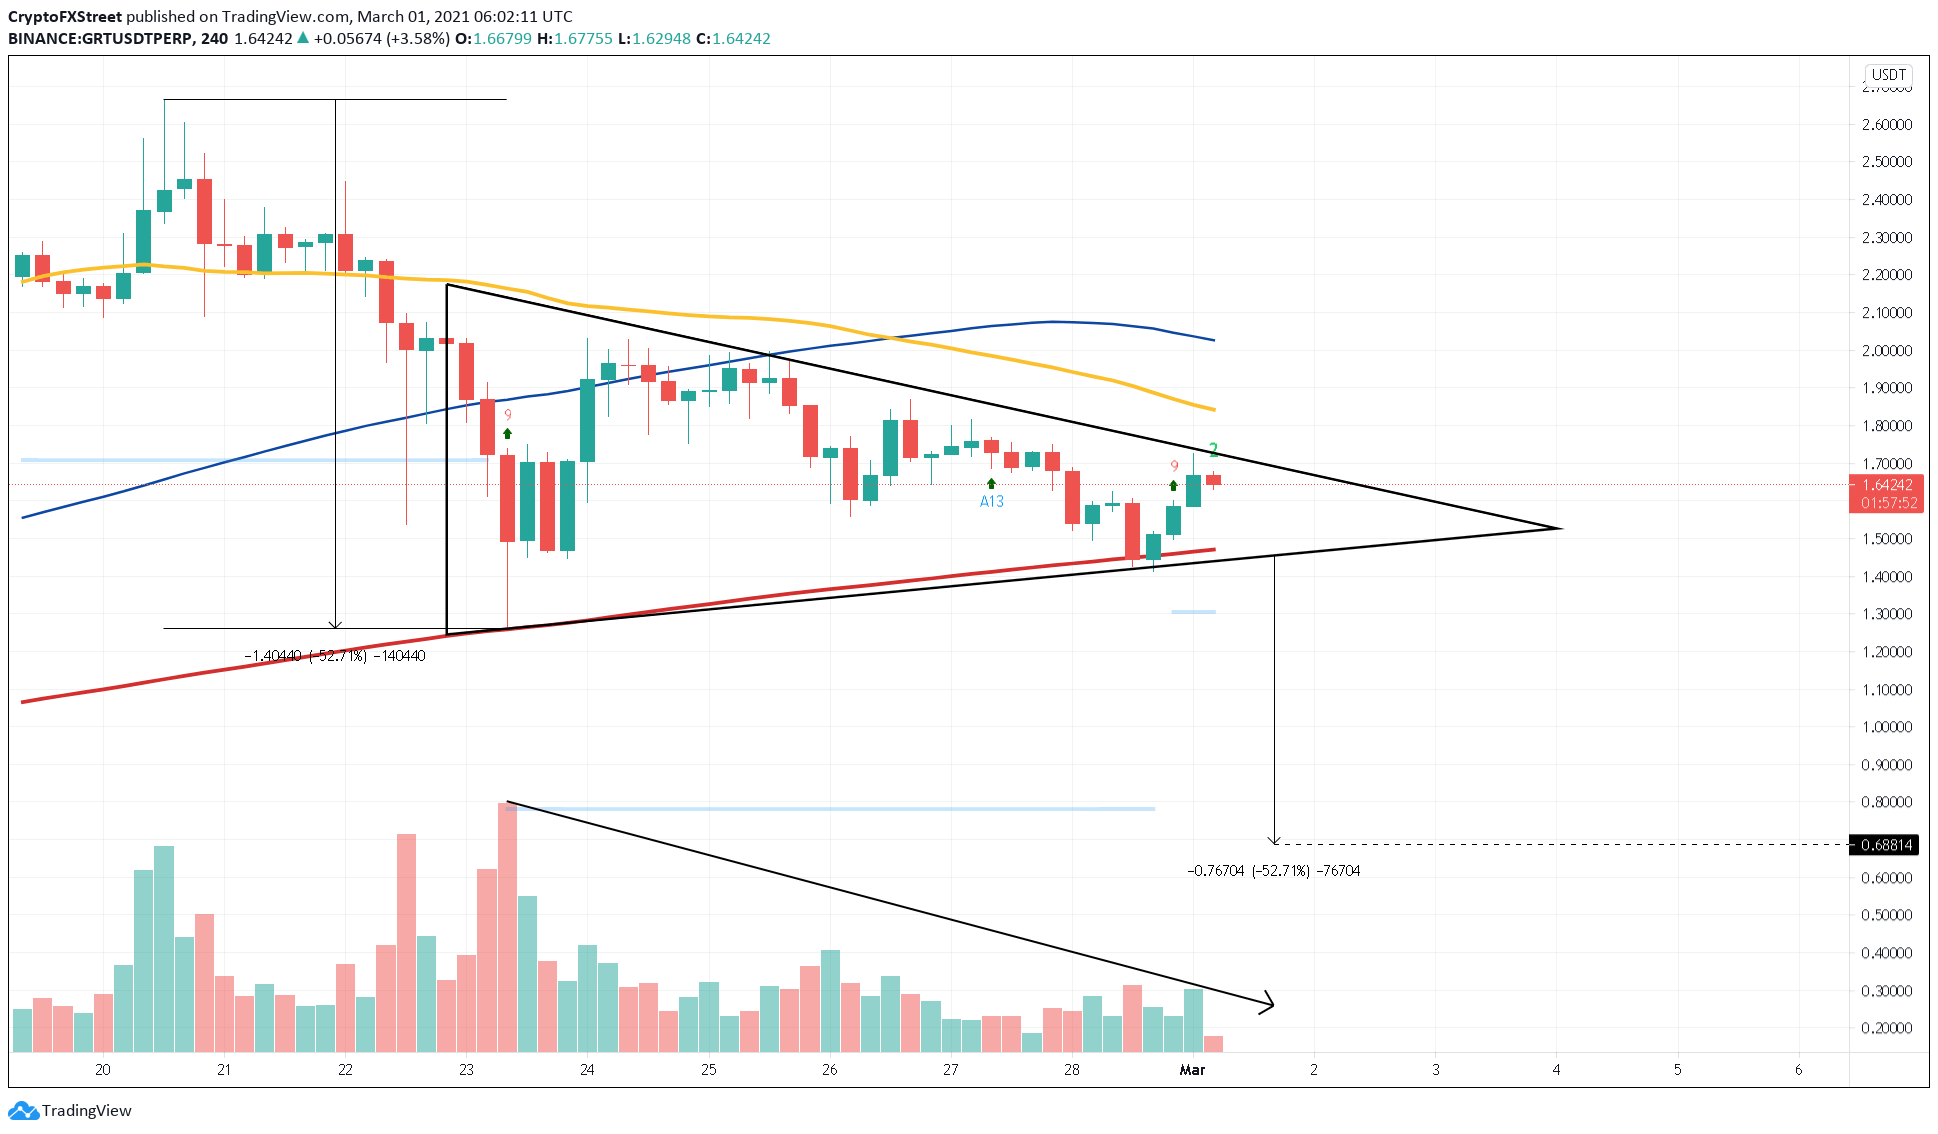
GRT/USDT 4-hour chart
However, investors need to be aware of the Tom DeMark Sequential indicator’s buy signal presented in the form of a green nine candlestick on the four-hour chart. This setup forecasts a one-to-four candlestick upswing. Therefore, if GRT pushes past the upper trendline at $1.68, it will invalidate the bearish thesis and kickstart a 19% uptrend towards the 100 four-hour MA at $2.02.
Author

Akash Girimath
FXStreet
Akash Girimath is a Mechanical Engineer interested in the chaos of the financial markets. Trying to make sense of this convoluted yet fascinating space, he switched his engineering job to become a crypto reporter and analyst.


