The Graph opened for trading on HitBTC increasing the odds for GRT price to surge by 15%
- TheGraph price is facing a strong resistance level at $2.03.
- The digital asset got listed on HitBTC in the past 24 hours.
- The number of GRT whales has significantly declined in the past week.

TheGraph price has been under consolidation since its new all-time high of $2.88 established on February 12. The digital asset now seems prepared for a new leg up, but it is facing a critical resistance barrier. HitBTC has just announced the support for GRT against two trading pairs, BTC and USDT.
TheGraph price must climb above $2.03 to shift the momentum in favor of the bulls
On the 4-hour chart, GRT has been trading inside a descending parallel channel since February 12. The digital asset faces a crucial resistance point at around $2.03 which coincides with the 50-SMA and the 100-SMA.
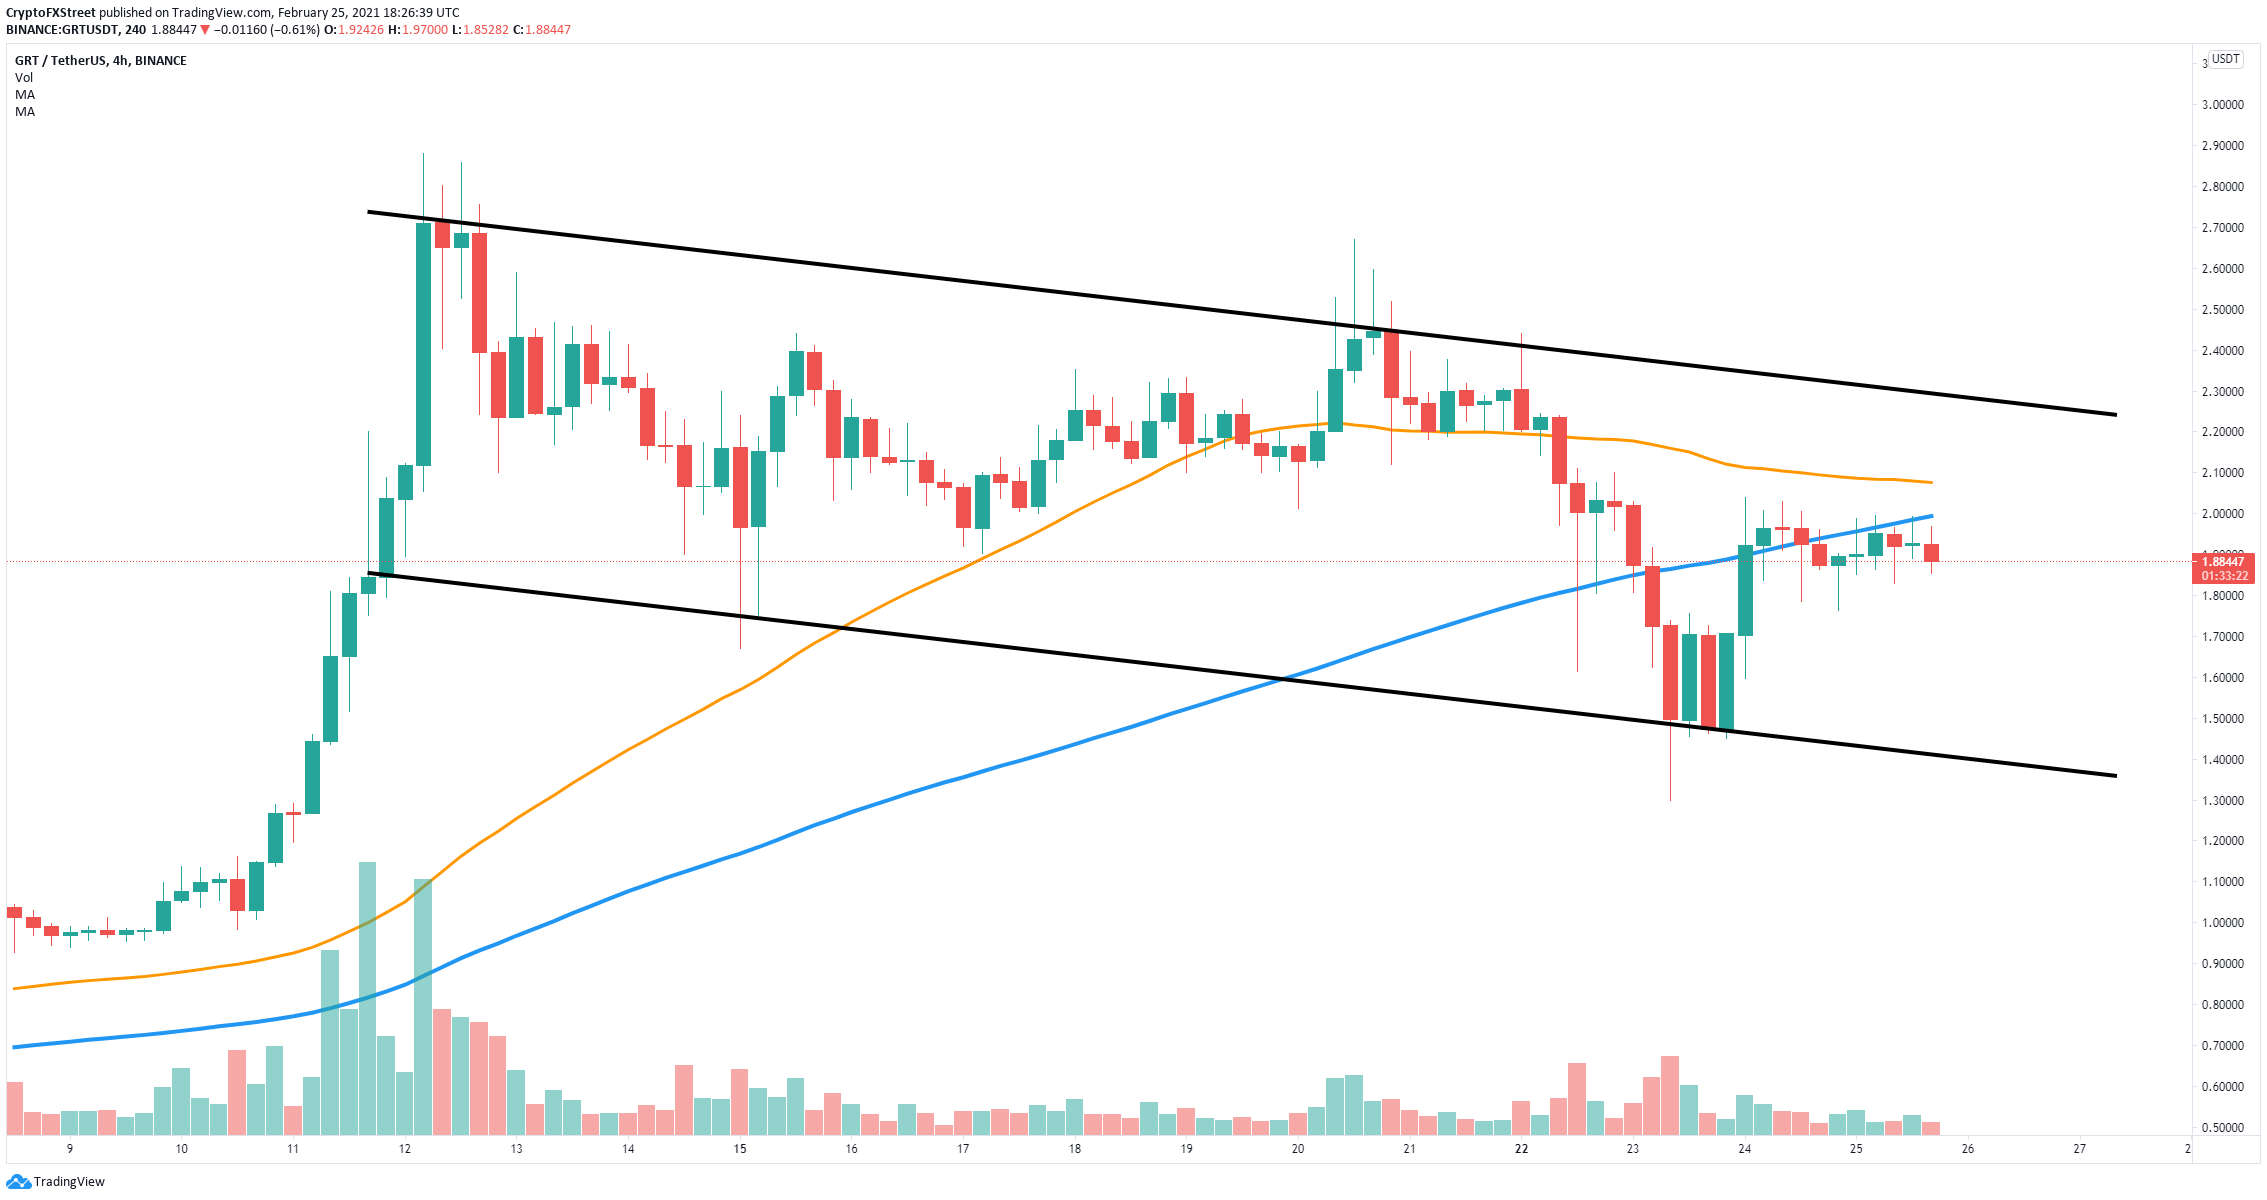
GRT/USD 4-hour chart
The In/Out of the Money Around Price (IOMAP) chart indicates that the strongest resistance area is located between $2 and $2.05 which perfectly coincides with the 50-SMA and the 100-SMAs.
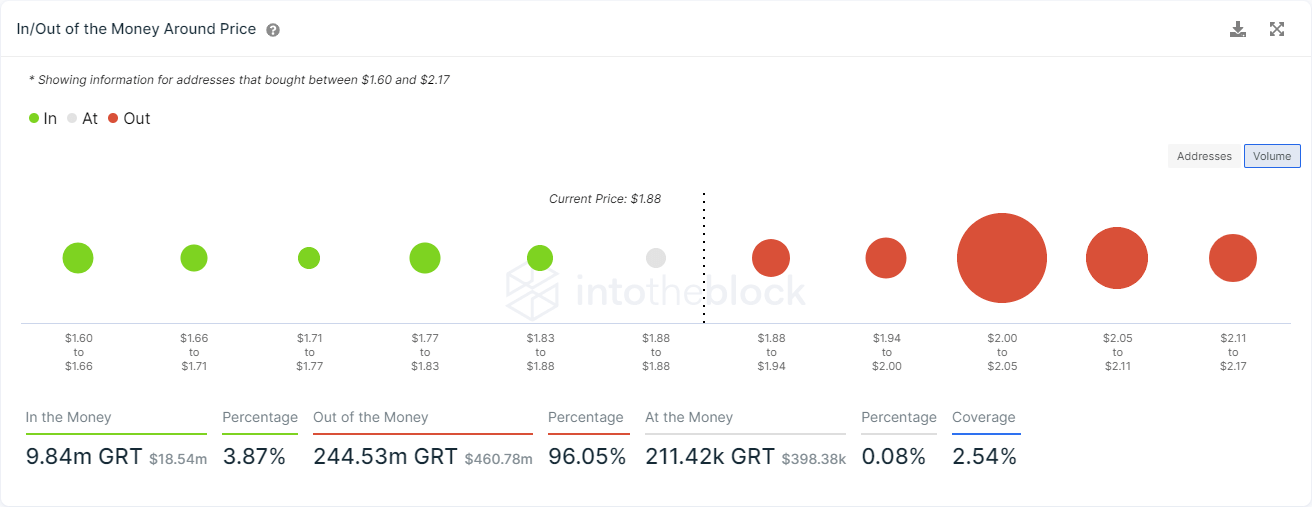
GRT IOMAP chart
A breakout above this point should be able to push TheGraph price towards the upper boundary of the pattern at $2.3. Bulls seem to have the upper hand after the most recent listing of GRT on HitBTC. However, a rejection from this level would be notably bearish.
%20[18.32.04,%2025%20Feb,%202021]-637498743720061866.png)
GRT Holders Distribution
When it comes to the number of whales holding GRT, things aren’t looking so good for the bulls. Since February 16, about six large holders with at least 10,000,000 coins have exited the network or at least partially sold their holdings.
Additionally, the IOMAP model also shows extremely weak support below $1.88 which means that a breakdown from this point could send TheGraph price down to the lower boundary of the channel at $1.4.
Author

Lorenzo Stroe
Independent Analyst
Lorenzo is an experienced Technical Analyst and Content Writer who has been working in the cryptocurrency industry since 2012. He also has a passion for trading.


