- Tezos price is bounded inside a descending wedge on the daily chart.
- Several indicators have turned bearish for XTZ showing it’s poised for a pullback.
Tezos has been trading inside a descending wedge on the daily chart since June 2020. Unlike other cryptocurrencies, Tezos hit its 2020-high of $4.49 on August 13 and has been consolidating since then.
Tezos price faces strong selling pressure in the short-term
XTZ price is not close to a breakout or breakdown of the descending wedge formed on the daily chart. However, the bulls have lost the 100-SMA and 50-SMA support levels as Tezos price is trading in the middle of the pattern.
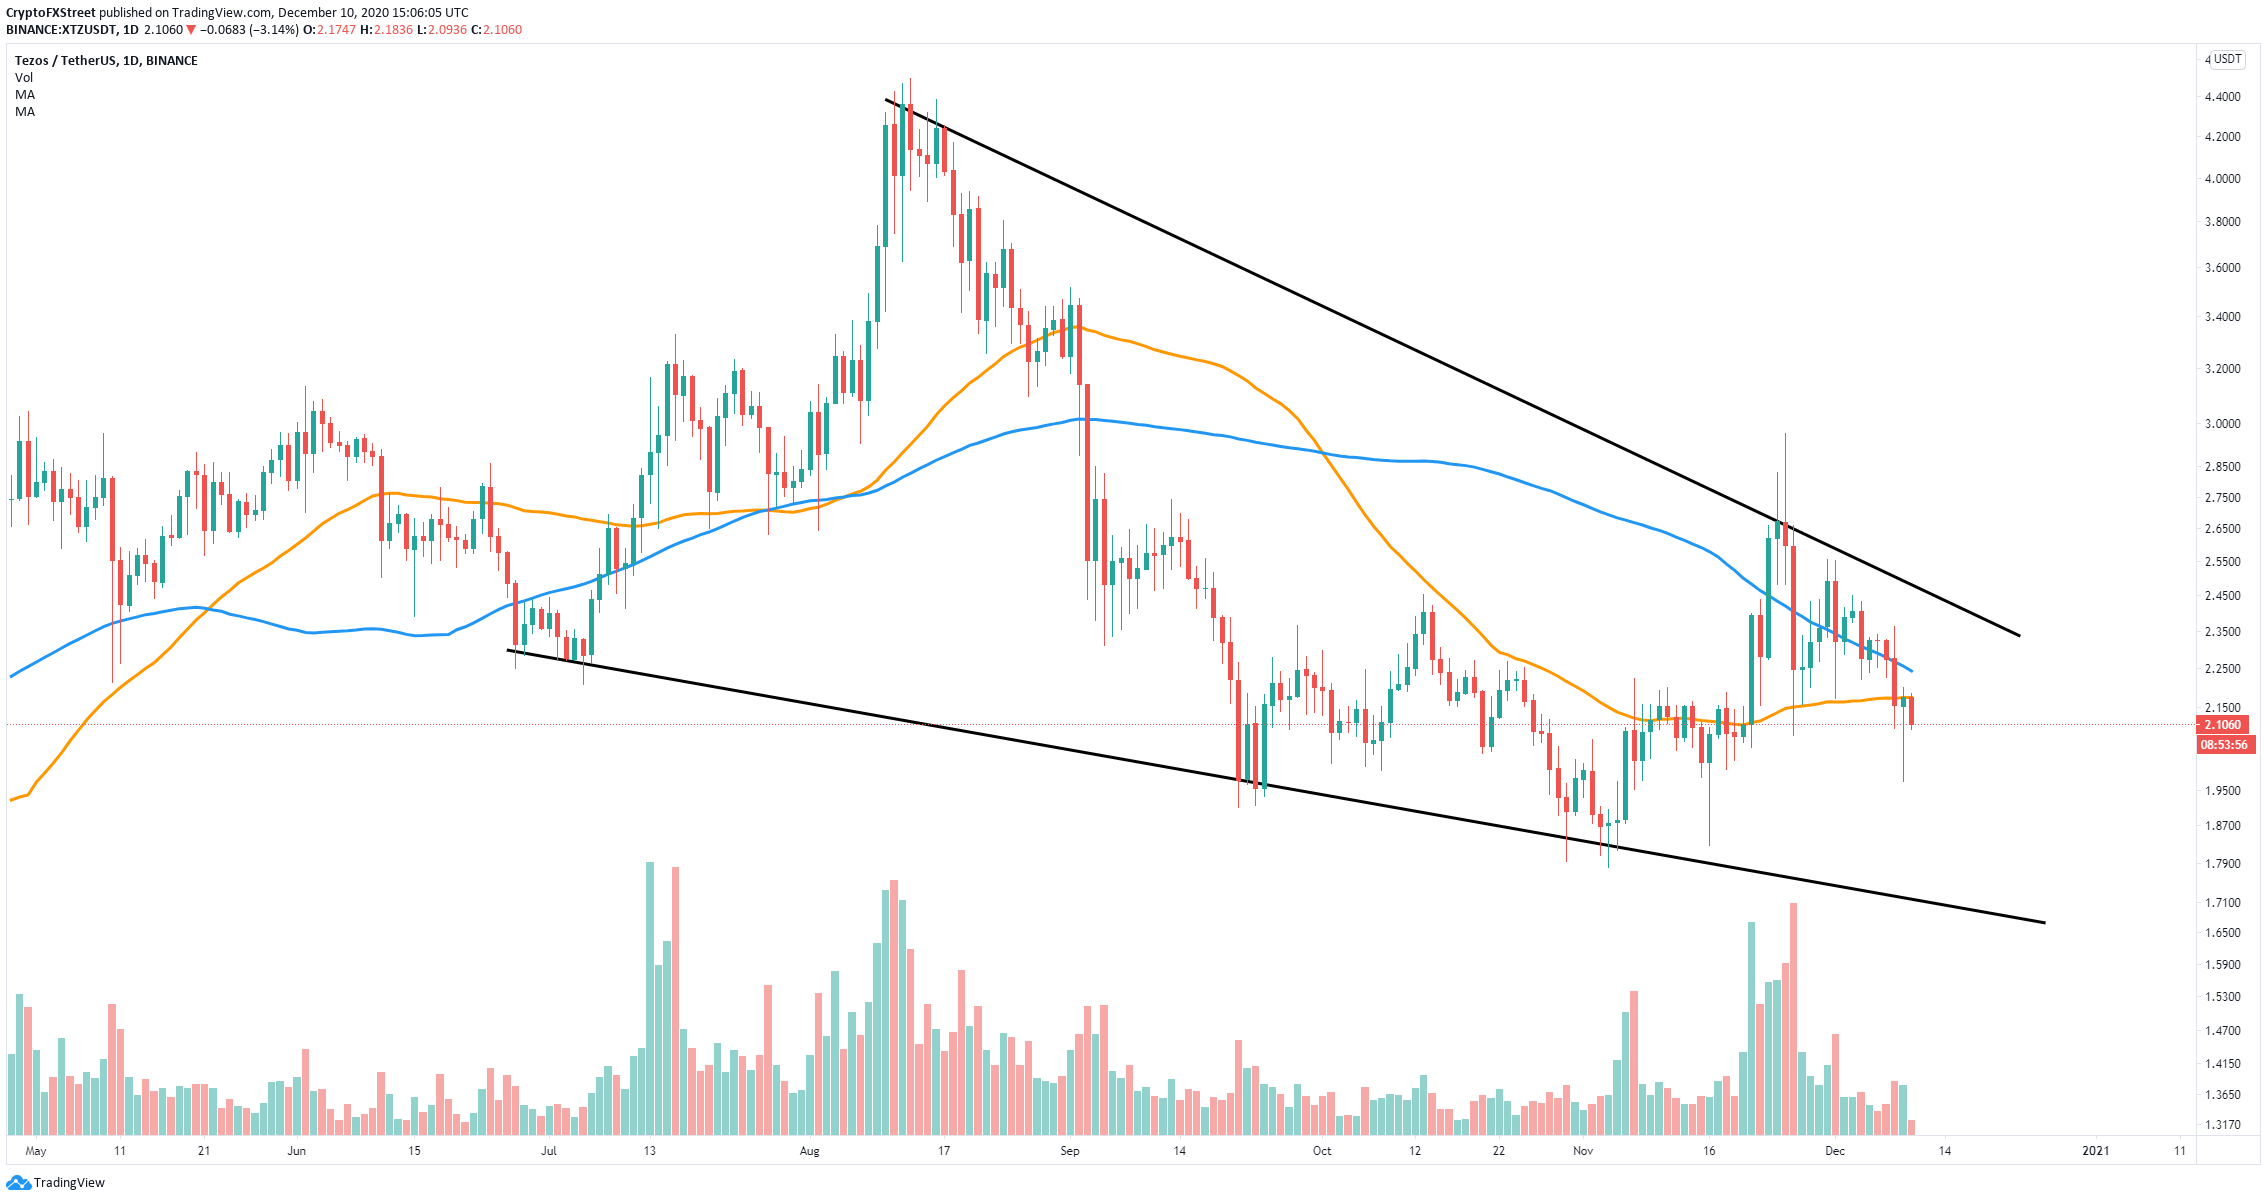
XTZ/USD daily chart
The bears seem to have the upper hand after Tezos lost both moving averages. The potential price target would be the lower trendline of the descending wedge at around $1.7 in the mid-term.
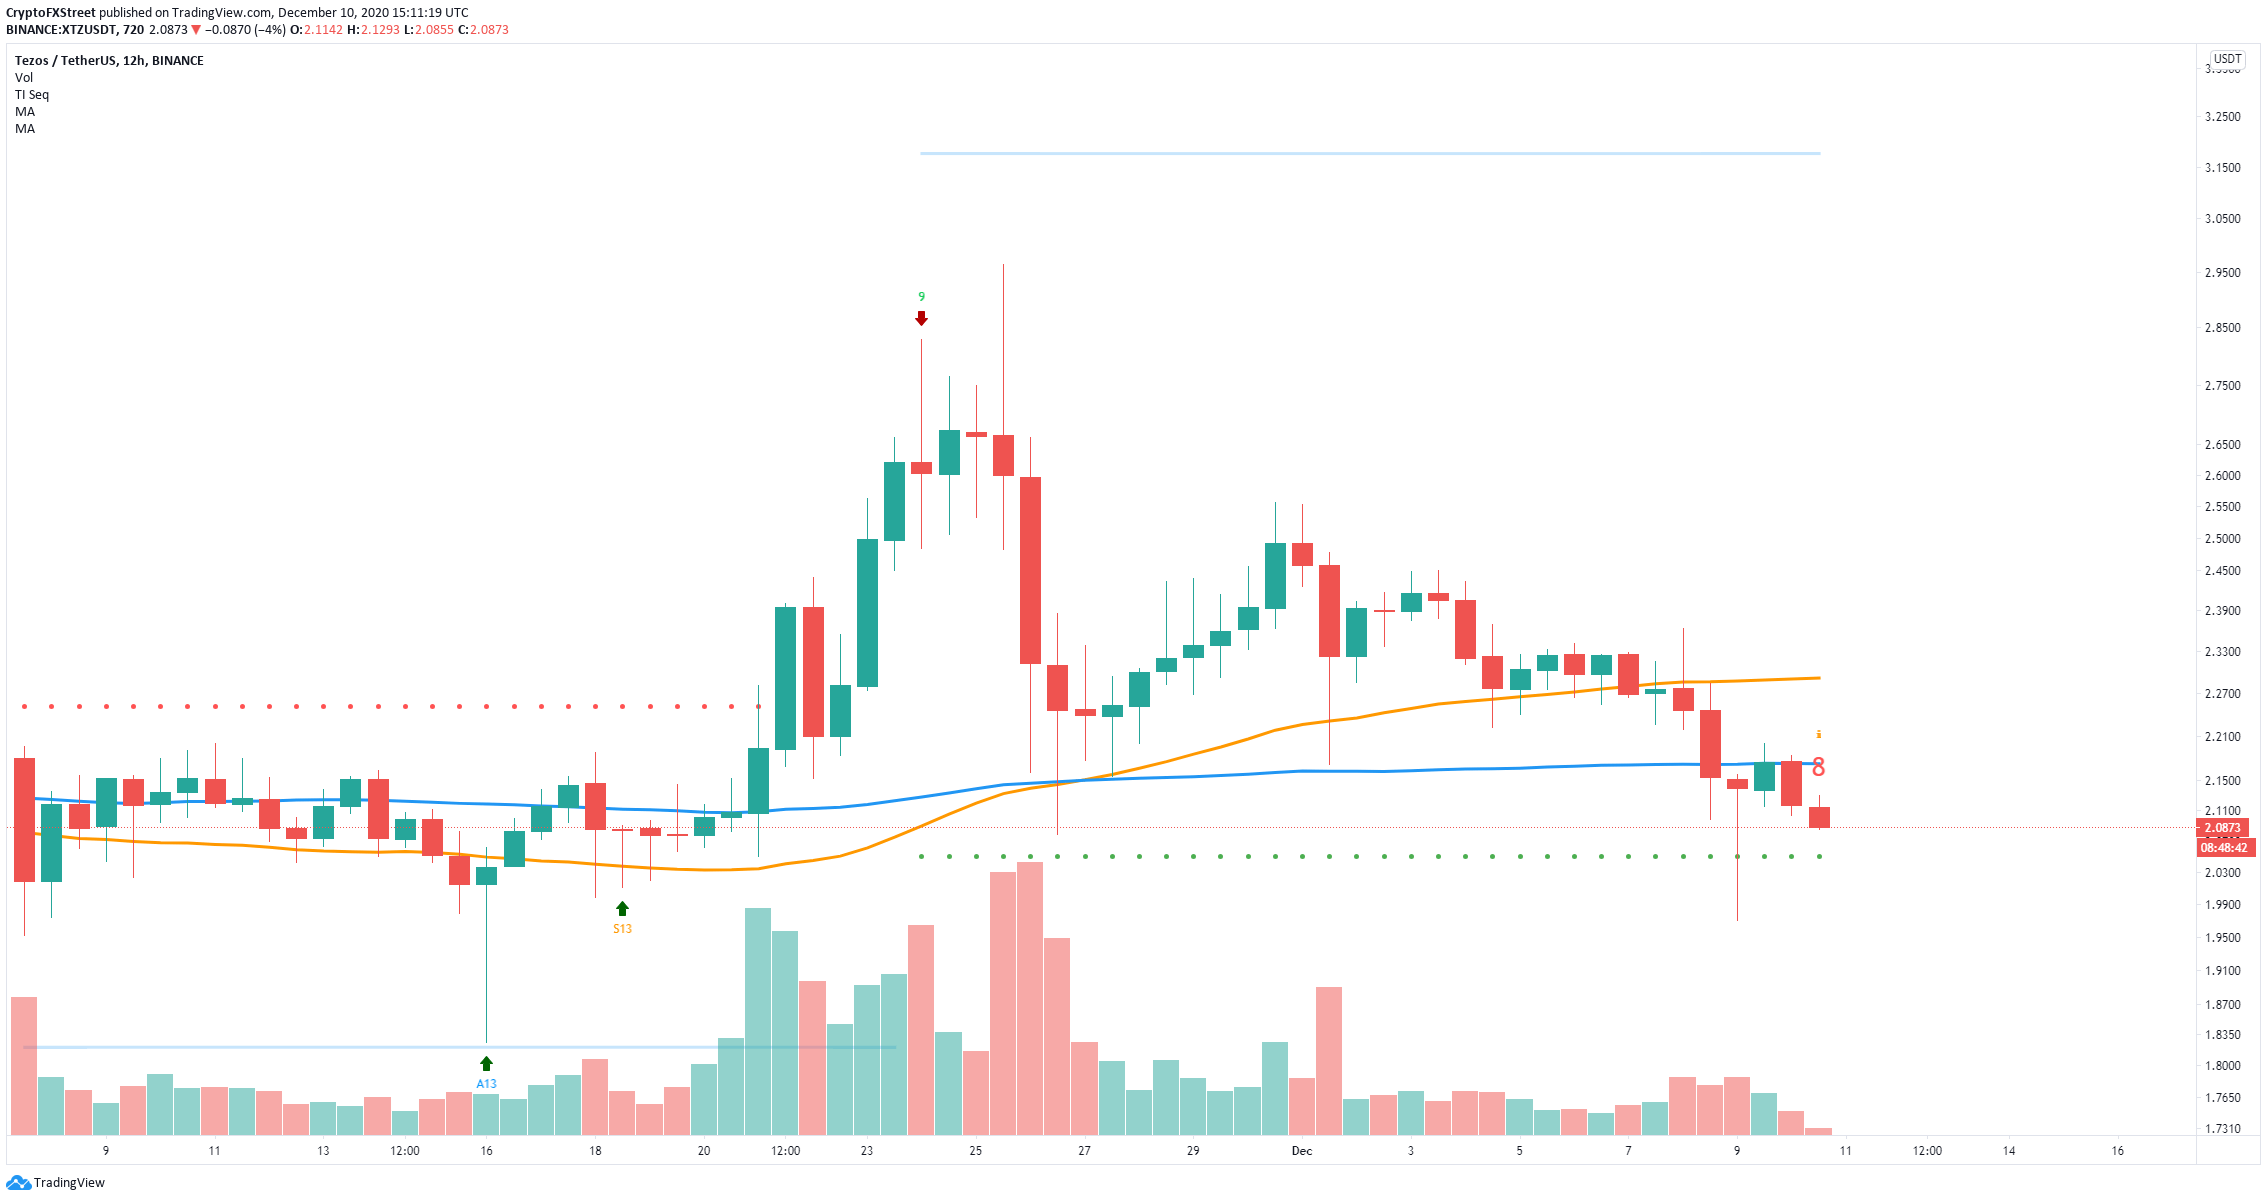
XTZ/USD 12-hour chart
However, on the 12-hour chart, the TD Sequential indicator seems to be on the verge of presenting a buy signal – in the form of a red nine candlestick – within the next 10 hours. If bulls can recover the 50-SMA and the 100-SMA as support levels on the daily chart, they could quickly push Tezos price towards the upper trendline of the descending wedge at $2.6.
Information on these pages contains forward-looking statements that involve risks and uncertainties. Markets and instruments profiled on this page are for informational purposes only and should not in any way come across as a recommendation to buy or sell in these assets. You should do your own thorough research before making any investment decisions. FXStreet does not in any way guarantee that this information is free from mistakes, errors, or material misstatements. It also does not guarantee that this information is of a timely nature. Investing in Open Markets involves a great deal of risk, including the loss of all or a portion of your investment, as well as emotional distress. All risks, losses and costs associated with investing, including total loss of principal, are your responsibility. The views and opinions expressed in this article are those of the authors and do not necessarily reflect the official policy or position of FXStreet nor its advertisers.
Latest Crypto News & Analysis
Editors’ Picks
Bitcoin: Bull rally remains strong in the long-term according to technicals
Bitcoin price has been extremely volatile in the past week. MicroStrategy has continued to accumulate even more BTC despite the fall in prices. Bitcoin's rally remains strong as the digital asset continues to defend critical support level.
Ripple needs to crack critical 21-DMA for a rally towards $0.60
XRP/USD in search of a fresh direction while ranging between 21 and 50-DMAs. The No. 7 coin forms higher highs on the 1D chart, suggesting a potential upside break. RSI trades flat at the midline, the bulls need to crack only this one barrier at $0.4905.
Cardano: Rejection at 100-HMA calls for a test of the $1 mark
Cardano (ADA/USD) extends Friday’s sell-off, as the bearish momentum picks up pace on Saturday, with deeper losses likely on the cards. The fourth most widely traded crypt currency has lost 19% of its value over the past seven trading sessions.
Ethereum: Primed for swift recovery as the network prepares for a major update in July
Ethereum price aims for a significant recovery towards $2,000. A major upgrade scheduled for July intends to fix the problem with gas fees on Ethereum. ETH miners are not happy with the decision.
Bitcoin Weekly Forecast: BTC journey to $100,000 might be easier than expected
This past week has been extremely beneficial for Bitcoin which jumped by 30% since Monday 8. Several positive announcements, especially Tesla purchasing $1.5 billion worth of the digital asset propelled the flagship cryptocurrency to new highs.