Tezos price stuck in no-trade zone while momentum builds for a massive breakout
- Tezos price is currently bounded inside a symmetrical triangle on the 4-hour chart.
- The pattern is on the verge of a breakout or breakdown.

Tezos is currently trading at $0.23 right above a critical support level. The digital asset is bounded inside a symmetrical triangle pattern that awaits a clear breakout or breakdown within the next 24 hours.
Tezos price needs to hold this crucial support level to avoid a major pullback
XTZ has established a symmetrical triangle pattern on the 4-hour chart with the lower boundary located at $0.23. A breakdown below this point would quickly drive Tezos price towards a price target of $1.9.
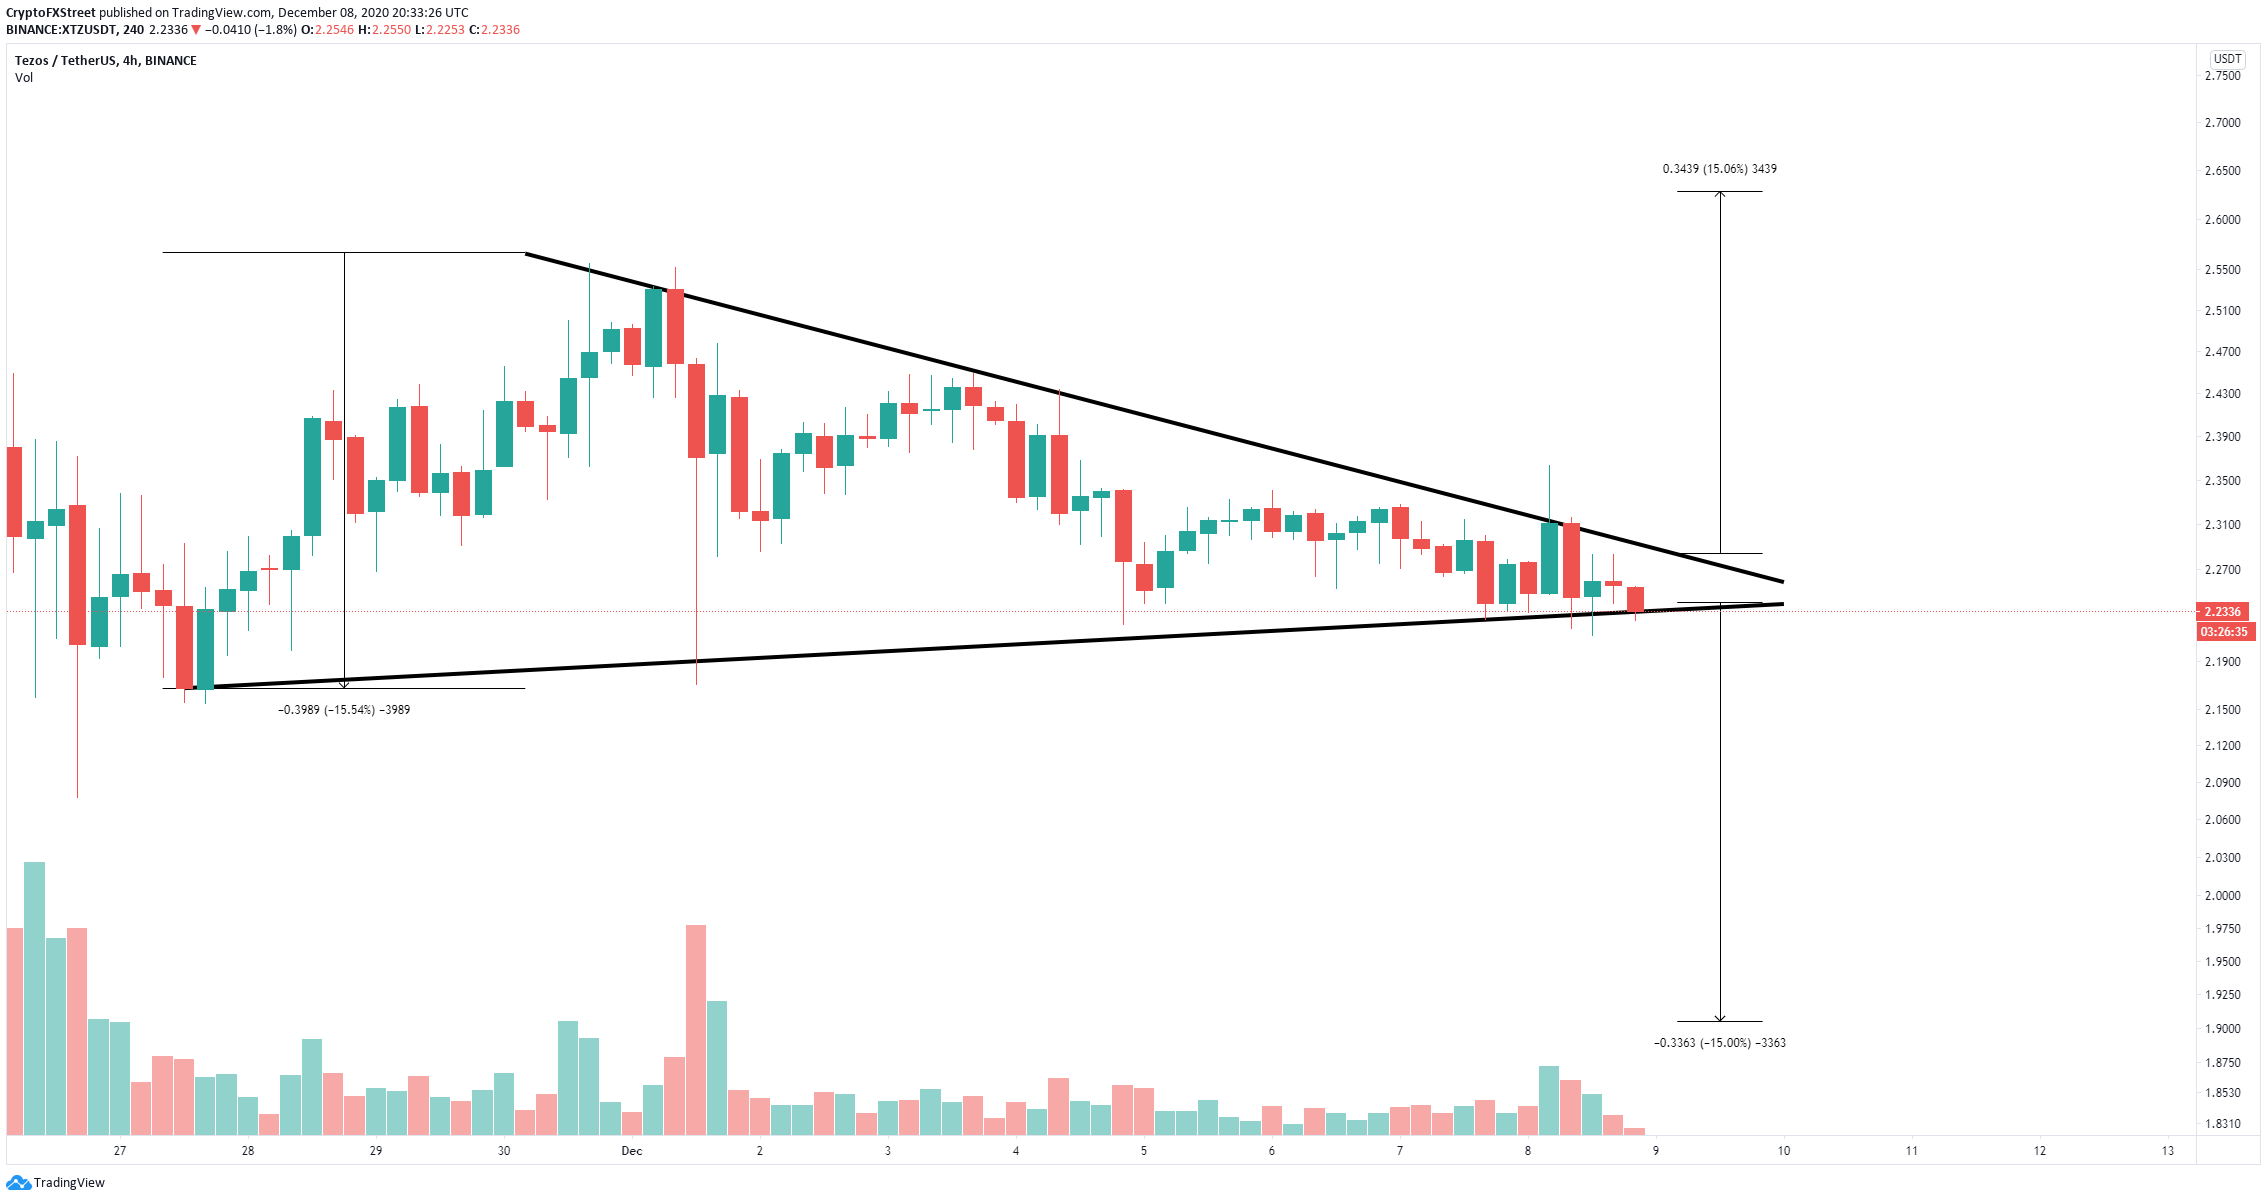
XTZ/USD 4-hour chart
On the other hand, bulls have defended another significant support level in the form of the 200-SMA on the 4-hour chart. If Tezos price can rebound from this point, it can quickly jump towards the upper trendline of the pattern.
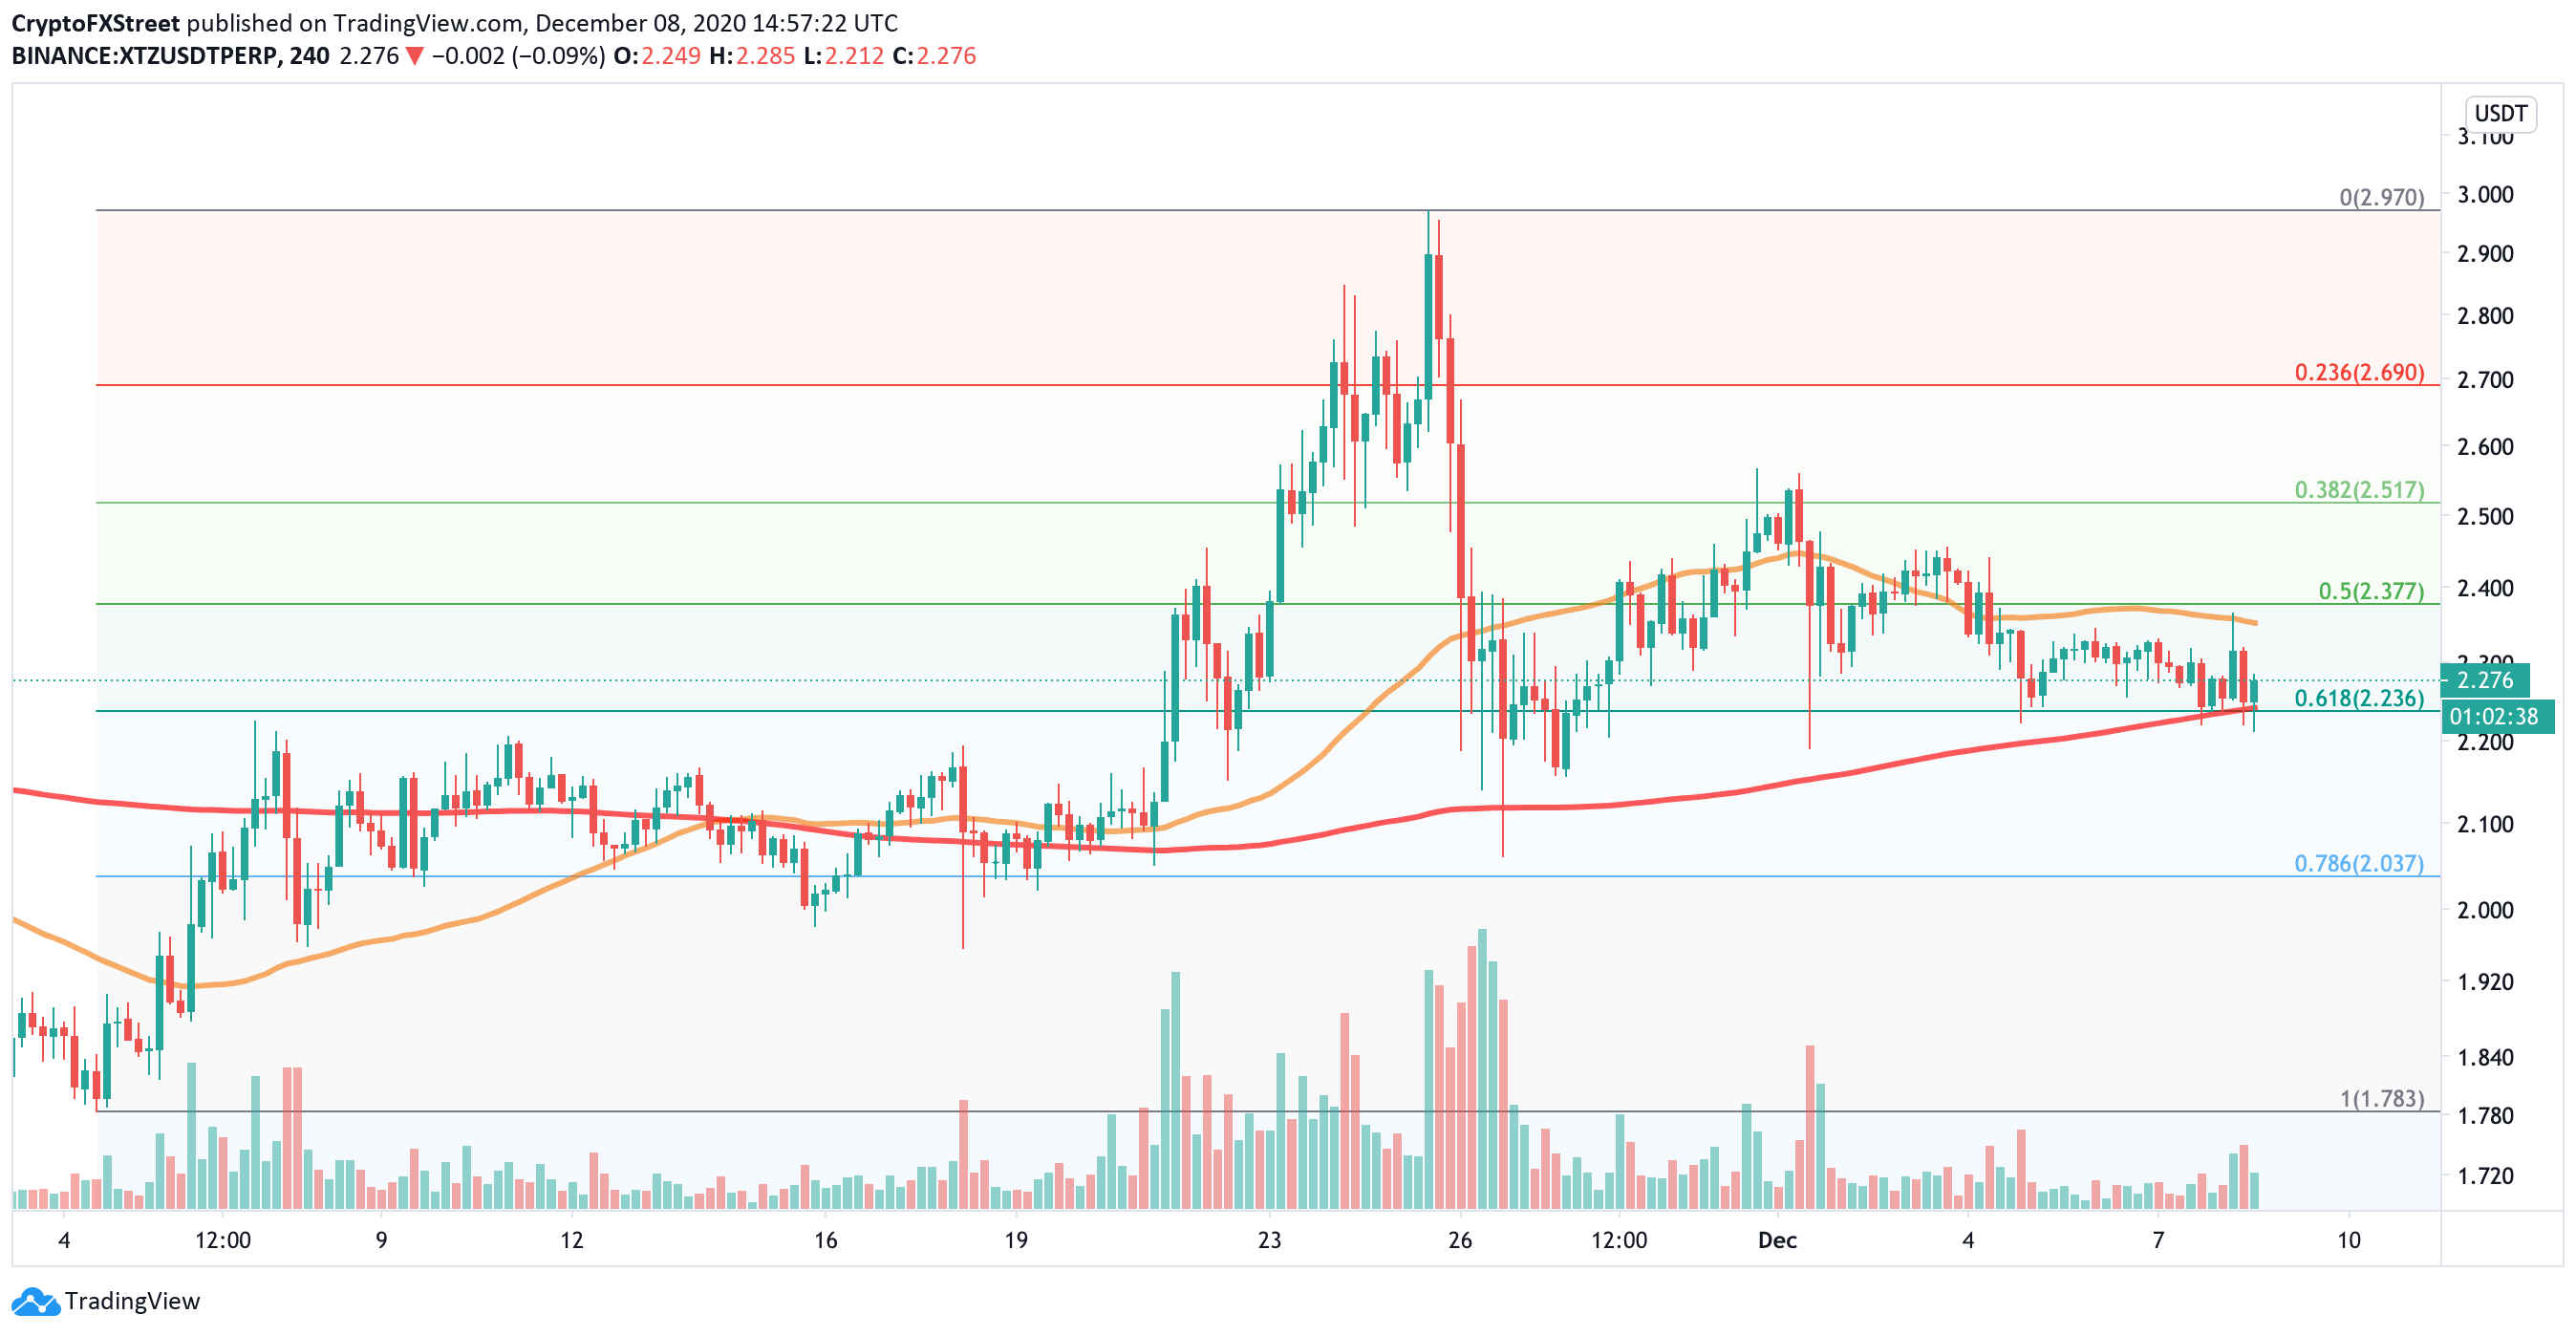
XTZ/USD 4-hour chart
A breakout from the triangle would drive Tezos price towards a price target of $2.63 which almost coincides with the 0.236 Fib retracement level at $2.69. The 0.5 Fib level at $2.51 is another potential price target.
Author

Lorenzo Stroe
Independent Analyst
Lorenzo is an experienced Technical Analyst and Content Writer who has been working in the cryptocurrency industry since 2012. He also has a passion for trading.


